Conceptual Problems of Formation of Modern Macroeconomic Stabilization Toolkit
Published May 12, 2015 — Kharkiv: KhTEI KNTEU, 2015. P. 16 -17. © Nemtsov OV
At the present stage of the development of economic thought, unstructured processes occurring in the world economy and even more so in the domestic economy, considering the analysis of those macroeconomic activities that have already been carried out by leading countries, domestic macroeconomic management experience, the following statement should be made: Macroeconomic stabilization models, which are generally fairly simple, are not possible. What is meant by simple? These are the models that take into account the relationship of two, up to three indicators (values). It becomes obvious that taking into account one of the parameters of activity at the macro level, and without paying attention to the others, one can not achieve the effect on which it will count. For example, by taxing currency transactions and thus seeking to reduce the demand for foreign currency, but, without taking into account the shadow operations, sentiment of the population and legal entities, one can only bring currency exchange events under the control of the supervisory authority, gain currency appreciation, as a result, purchase of small and medium-sized businesses that conduct import operations, valuable currency, and then will affect the rise in prices for consumer products, that is, an increase in the scale of prices in the country. Thus, on the one hand, a number of problems seem to be solved as a result of the introduction of such actions, namely reducing demand for foreign currency, stimulating the use of foreign currency, creating conditions when imported products become more valuable, and thus domestic products become more competitive, and, on the other hand, there are side problems that are not solved, which can eliminate the positive effect and even, worsening of the situation, namely, if one does not take into account the simple physical availability of domestic products, which can replace imported ones, then either a shortage of such products or a simple health, which negatively reflects on inflation processes, — inflation increases — and the social situation of the population, business entities, then, as a consequence, a decrease in consumer purchasing power, a worsening of the criminogenic situation, an increase in the number of crimes, etc. The example above illustrates only a small fragment of cause and effect due to the introduction of one action without taking into account other factors (limitations). It should be emphasized that well-known macroeconomic models were developed in the era of the deterministic nature of the development of science, including economic, which was based on the uniqueness, linear nature of relationships.
PROBLEMS OF DEVELOPMENT OF CONCEPTUAL BASES OF SOCIO-ECONOMIC SYSTEMS
published in Vienna, Austria, 2015. pp. 452 — 455. © Nemtsov OV
The article explores the development of systemic knowledge, identifies gaps in the field of historical systems research, identifies possible sources of these problems, provides the author’s vision of the essence of the system and the methodological apparatus of their research.
Keywords: socio-economic systems, methodological apparatus of systems, development of system knowledge
The use of a systematic approach in the practical work of economic entities, other organizations, regional associations, at the state level and multinationals is becoming increasingly popular in the world. From the point of view of science, the systematic approach has become scientific, and the general theory of systems, founded by L. von Bertalanffy, is recognized as scientifically grounded. Although at first glance the application of the system approach has a rather small history — from the first half of the 20th century. — it should be emphasized that the ideas of systematic were still ancient philosophers.
The conventional wisdom suggests that the definition of the system, the idea of a systematic knowledge and structure of the world, was advanced by ancient philosophers such as Plato, Aristotle, Euclid, however, it is difficult to find a detailed study of the content of their works, if there is such a study on the conceptual foundations of their ideas. about systematicity. This offers some opportunities by analyzing the ideas above to emphasize something important for the present, because, given the general universal content of their works, they are unlikely to devote their ideas to simple systems. The next thought is that, if these ideas were covered by these philosophers, there must have been some discussion in society itself about these issues, which makes it possible to assume the application of certain principles of systematicity in the scientific and practical activities of the time.
In his work, Bertalanffy explored the use of a systematic approach to Nicholas of Cusa (14th c.) And Gottfried Leibniz (17th c.), And argued for the use of systematic principles in Paracelsus’ medical practice. However, not all the nuances of the researched works were covered in his analysis, although the ideas of these philosophers and ancient scholars, as well as their predecessors, differed in their individuality, thoroughness and multidimensionality, which disregarding the formation of knowledge about systems and systematics will lead to a narrowing of the circle. depth in solving specific problems in the construction of any kind of systems, including socio-economic ones.
In addition to the aforementioned authors, many philosophers, scientists, practitioners from various fields of knowledge have been engaged in systematic studies. In this review we will not focus on the features of the scientific works of the aforementioned researchers, since it is a separate, painstaking and considerable work; let us turn our attention to the most recent discussions on this subject in the present society.
Yes, V.Ya. In his article «Towards a Systemic Principle: A General Systems Theory and an Alternative Approach», published in Potsdam USA in 2004, Dubrovsky analyzes the work of systematic scientists, the views of the International Society for Systems Sciences (ISSS), and on this basis expresses his own an alternative perspective on the conceptual foundations of general systems theory. By the way, his statements are both interesting and quite debatable. Referring to the statement of G.P. Shchedrovitsky’s work » Problems of Methodology of Systematic Research » for 1964, he proclaims the following: «… systems are real, but our methods and corresponding representations may correspond to this reality and may not correspond to it. But if the «real systems» allow the treatment of a like with the systems, but also how to not systems, then why not assume that the reality is not is neither a system nor the non-systemic, and only our methods and corresponding representations of real objects by the system or not systemic ”[1].
At first glance, this statement is difficult to argue, but there are so-called natural systems of a given origin, and with the help of our senses can be identified as not separate objects located separately from each other, but still as elements of something whole. If we take such a natural system as planet Earth, then its components — seas, oceans, mountains, rivers, forests, fields, deserts, etc. do not exist in isolation, they interact and affect much of one another, which allows the planet to exist in a single form of material body consisting of the above components (elements or components). An example of natural systems is taken because it is a given reality that has not been created by man. Certainly, to say about artificial systems, that they are a reality in terms of their construction, is wrong,V.Ya. Dubrovsky, to settle on G.P. Shchedrovitsky, I’ll swear: “ From the point of view of the activity approach, which the author of this article adheres to, the system is not a real object independent of our activity, but a real subject of systemic thinking or understanding ” [1].
It should also be noted that the design of natural systems, too, is known by mankind: some natural systems have been investigated more deeply, some quite unknown, so we have representations of natural systems with varying degrees of certainty, but as stated before, formal logic suggests that nevertheless, these are not separate objects but elements of the system. Thus, today any system is artificial, that is, a superstructure of our consciousness, so any real (existing) system can be said to be stochastic, because it or always has random factors (elements) about it, which we do not yet know. Therefore, when designing purely artificial systems, which are socio-economic systems, we can take into account the analogy and knowledge that we have about the studied natural systems, because, as the historical experience shows, though they fail, they still strike a balance and are viable. However, you should never forget that the analogy will never be complete.
But most importantly, all systems to which analogies apply, systems that are analogues — all of them are conditionally systems, conditionally isolated according to the tasks of researchers, because they are all subsystems or components of the system of higher hierarchical level, which is the universe. Therefore, the allocation to closed and open systems is also conditional. In this sense, the only closed system is the Universe, which has no external environment, which means that there are no material and energy flows of natural origin entering and leaving this system, which does not exclude the possibility of energy flows of non-origin. And by its very nature, the Universe is the only system that exists in reality, regardless of the constructions in our thinking, although in our perception its structure is certainly different from its real structure. From that, as our conception of its structure approaches reality, the closer we come to knowing the real picture of being. In this context, and given the absence of external influences affecting its entropy, the Universe itself cannot be a stochastic system, since all its elements (factors) are known, all connections between them are revealed, as well as laws (principles), by which it functions. Whether the universe is a dynamic system is also a question. If there is a constant like time, and if there is movement of the universe along the axis of this variable, then it is dynamic, if not, then conditionally static, since there are parts of this system where changes take place over time — for example, planet Earth. Based on the above, it becomes clear that today there is a well-developed toolkit for the study of artificial and conditionally artificial systems (by them we mean natural systems that are constructed by our thinking, based on the goals and objectives of researchers). However, the methodology of the study of the natural system (Universe) and its components is still in its infancy, which is a consequence of its super-complex structure.
Further consideration should be given to the extent to which artificial and conditional artificial systems can be closed, that is, which, when interacting with the external environment, do not change their goals and functions. The answer, in our view, is obvious: if you artificially place the system in a vacuum or in conditions that would not allow it to interact with the environment. Therefore, it is also necessary to talk about the conditional closure of the system.
Returning to the ideas outlined in V.Ya. Dubrovsky, it is also necessary to discuss regarding the thesis that «the study of systems is not able to produce system-wide principles » [1] . It is also stated that in Bertalanffy, the » general system principle» is used in at least three different meanings. The first value- this is a derived isomorphism common only to a certain type of systems … The second meaning of this term is a derivative isomorphism common to any systems … The third value … is the basis for derivatives of isomorphisms … ” [1]. In Kinets, stayed: V.Ya. Dubrovsky means, that Bertalanfi should introduce the principle of “upstream systemic tilka”, “… as a principle of minimal action, … balance and rhythmic fluctuations, the existence of stable states …”[1]. However, it should be noted that the general principles of Bertalanffy include the following: integrity, centralization, differentiation, the leading part of the system, closed and open systems, finality, equivalence, growth in time, relative growth, competition [2]. Asserting that the principle applies in three different meanings, we can say that there is an attempt to build principles on a hierarchy, and in our opinion, this is true, since it is possible to construct a certain hierarchical structure — a system of principles, the core of which are general scientific principles, then principles a specific area of knowledge, then specific principles of a particular phenomenon, process (see [3] for more details). It should also be noted that by empirically investigating different types of systems, well-known systemic principles have been formulated (for more details see [3].)
Literature:
1. Dubrovsky, VJ Toward system principles: General system theory and the alternative approach. [Electronic resource] / VJ Dubrovsky // Systems Research and Behavioral Science, trans. from English “Center for Humanitarian Technologies” — 2012.08.03. — Clarkson University, Potsdam, NY — 2004 — 21 — pp. 109–122. — Access mode: http://gtmarket.ru/laboratory/expertize/6566 .
2. Bertalanffy L von. History and status of the general theory of systems / Ludwig von Bertalanffy // System Studies: e yearbook. — M .: Science, 1973 . — 56 p.
3.Nemtsov OV Modern approaches to the mechanism of realization and methodology of formation of planning system at the enterprise / OV Nemtsov // Economics: problems of theory and practice. — Dnipropetrovsk: DNU, 2008. — Vyp. 243, v. 3. — P. 592-603.
Marketing Approach to Reforming the Housing and Utilities Sector: Problems, Condition, Solutions
published in 2012 — K.: KNEU. — 2012- P. 378-390 © Nemtsov OV
Annotation.The main trends of the market’s housing and communal services have reviewed, including in the heat-power segment, at the meso-, macro- and global level, the problems and the causal factors of these have identified, and the ways of their tackle in the complex marketing have suggested.
Keywords: the market of housing and communal services, housing and communal services (utilities), heat-power engineering, heat supply, district heating, energy resources, public service, thermal energy.
Formulation of the problem in general.
The housing and communal services market is characterized by a crisis today, and in some regions of Ukraine this industry is close to environmental or technological catastrophe, which incidentally has already taken place in real life, such as failure of Alchevsk district heating systems, problems that occur periodically. other places related to the temporary cessation of hot or cold water supply, the occurrence of natural landfills, shutdown of elevators, etc. This is explained by certain factors, the main ones being the lack of a marketing approach to managing the industry and the lack of a competitive environment in the housing and utilities market. Other factors include: resource intensity and a rather wasteful approach in carrying out its activities; moral and physical obsolescence of fixed assets, namely the heat, water and sewerage networks, which have already been heavily demolished since they were laid in the early or mid-20th century; the lack or poor quality of capital and current repairs, which were mostly carried out with abuse, which did not result in the renewal of fixed assets; lack of money and political will. In recent years, this debate has gained scientific and practical meaning, and some changes in the law and, most importantly, in the worldview of the Ukrainian citizens themselves have begun, which on the one hand are the hostages of the existing situation, and on the other hand, the main driving force for change, which can dramatically change such a plight. Therefore, it is relevant today to discuss mechanisms and techniques based on marketing principles, Analysis of recent research and publications. Among the scientists and practitioners who were engaged in the study of problems of housing reform, development and improvement of methodology, methodology and mechanism of its implementation can be called the following: L.M. Shutenko, V.O. Petrosov, VI Tityaev, V.M. Babayev, OM Tishchenko, VI Torkatyuk, TI Lepeyko, T.P. Yuryeva, S.Yu. Yuryeva, Yu.G. V.M. Amitan, V.V. Virmenko, A.I. Anfertyeva, SO Pogosov, L.P. Belykh, MO Fedotova, V.V. Buzerev, V.S. Chekalin, V.B. Veselovsky, O.G. Voronin, IM Gerchikova, S.R. Khachataryan, A.M. Kirilova.
The purpose and purpose of the article.Investigate the state of housing and communal services, including heat utilities, identify the problems that have arisen in the housing sector today and analyze ways to overcome them, offering their own vision for reforming the industry.
Outline of the main research material. The housing and communal services market of any country today has a significant place in the attention of both the state and local self-government bodies, and in countries with developed democratic institutions — even territorial communities, in countries of the post-Soviet space, where the civil society institution is not developed — individual households. The heat consumption in the world produced by district heating is presented in Figure 1.
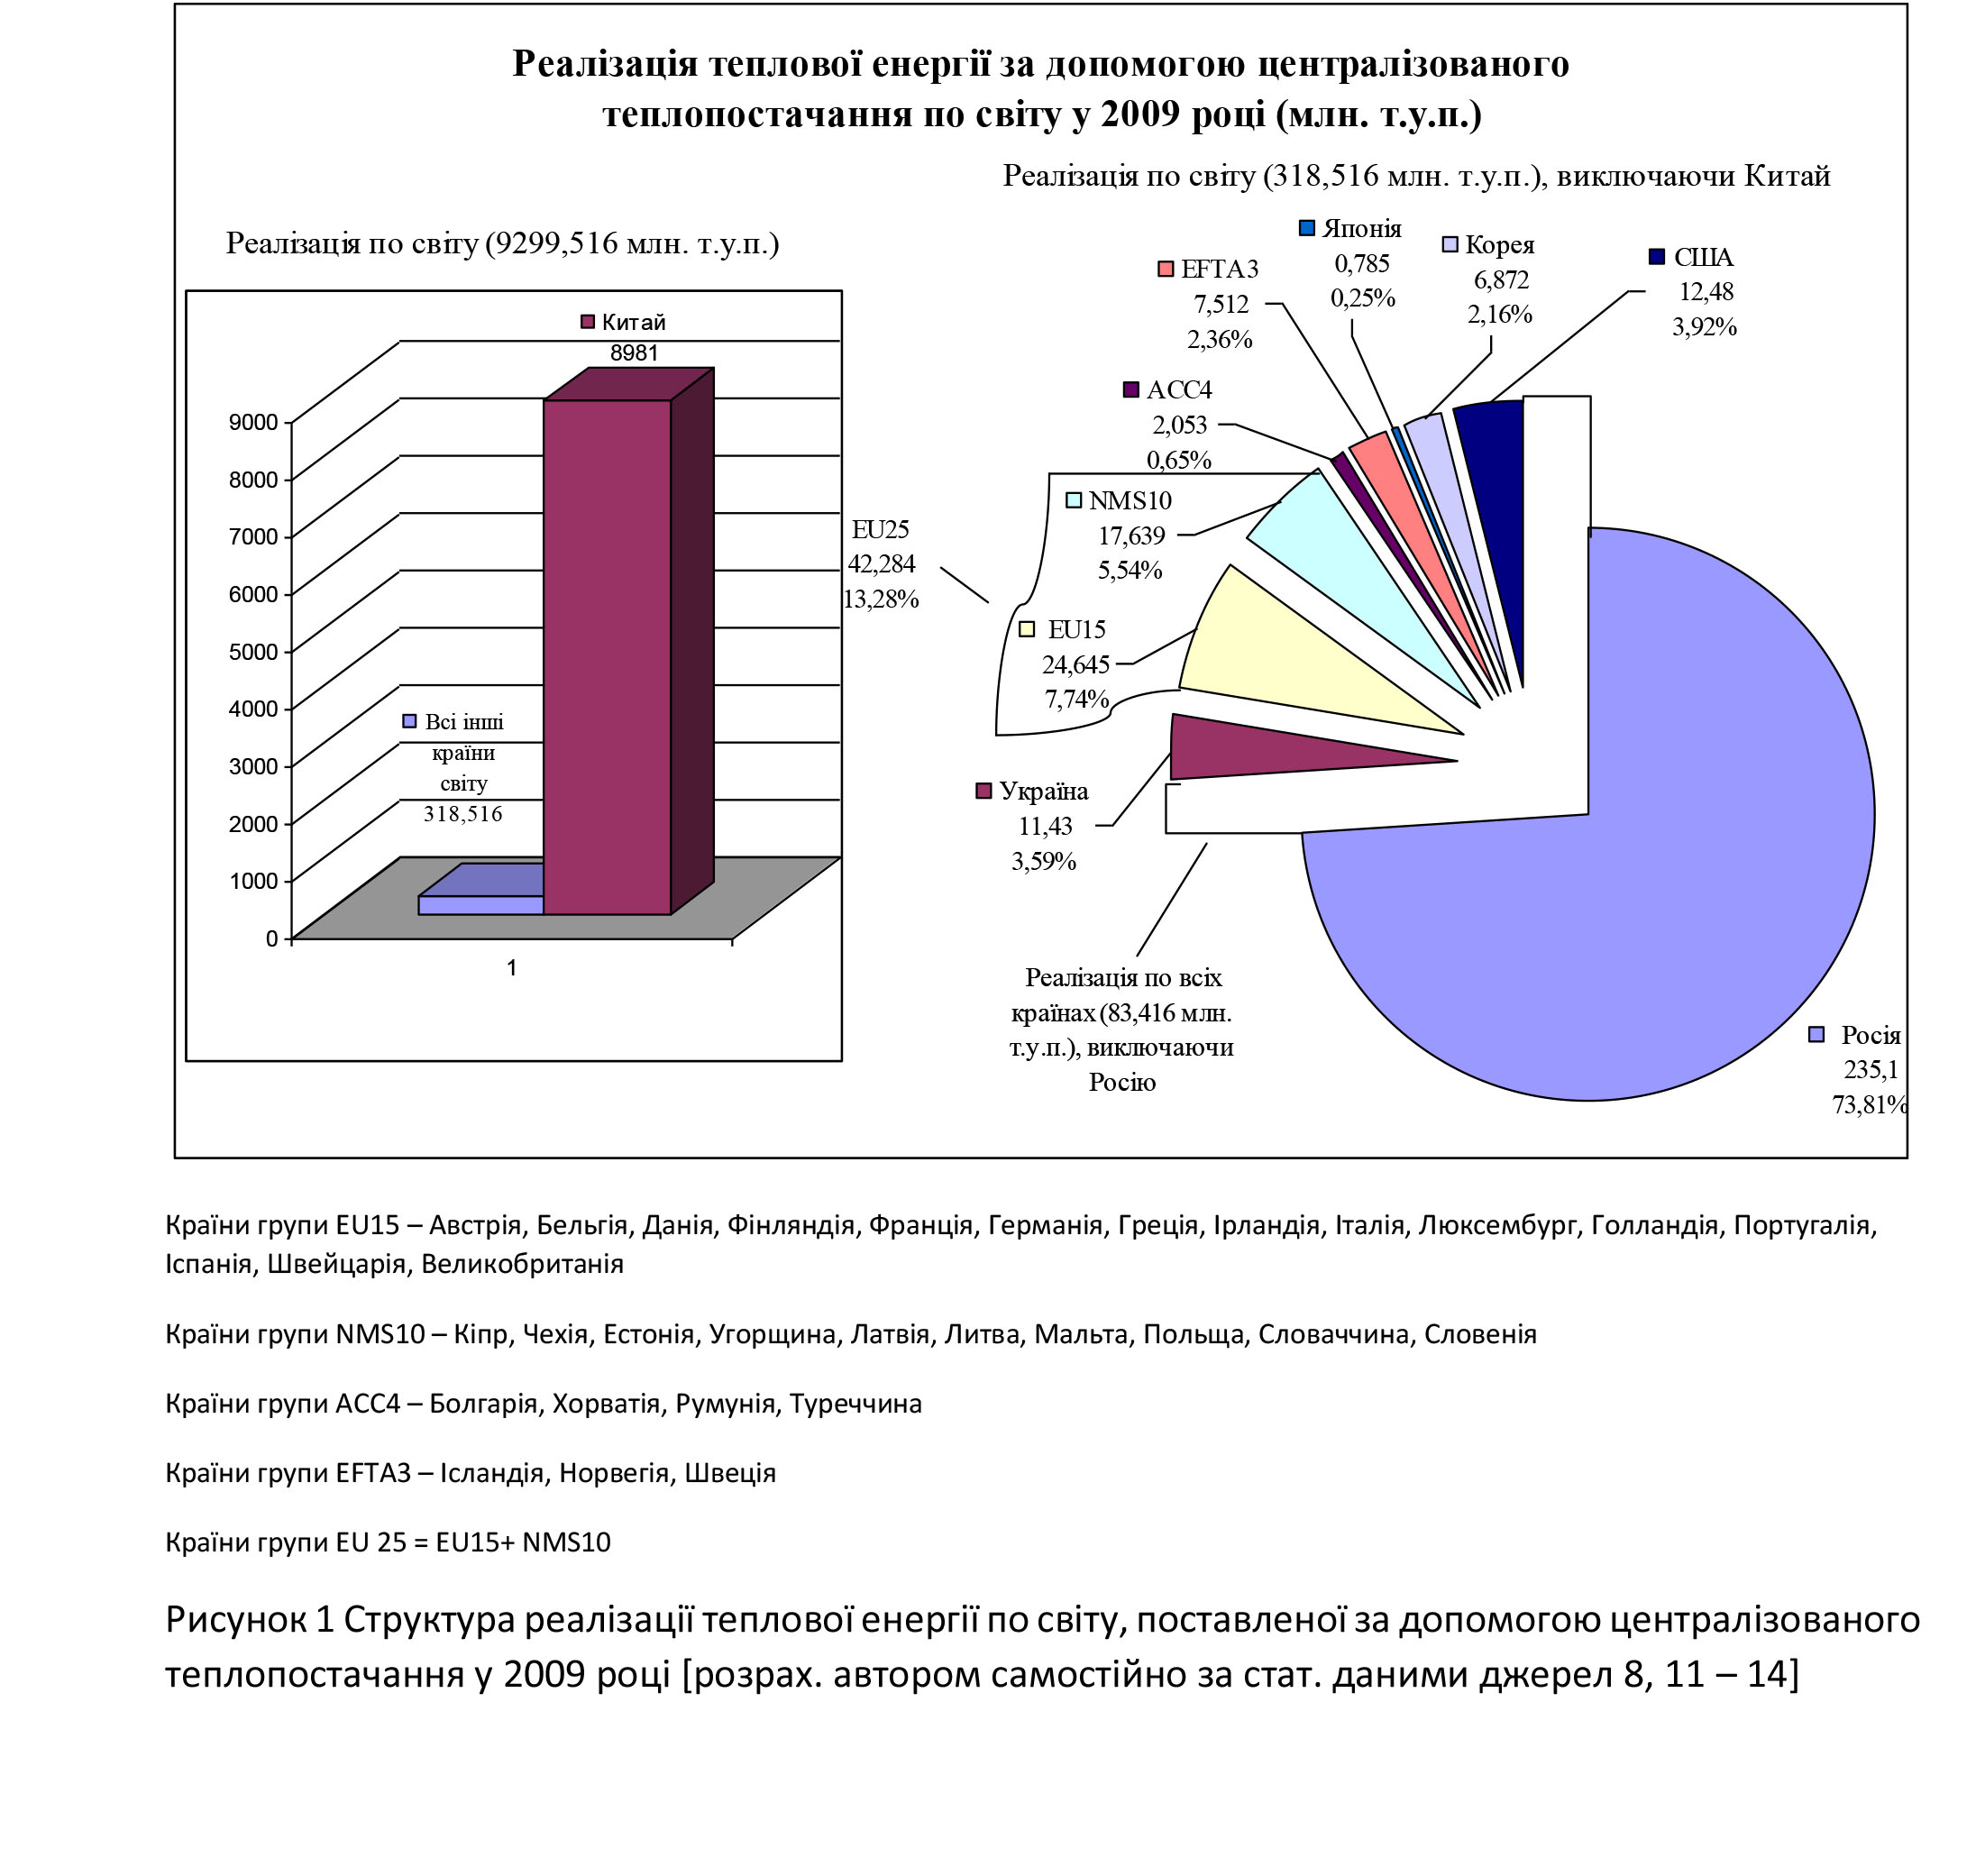
As can be seen from the chart above, energy consumption by the post-Soviet countries occupies a leading position among countries all over the world, second only to China, with the first and second place belongs respectively to the Russian Federation and Ukraine (the US recently began to outstrip Ukraine, and in terms of the realization of heat energy supplied in a centralized way, the US per capita rate is lower). This is explained by the many structural problems that have accumulated in the communal sector of these countries over the years 1990-2000, although at the end of the stay of these countries within the USSR there were also such problems.
The governments of all countries are trying to improve the level of housing and communal services, to develop their resource efficiency and savings, since most of the resources that underlie the utilities process are of natural origin and are exhaustive. Today, in developed and advanced developing countries, particular attention is paid to the use of renewable resources and the replacement of exhaustive resources, especially in the field of thermal power, where, among other things, there is a trend towards a depletion of exhaustive resources. In connection with these problems, there are everywhere the development of innovative ways of generating electricity and heat, which is reflected in the name of the scientific direction — alternative energy.
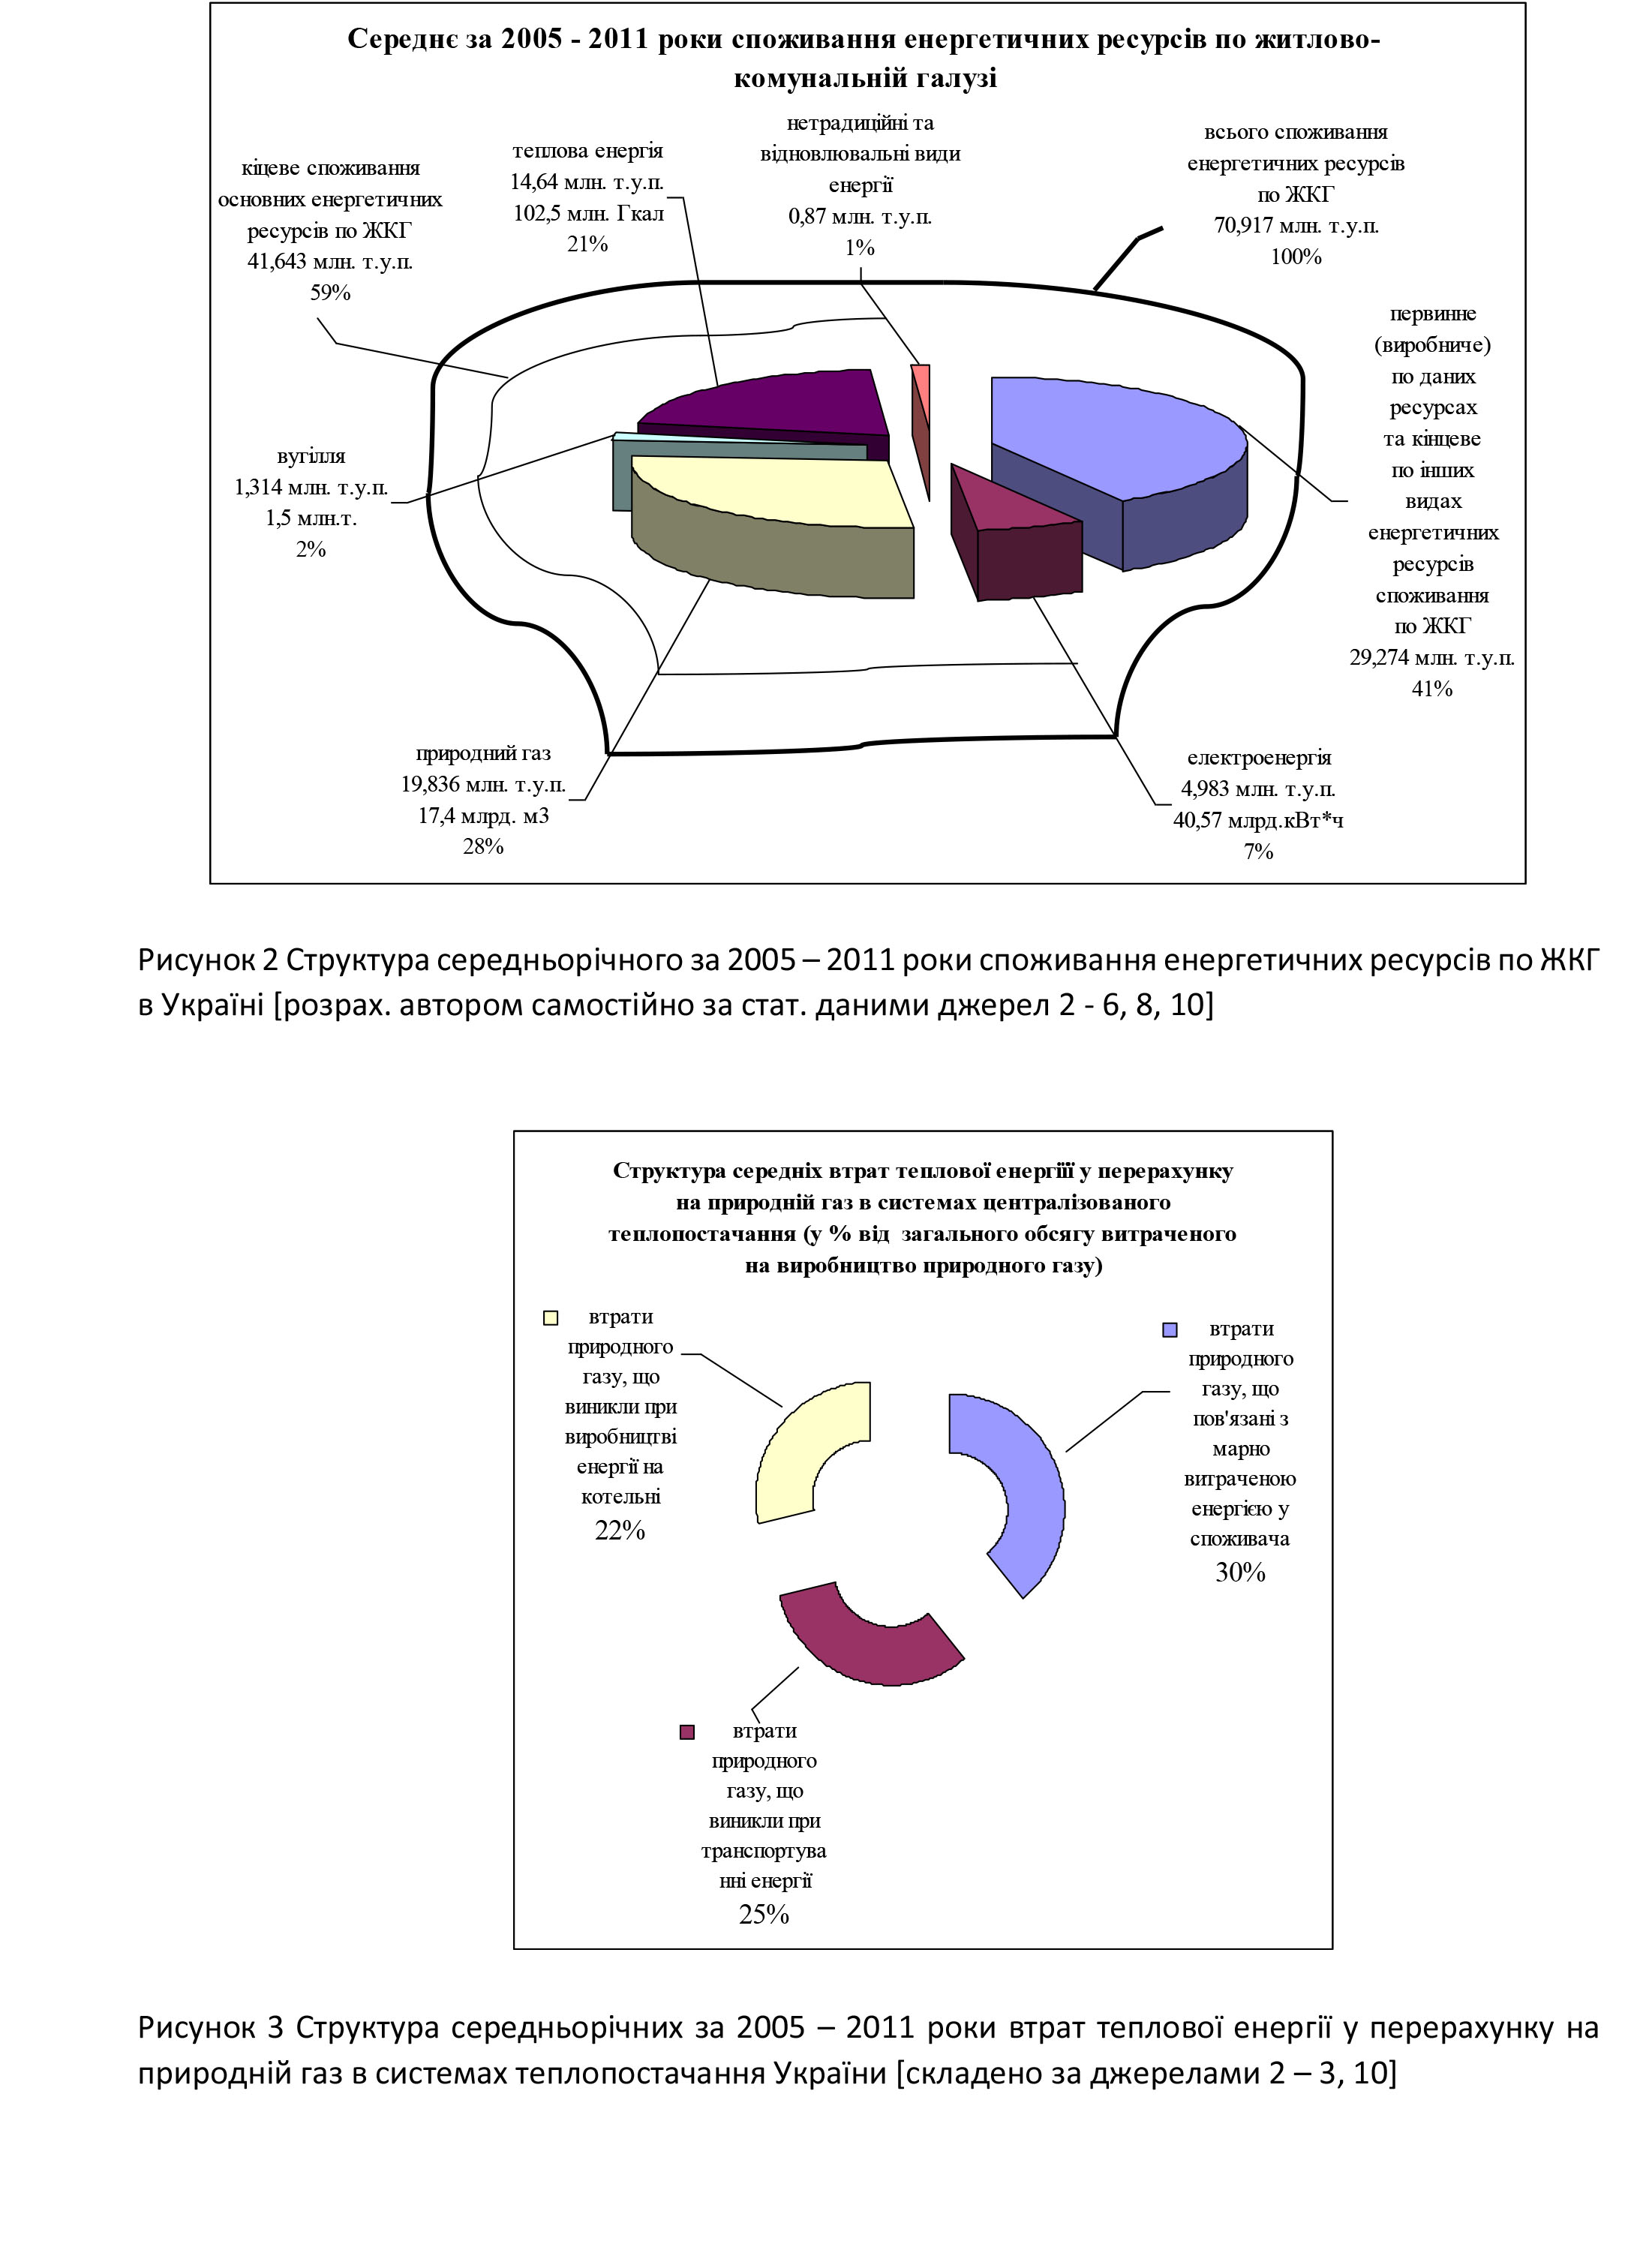
The utilities of Ukraine are now balancing on the brink of crisis, the extent of which cannot be accurately and accurately predicted, since this sector is infrastructural for many other sectors of the economy and vital for the whole population, it provides environmental and as a consequence economic security of the state. If we rank the types of utilities according to the degree of danger and the level of unresolved problems, the first place will belong to the electric power and heat power industry, the latter being in a worse condition than the first. Indicators of consumption and production of energy resources by housing and communal services are presented in Figure 2.
The main analytical indicators for energy consumption in Ukraine in comparison with the world standards of developed countries are presented in Table 1.
Table 1 — Key Indicators Characterizing Energy Consumption in Ukraine for 2005 — 2011 [Compiled by Sources 2 — 10]
Indicator | indicator value |
Share of consumption of energy resources in housing and communal services in relation to other sectors of the economy | 54% |
Expenditure of energy resources on housing and utilities per capita in Ukraine | 0.7 — 1.0 tp |
Fuel costs for the production of 1 Gcal of heat in municipal heating in Ukraine | 160 — 180 kg |
Fuel consumption for the production of 1 Gcal of heat in municipal heat in developed countries | 145 — 150 kg |
Harmful emissions into the atmosphere in Ukraine | 45 g / MJSO 2 |
Harmful emissions into the atmosphere in developed countries | 26 g / MJSO 2 |
Energy intensity of the national product in Ukraine | 0.89 kgf / USD |
Energy intensity of national product in developed countries | 0.26 — 0.35 kgf / USD |
The structure of average losses of thermal energy and volumes of various types of fuel in terms of natural gas in district heating systems is quite evident from the point of view of wasteful use of valuable resources (Figure 3).
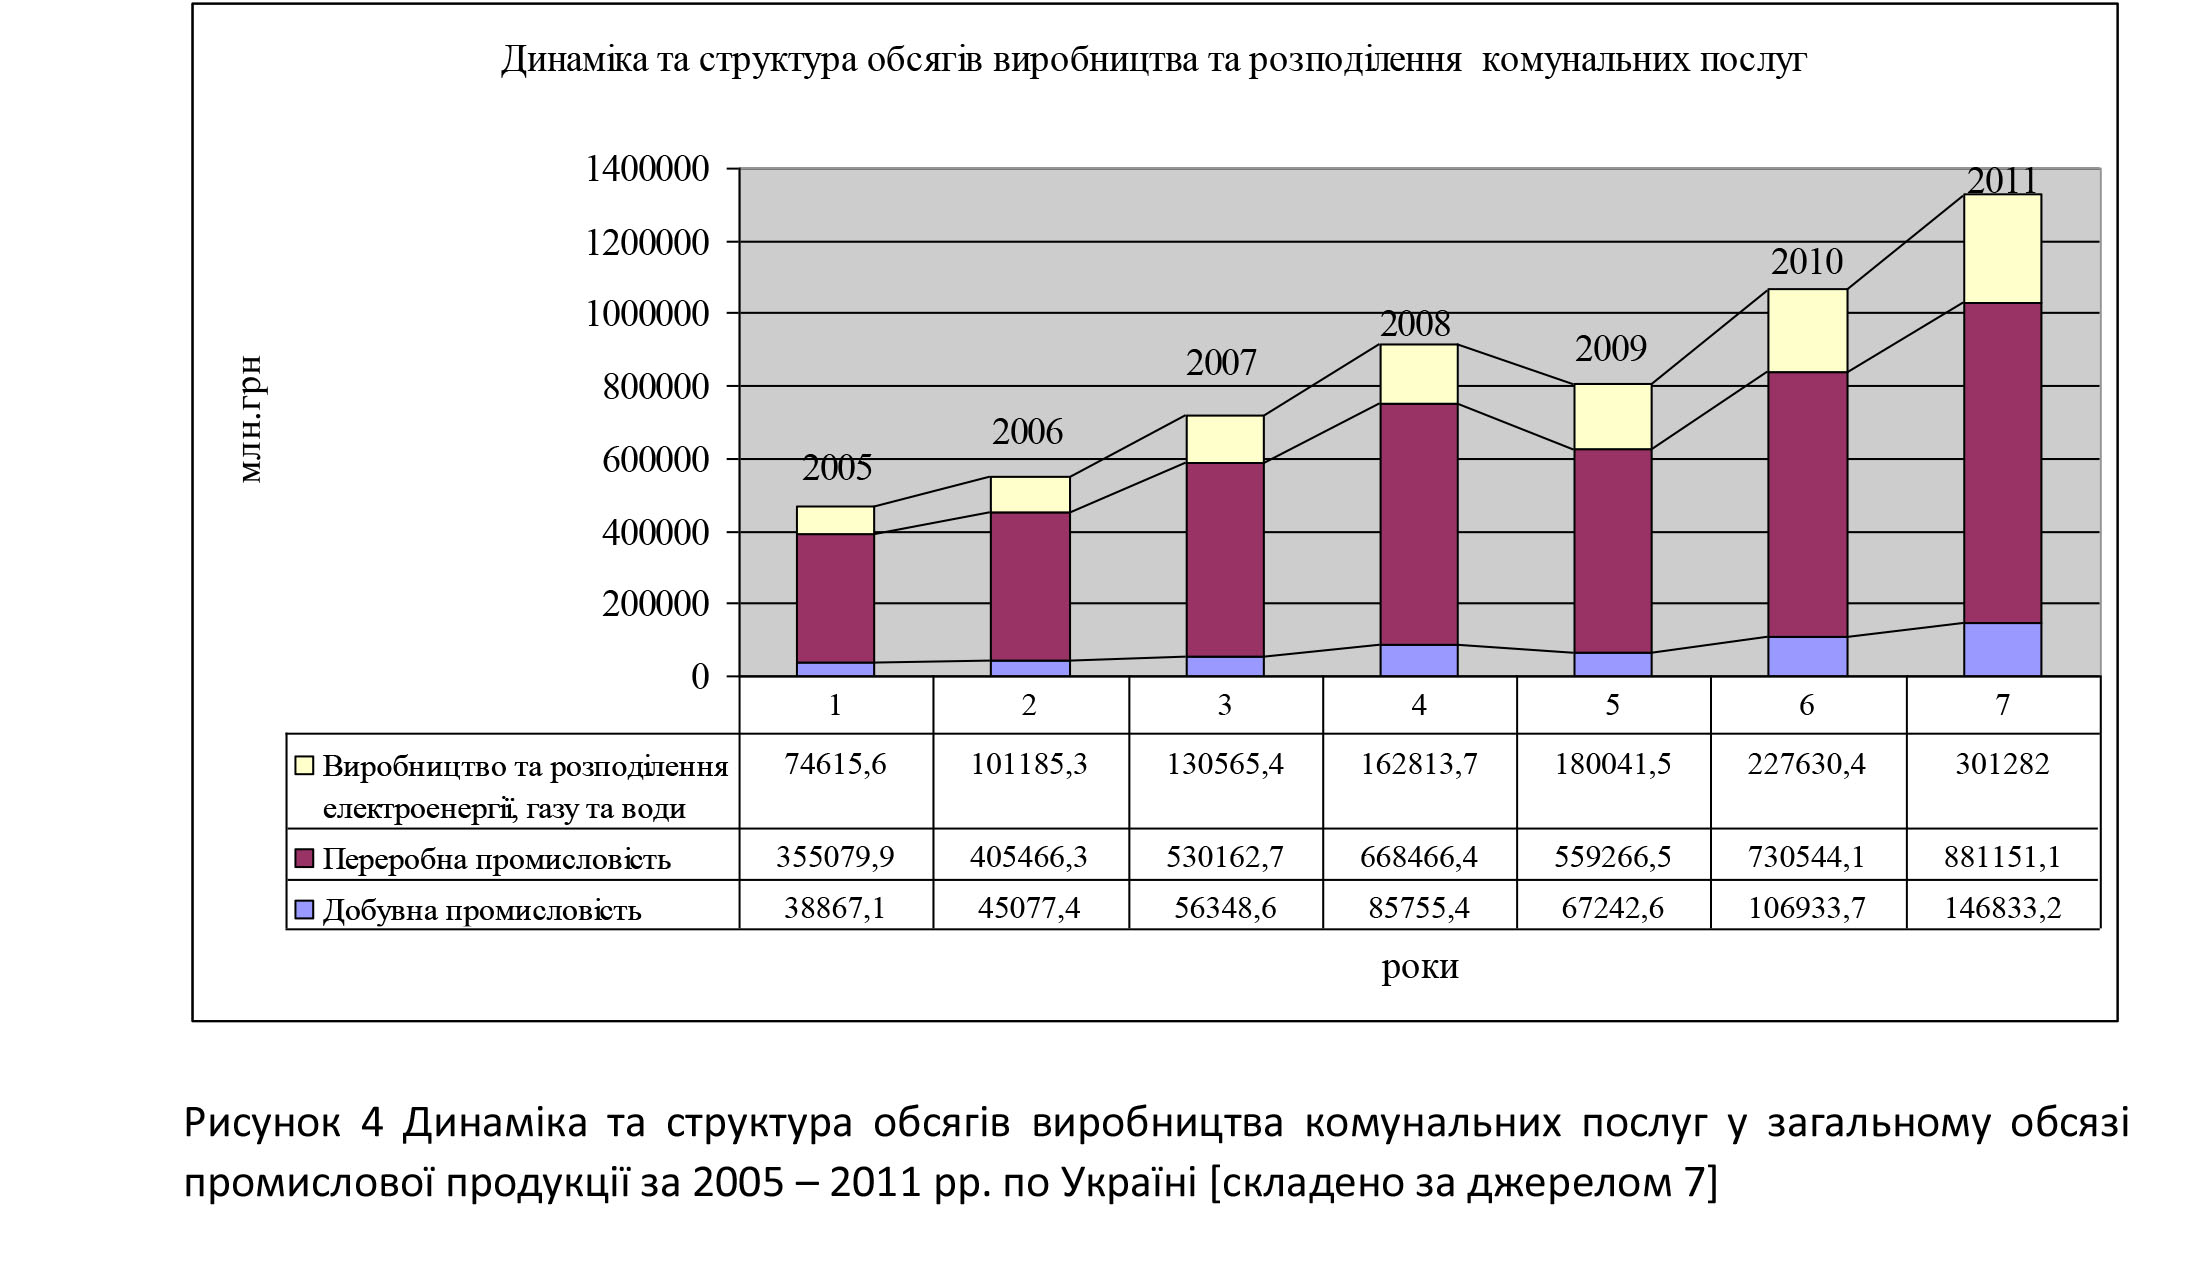
The volume of sales of housing and communal services, as well as their share in the total volume of sales will give a clear idea of the state of affairs and importance of this branch of the national economy. The dynamics and structure of the volumes of production and distribution of electricity, gas and water in the total volume of industrial production for 2001 — 2011 are presented in Figure 4.
The main production and financial performance of the housing and communal services industry, including heat supply in Ukraine, Kharkiv region and Kharkiv district heating companies are presented in Table 2.
Table 2 — Main Housing Indicators for 2011 [compiled by Sources 1.9]
Indicator | indicator value | |||||
across Ukraine | in the Kharkov region | in Kharkov | The share occupied by the region in the country | The share occupied by the garden in the country | The share occupied by the garden in the area | |
Total boiler houses at the end of the year, thousand units | 35.1 | 1,855 | 0.27 | 0.05 | 0.01 | 0.15 |
Generated thermal energy, million Gcal | 104.7 | 10,086 | 4,181 | 0.10 | 0.04 | 0.41 |
Received heat. energy. on the side, million Gcal | 9.6 | 2,411 | 2,412 | 0.25 | 0.25 | 1.00 |
Expenditure on thermal energy for own production needs of boiler plants, mln. Gcal | 3.2 | 0.317 | 0,067 | 0.10 | 0.02 | 0.21 |
Thermal energy, million Gcal | 97.6 | 10,793 | 5,501 | 0.11 | 0.06 | 0.51 |
population | 54.7 | 6,298 | 4,731 | 0.12 | 0.09 | 0.75 |
for communal needs | 22.6 | 1,664 | 0.77 | 0,07 | 0,03 | 0.46 |
Thermal energy losses, million Gcal | 13.5 | 1,386 | 1,037 | 0.10 | 0.08 | 0.75 |
The level of payment to the population for housing,% | 97.8 | 96.4 | — | — | — | — |
Level of payment to the population for heat supply,% | 96.3 | 94.7 | 109.5 | — | — | — |
Growth rate of public debt on utility bills,% | 102.8 | 103.3 | — | — | — | — |
Growth rate of population’s debt on heat supply,% | 104.5 | 105 | — | — | — | |
The term of debt of the population on payment of housing and communal services, months | 3.9 | 4.8 | 4.2 | — | — | — |
The amount contracted for, in terms of payments on repayment of restructured debt from the beginning of the year, mln. | 233,254 | 11,578 | 2,819 | 0.05 | 0.01 | 0.24 |
The amount of payments made to repay the restructured debt from the beginning of the year, mln. | 210,293 | 11,071 | 2,756 | 0.05 | 0.01 | 0.25 |
As can be seen from Table 2, the district heating companies of Kharkiv, which are integrated into a single complex of KP «Kharkiv Thermal Networks», occupy a considerable place in the national LCD services market, and, based on the comparison of the number of boilers, boilers and connected capacity, are still quite good. potential and, compared to other regions, powerful, and thus newer equipment. As a whole, considerable debt can be noted in the industry, Kharkiv region and Kharkiv, which has tended to be repaid lately, and in the past.
In general, based on the above diagrams and tables, as well as the preliminary analysis of statistical and research sources, we can draw a number of conclusions about the tendencies of the market of housing and communal services and urgent problems that have arisen in the housing and communal services, in particular the thermal power industry:
- The enterprises of the industry, while carrying out their commodity policy in terms of quality and its technical component, there is an incomplete load of their connected capacities (49 million Gcal / year from 70.5 million Gcal / year of passport capacity), which leads to fuel consumption, which goes to heating the coolant;
- Physical and moral wear and tear of the machinery, the most modern of which has been in operation for more than 20 years, which results in fuel consumption over 20% of world standards;
- The efficiency of most hot water boilers is less than 82%, and the preliminary thermal insulation of thermal networks is only 854 km from 21,700 km of its total length, which is equal to 3.9% of the required insulation rate;
- The state of emergency is 2434.3 km, which equals 11.2% of the total length, and at the 900 km conversion rate, only 500 km is replaced annually, which is 55% of the norm (underperformance is 45%), resulting in heat loss. 13 million Gcal or 11% of the amount of heat released, which in terms of natural gas is 2.1 billion m 3 , or 15% of the total consumption of the industry;
- Communication policy is characterized by low consumer awareness of energy-saving measures, as well as poor public relations work to clarify environmental issues, including energy consumption, lack of well-established communication channels and partnerships, and shortcomings in the use of consumer services. ;
- Lack of transparency, clarity and clarity of tariff setting in utility pricing policies, including heat supply, low mobility and flexibility of setting and approving the cost of services and tariffs;
- Complete lack of innovative technologies, partial or complete mismatch of equipment and equipment to the latest requirements for energy saving and economical consumption of energy resources;
- Problems in management, lack of clear organization of production, financial and communication processes, low motivation of staff to improve the efficiency of economic activity of enterprises in the industry, which leads to the formation of negative image of both individual enterprises and the industry as a whole, and prevents inflow of investment stability of their work;
- Low level of implementation of existing legislative and regulatory acts at all levels of relations of the subjects of the industry, lack of control mechanism and sanctions for poor performance of their duties by all parties to the process.
The results of the conducted market analysis of the global, national and regional markets of housing and communal services provided an opportunity to propose a series of measures aimed at improving housing and utilities activities, in particular in the power industry:
- Within the framework of the pricing policy it is necessary to introduce a system of tight control over the costs and use of resources by utility companies from all stakeholders — from individual consumers, territorial communities, public organizations to local and state authorities.
- To realize the first point, it is necessary to create and put into effect an information system based on the principles of transparency, honesty, clarity, simplicity of perception, which would inform the above-mentioned stakeholders in an operational mode about the state of the industry, its problems, ways of overcoming these problems, efficiency of using investment funds. the costs and running costs, above all, of direct consumers of these services, as well as of other institutional investors.
- Improve communication policy on the part of utility companies, as well as other bodies of municipal and state power, which are within the sphere and competence of regulation and management of the industry, through the introduction of social dialogue, friendly, partnerships between the above parties and consumers of utilities, as well as other parties .
- Priority energy-saving measures under the commodity policy to insulate existing buildings, buildings and constructions under heating by reducing the thermal conductivity of the outer walls and replacing the windows with less heat-conducting effect, which will allow, based on the experience of Bulgaria and the Baltic countries, to reduce 50% of the total.
- In parallel with the above-mentioned actions, it is desirable to start measures to reduce heat losses during the transport of heat networks of the coolant from the place of production to the places of consumption, by carrying out works on thermal insulation of already existing thermal networks and pre-insulation of pipes when laying new networks, using modern materials for making their pipes and insulation (for example, polyurethane, polypropylene).
- When carrying out the preliminary measure, to follow this order — first isolate the inner boiler and internal house pipes, having previously replaced them with pipes of the latest low-thermal conductive materials, then carry out the same actions with the central highways.
- Replacement of obsolete burners in parallel (this measure requires a small amount of investment, so it can be done in parallel), then reconstruction of the boilers’ flue gas heat recyclers, reconstruction of the boilers where feasible and economically feasible, and purchase of new highly efficient, powerful K not lower than 80%.
- To establish individual heat points, individual (in each apartment, home, organization that is heated) means of metering and regulation of heat consumption, based on the experience of the countries of Eastern Europe, which conducted this event, will allow to save up to 30% of the consumed heat energy.
- To refuse and gradually move from purely boiler-houses that produce only thermal energy to thermal power plants and a cogenerative way of producing electricity, a by-product of which is thermal energy, which fully corresponds to the modern aspirations and realities of the developed countries, whereby centralized production and realization of its energy distribution in these countries.
- To carry out preliminary diagnostics and optimization of district heating schemes of settlements.
Conclusions.The housing and communal services market is part of the strategic interests of any country, subject to special supervision by the state and municipalities, and in developed countries by civil society. In Ukraine, this market is in a state of turmoil, which, on the one hand, provides opportunities for its development, rapid structural restructuring, and on the other hand, is a rather threatening technogenic, environmental and social problem. Countries of the post-soviet space, including Ukraine, due to the historical imitation of branched heat networks in the territories of these countries, have a rather large competitive advantage, since about 90% of the total housing stock is connected to district heating systems, which in the case of a cogeneration mode of heat and electricity generation a widespread and implemented measure among developed countries, that cannot boast of such an extensive centralized thermal power infrastructure. In the case of a gradual, systematic and continuous process of reorganization of the housing and communal services, in particular heat power, on the basis of a marketing approach, Ukraine can obtain a significant enough benefit that will manifest itself in all aspects of management — social, economic, infrastructural, environmental, political, and improve comfort life of a cross Ukrainian.
List of references
1. DGUSHO. Express Issue 01.03.2012 № 218 . Main indicators of heating plants and heating systems in the Kharkiv region in 2011 / Der same komstat main control pan and ting statistics in Kharkiv and vsk and also areas and [ electronic resource ] / Daily access to the resource : http : // uprstat . kharkov . ukrtel . net / ua / express / 2012_ rick . html .
2. SSSU. Selected technical and economic performance of the heating boiler and heating systems 2011 / State Statistics Service of Ukraine [ electronic resource ] / Daily access to the resource : http://www.ukrstat.gov.ua/ .
3. SSSU Selected technical and economic performance of the heating boiler and heating systems for the 2005-2010 / State Statistics Service of Ukraine [ electronic resource ] / Daily access to the resource : http://www.ukrstat.gov.ua/ .
4. SSSU. Electrobalance / State Statistics Service of Ukraine [ Electronic resource ] / Access modein the resource : http://www.ukrstat.gov.ua/
5. SSSU. Selected technical and economic performance of the gas distribution business in 2011 / State Statistics Service of Ukraine [ electronic resource ] / Daily access to the resource : http://www.ukrstat.gov.ua/ .
6. SSSU. Selected technical and economic indicators of gas supply enterprises for the years 2005-2010 / State Statistics Service of Ukraine [ electronic resource ] / Daily access to the resource : http://www.ukrstat.gov.ua/ .
7. SSSU. The volume of industrial products (works, services) for the years 2001-2011 / State Statistics Service of Ukraine [ electronic resource ] / Daily access to the resource : http://www.ukrstat.gov.ua/ ..
8. SSSU. Express Issue 03.02.2012 . Energy balance of Ukraine, 2010 / State Statistics Service of Ukraine [ electronic resource ] / Daily access to the resource : http://www.ukrstat.gov.ua/ .
9. SSSU. Express Issue 30.01.2012 № 23 .On payment of public utility services in December 2011 / State Statistics Service of Ukraine [ electronic resource ] / Daily access to the resource : http://www.ukrstat.gov.ua/ .
10. Order of the Ministry of Housing and Communal Services of Ukraine of 10.11.2009 number 352 g. » On Approval of the program energy efficiency and energy saving in housing in 2010-2014. » [ Electronic resource ] / Daily access to the resource: http://zakon2.rada.gov.ua/laws/main/o927 .
11. Connolly D .Heat roadmap Europe 2050. / D . Connolly , B . Vad , M . Poul , A . Ostergaard , B . Moller , S . Nielsen , H . Lund , D . Nilsson , S . Werner , D . Trier , Euroheat & Power [Electronic resource] // 2012. — Resource access mode:http : // www . euroheat . org / Publications -8. aspx .
12. E&P. Heating and cooling District statistics / Euroheat & Power [ electronic resource ] // 2012. — Daily access to the resource : http://www.euroheat.org/Statistics-69.aspx ..
13. IEA. Key world energy statistics 2012 / International energy agency [ electronic resource ] // 2012. — Daily access to the resource :http://www.iea.org/publications/ freepublications / publication / name, 31287, en.html .
14. IEA. Monthly Electricity Statistics July 2012, OECD / IEA / International energy agency [ Electronic resource ] // 2012, July . — Daily access to the resource : http://www.iea.org/publications/ .
Essential understanding of rent and quasi rent in economics
published in 2015 as part of a consultation during the round table © A. Nemtsov
Having studied publications regarding such a category as rent and its derivatives, including quasi rent, we can say that on the one hand it is a fairly easy to understand economic category, although some scholars use this concept in non-economic fields, for example, politics, and on the other parties there are debatable questions regarding its formation and the mechanisms of its use.
So, some scientists — E.R. — in this case — capital in its active form, that is, advanced — for the provision of such capital, that is, if translated into a modern language, and not into a modern one either, the quasi-rent does not correspond to the book profit, but corresponds to dividends that are half chaet owner in the allocation of net income.
Thus, we can conclude that a quasi-rent is a rent for a resource, in most cases the possession and use of which extends over time and does not apply to the cost of manufactured products for one operating cycle (excluding some types of products whose production cycle may last more than a year, for example, some types of turbines, water and air ships). In terms of accounting and tax accounting, as well as finance, these resources correspond to the assets of the enterprise — fixed assets and intangible assets. Among fixed assets, buildings and structures, machines and mechanisms are distinguished, intangible assets correspond to intellectual property and know-how.
Quasi-rent differs from rent in a shorter period of use of the resource that is in use of the owner (copyright holder). There is a desire for recipients of quasi-payments to extend their payment period, for which some authors propose the use of “protective investment” mechanisms, although, in our opinion, with innovative models of economic development, if you do not invent a new product, then your competitor will make it quasi-transparent payments in general may stop prematurely. By the way, in the above case, it’s not so simple: there are a number of products, goods, services that, as they were in demand in relatively old forms, remain in demand in them, for example, food, clothing, shoes,
On the whole, the over-dynamics of economic development leads to a decrease in the term for receiving quasi-payments, and how well this remains an open, multifaceted issue.
Excerpt from the report on consulting services for market analysis and portfolio development
completed in 2013, © Nemtsov OV
1.5 Assessment of the situation in the banking services market
In 2012, the country maintained its negative tendencies, which were laid down by the crisis of 2008 — 2009, which against the background of recessionary tendencies during the reporting year could have negative consequences for the next year. The main potential risks may be the following:
- liquidity risk and worsening devaluation trends in the foreign exchange market, against the background of the country’s currency reserves decline
- the risks of maintaining low credit activity and, as a consequence, the shortage of working capital of enterprises;
- the risk of increased inflationary pressures;
- reduction of the country’s investment attractiveness, reduction or curtailment of investment projects by foreign companies and banks;
- important issues for the country in negotiations on obtaining a new IMF loan and raising tariffs on Russian gas have not been resolved;
- deterioration of the external economic environment: falling prices in the world commodity markets, keeping the debt crisis in the Eurozone;
- lack of external financing and narrowing of access to international capital markets.
In Q1 and Q2 2012, GDP continued to grow in comparison with growth in 2011, but at a slower pace (2% and 3%, respectively, compared to 5.4% and 3.9% in Q1 and Q2 2011) . But in the second half of 2012, the country’s economy felt the first signs of economic downturn. Thus, in June, the industry faced a decline in production. Taking into account the negative dynamics of construction, agriculture and transport in the third quarter of 2012, GDP declined by — 1.3%. Unfavorable foreign economic situation and a downturn in the country’s economy had a negative impact on GDP dynamics in the fourth quarter of 2012, which decreased by 2.7%. This reduced GDP growth by 2012 to 0.2%.
Almost all sectors of the economy registered a negative result in 2012 compared to the previous period (the following sectors had the greatest impact on the reduction of production: construction — 13.8%, transport — 4.9%, agriculture — 4.5%) .
At the beginning of the year, consumer prices were growing at a slower pace (inflation was + 0.7% in Q1 2012). But since the second quarter of this year, there was a decline in consumer prices, which continued until the end of the year, which led to a 0.2% deflation in the results of the year. The spread of negative trends in world markets and the fall of the country’s economic growth led to an increase in demand for foreign currency in the domestic market, especially in the second half of 2012. This caused devaluation pressure on the national currency and, as a result, in the fall of 2012, the dollar exchange rate to the hryvnia on the cash market increased by 3%. In order to counteract the devaluation pressure, the NBU was forced to actively intervene with the foreign exchange market. The official hryvnia exchange rate against the dollar in the year has hardly changed, and the hryvnia to dollar exchange rate fell by 2%, almost to the beginning of the reporting year. At the same time, NBU interventions to protect the national currency led to a narrowing of the hryvnia liquidity in the market, which led to an increase in the value of hryvnia resources in the interbank market in the second half of 2012. But already at the end of the reporting year, there were signs of improvement in liquidity in the banking system.
Political and economic changes are taking place in Ukraine that have influenced, and can continue to affect, the activities of institutions operating under these conditions. As a result, conducting operations in Ukraine involves risks that are not specific to other markets. In addition, the recent decline in capital and credit market operations has increased the level of uncertainty in the country’s economic sector.
The Ukrainian taxation system is characterized by numerous taxes and frequently changing legislation. Tax legislation is often vague, may have different interpretations, and in some cases may be controversial. Often there are conflicts in the interpretation of tax legislation between local, regional and state tax administrations and between the NBU and the Ministry of Finance. Tax returns can be reviewed by various authorities, which are legally empowered to impose significant penalties and levy penalties. These facts create far more serious tax risks in Ukraine than those typical of countries with more advanced tax systems.
Using data from the site of the National Bank of Ukraine, namely: deposits attracted by deposit-taking corporations (except the National Bank of Ukraine), loans extended to deposit-taking corporations (except the National Bank of Ukraine), and securities in deposit-taking corporations (except the National Bank of Ukraine) capacity of the banking services market, being restricted to its three segments by product criterion — deposits (Table 1.5.1), loans (Table 1.5.2) and securities (Table 1.5.3).
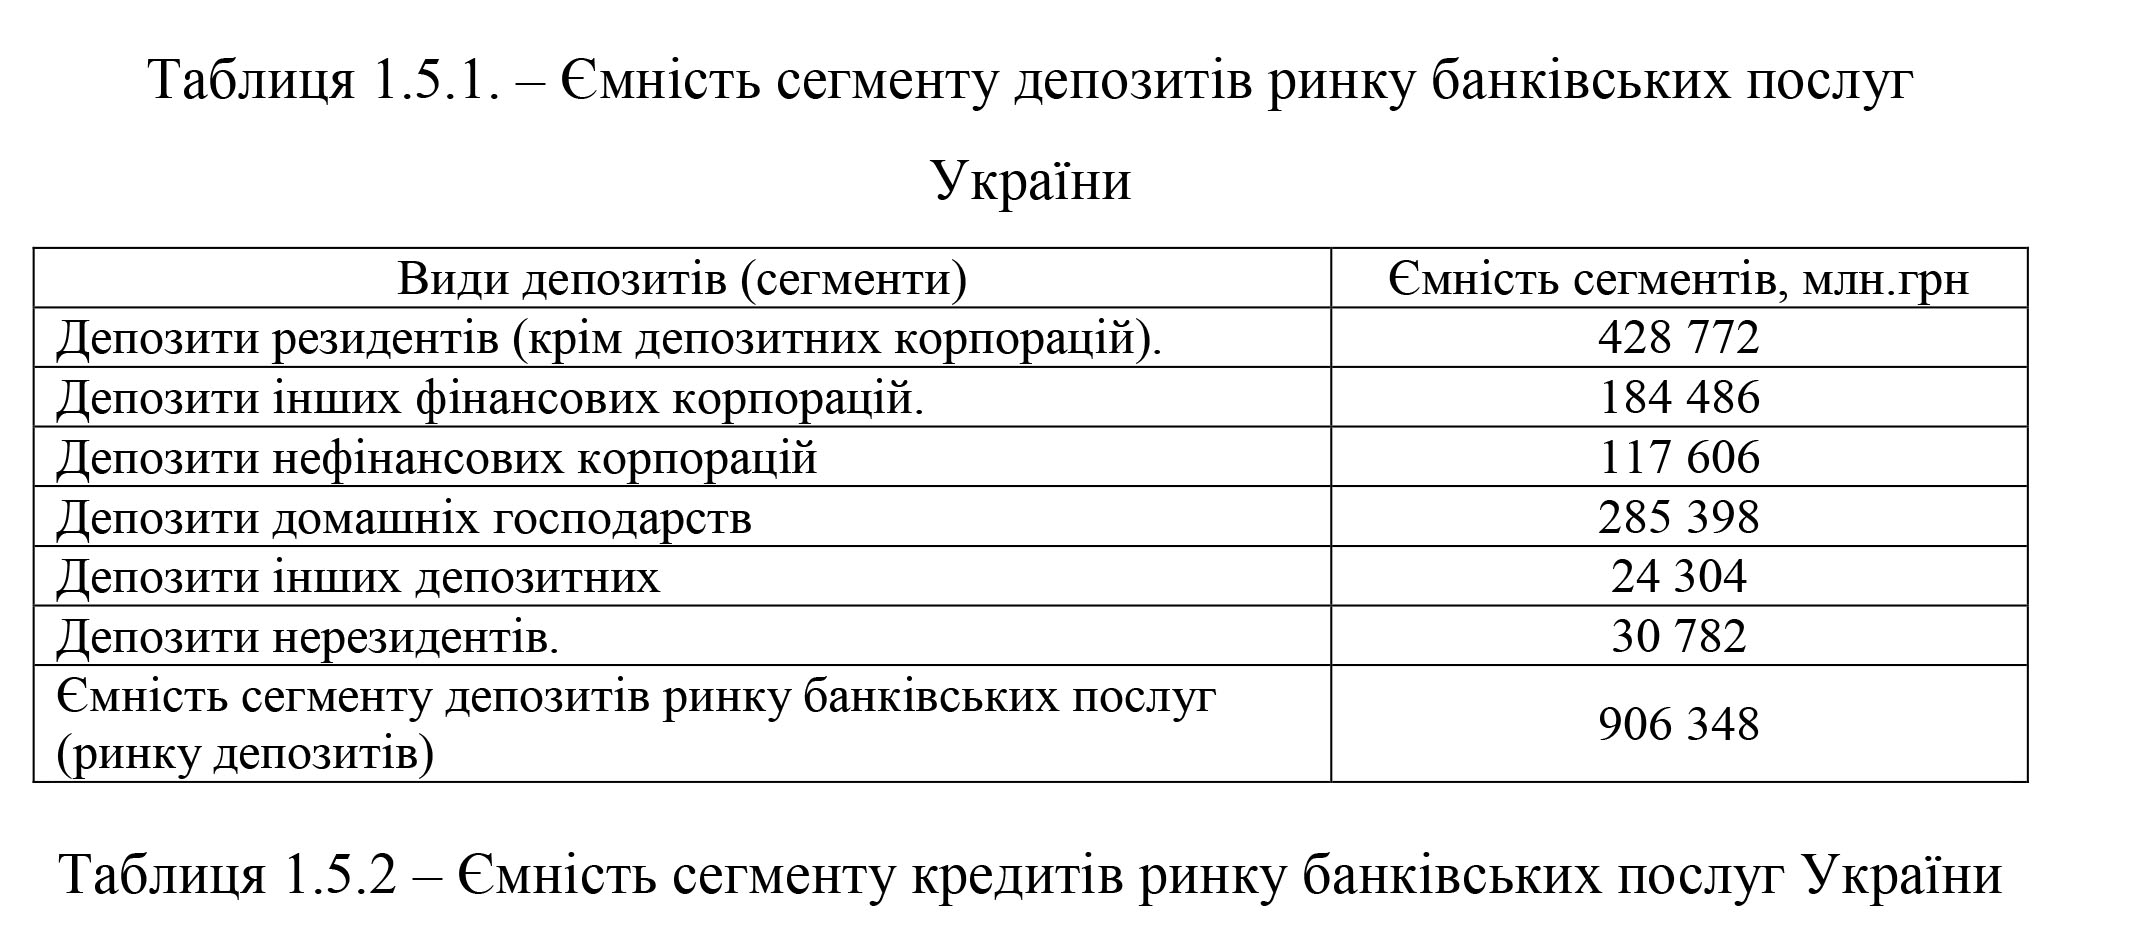
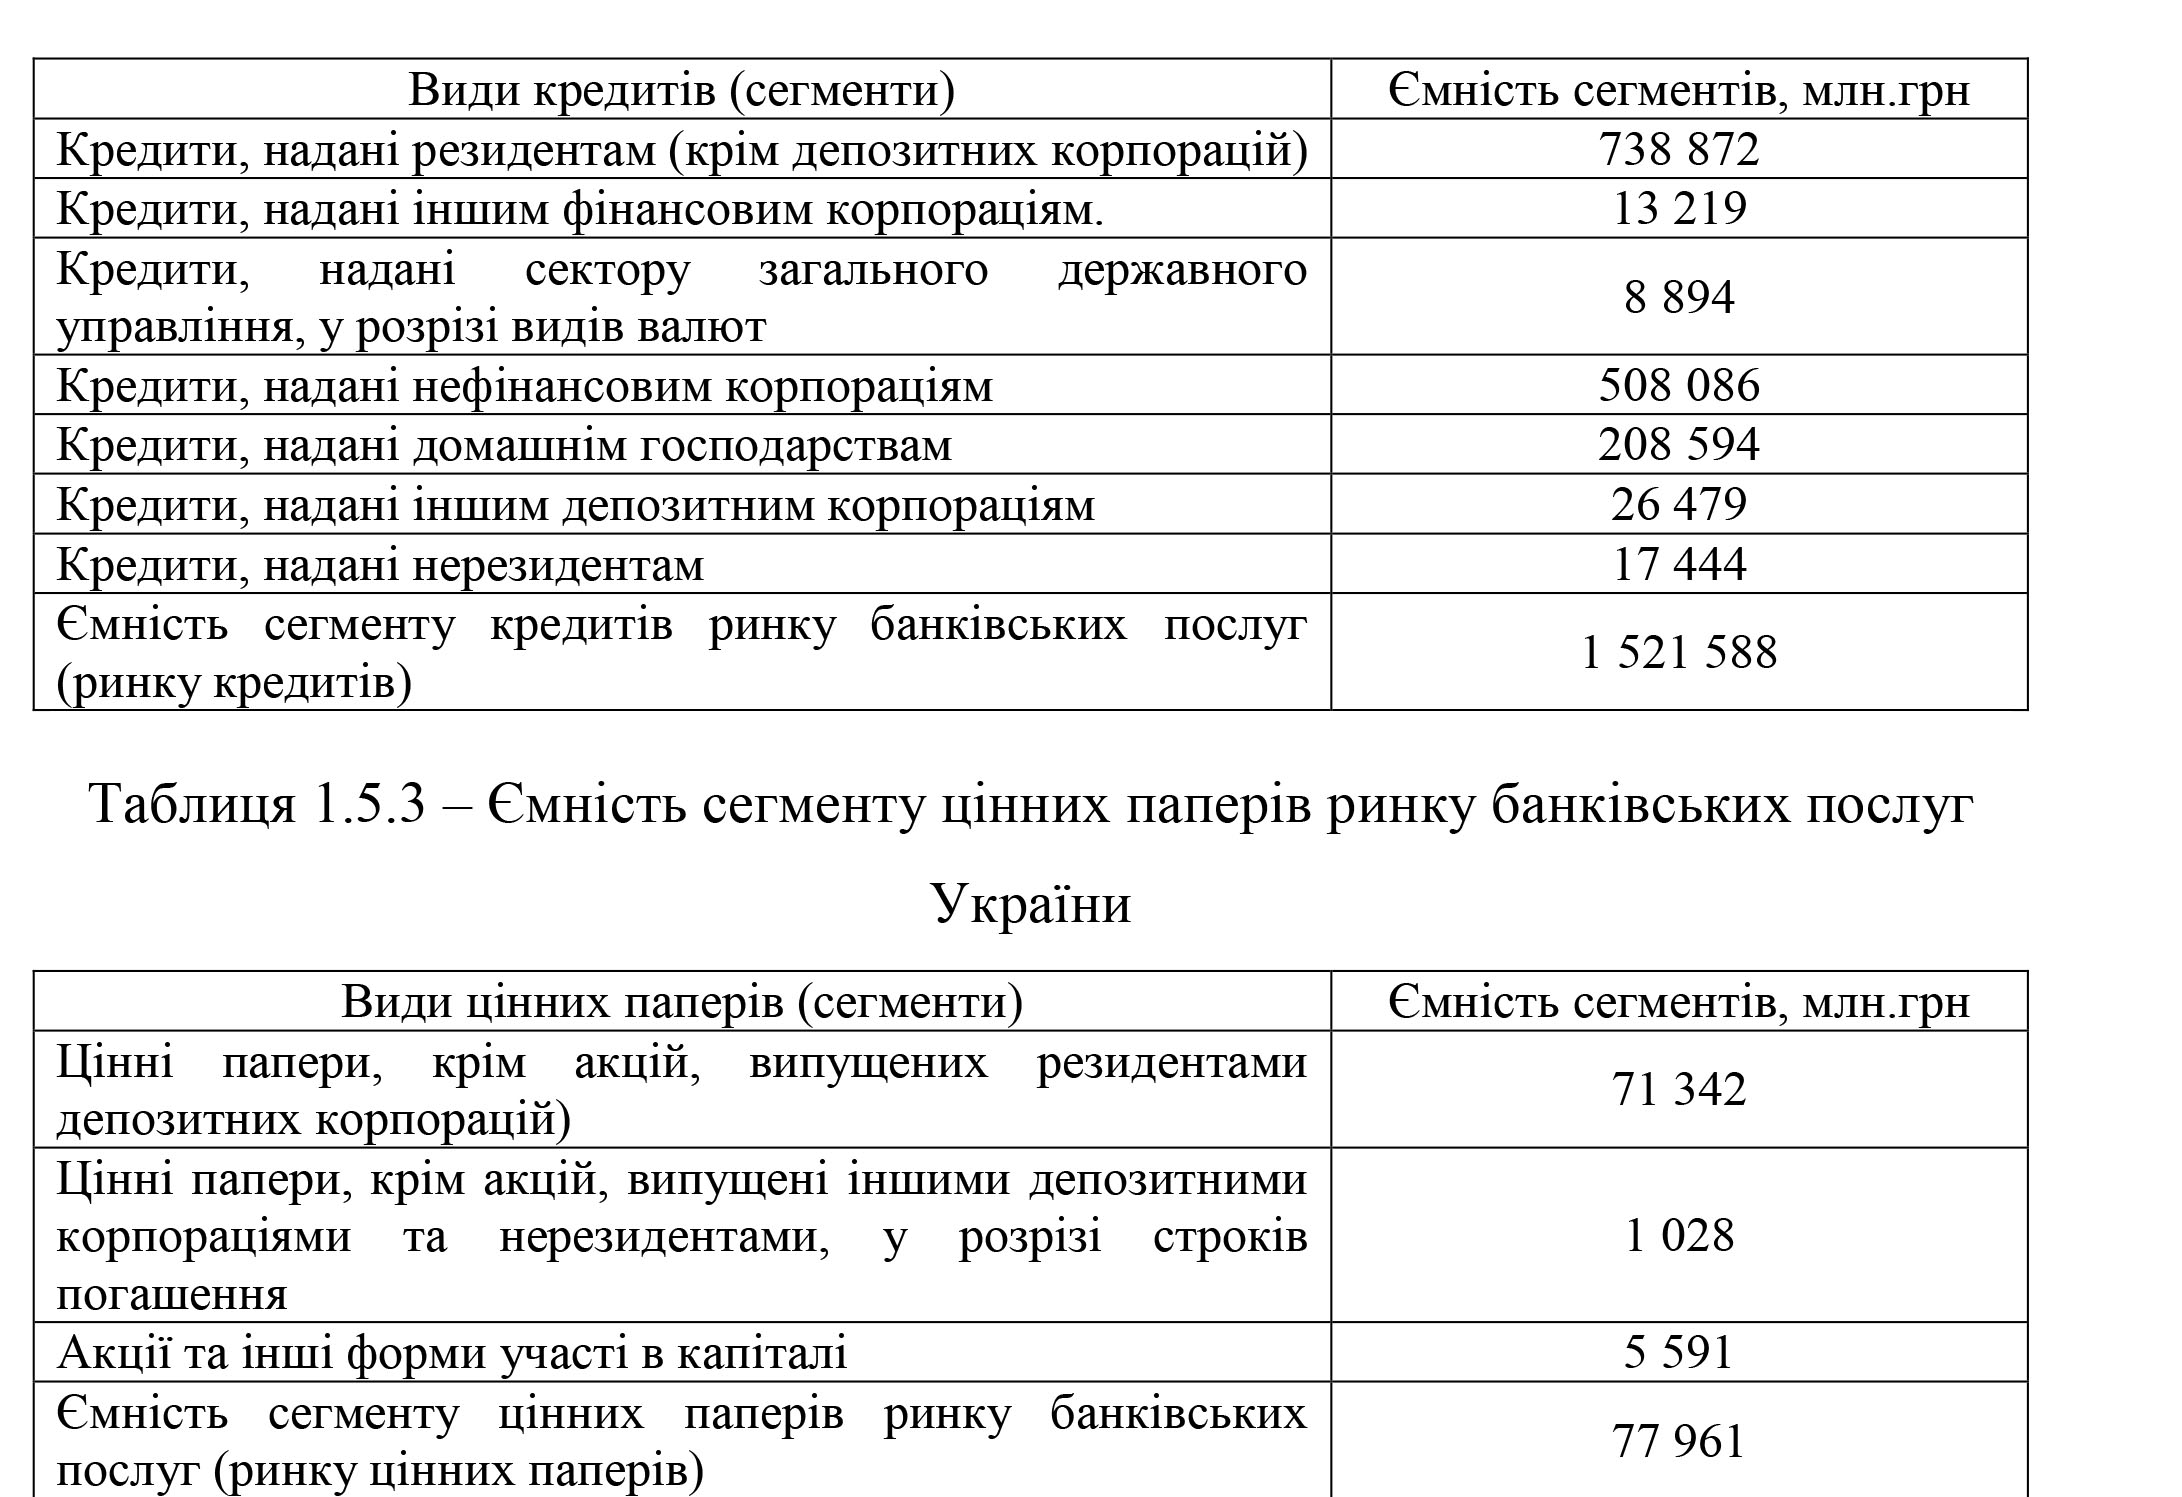
Based on the tables 1.5.2 — 1.5.3, the capacity of the Ukrainian banking services market is calculated by the following formula:
Yer = E.d. + Yes + E.c./b., where (1.5.1)
Yer — capacity of the banking services market; Esd — capacity of segment of deposits of the market of banking services (market of deposits); Es. — capacity of the segment of credits of the market of banking services (the market of credits; Es / b — capacity of the segment of securities of the market of banking services (market of securities).
Thus, the capacity of the Ukrainian banking market equals UAH 2 505 897 million. (906 348 + 1 521 588 + 77 961)
The main macroeconomic trends that had a significant impact on the Bank’s activities in 2012 were as follows:
— devaluation expectations of the population and NBU policy aimed at preserving the national currency, which led to an increase in the cost of resources and, as a result, had a negative impact on interest rates. margin and interest income of the bank;
— reduction of hryvnia liquidity in the interbank market, including its instability has led to more conservative liquidity management, in particular the focus on increasing the deposits of individuals and legal entities, maintaining a greater stock of free liquidity, etc .;
— slowdown of economic growth of the country, the decline of major industries, along with high cost of resources, led to a slowdown in lending to enterprises;
— Existing credit risks on issued loans, especially before the crisis of 2008, necessitated the continuation of active work towards improving the quality of assets, through debt restructuring, revitalization of activities aimed at repayment of overdue debt.
1.6 Evaluation of banking products
Based on the specifics of the activity, products presented in the banking services market can be divided into the following groups:
- Passive fundraising operations;
- issue of shares;
- issue of promissory notes;
- corporate deposits;
- deposits of individuals;
- attraction of interbank loans;
- attracting syndicated loans from Western banks; 2. Passive-active operations to attract and maintain funds;
- raising funds for current deposits and their maintenance;
- credit card issuance and servicing; 3. Active operations to invest the attracted funds;
- cash transactions;
- servicing of foreign exchange operations of clients;
- service of traveler’s checks;
- dealing in the international currency market;
- lending to legal entities;
- development of consumer credit systems;
- interbank loan;
- participation in leasing programs;
- factoring operations;
- overdraft and credit line servicing;
- participation in credit lines of Western funds and projects;
- T-bills operations;
- transactions with securities in the stock market;
- maintenance of bill circulation; 4. Other measures aimed at increasing profits, strengthening the image and gaining consumer benefits;
- servicing of bank safes;
- consulting services;
- development of Internet technologies;
- cooperation with financial educational institutions.
Due to the fact that most banks provide the same amount of services today, quality parameters, assistance in solving financial problems, and cost of services will play an important role in attracting customers.
The situation in the deposit market during the year was characterized by the confidence of depositors in the system as a whole. This is evidenced by a steady increase in deposits with banks, while lending rates remain low and resource costs have increased significantly.
The total growth of the deposit base in 2012 was + 16% (+ UAH 77.19 billion). Such positive dynamics were achieved by increasing household deposits, especially in the second half of 2012, when interest rates increased significantly. The increase in deposits from households in 2012 amounted to 19.1% (UAH 58.7 billion), while deposits from legal entities increased by 10.2% for the year (UAH 18.5 billion). In addition, in the first half of 2012, the deposit portfolio grew at the expense of deposits in national currency (increase in national currency + 1.6%, in foreign currency + 0.5%), but due to the devaluation expectations of the population, in the second half of 2012 was due to deposits in foreign currency (+ 8.4% in foreign currency, in national currency + 6.9%).
Raising funds for current deposits and maintaining them is the main and cheapest way to raise funds. The average share of the bank’s liabilities is about 27%. The capacity of this segment in Kharkiv region is 137 million UAH. or 33802 enterprises that can be divided into the following groups according to the data of Kharkiv Regional Statistics Office (Table 1.6.1).
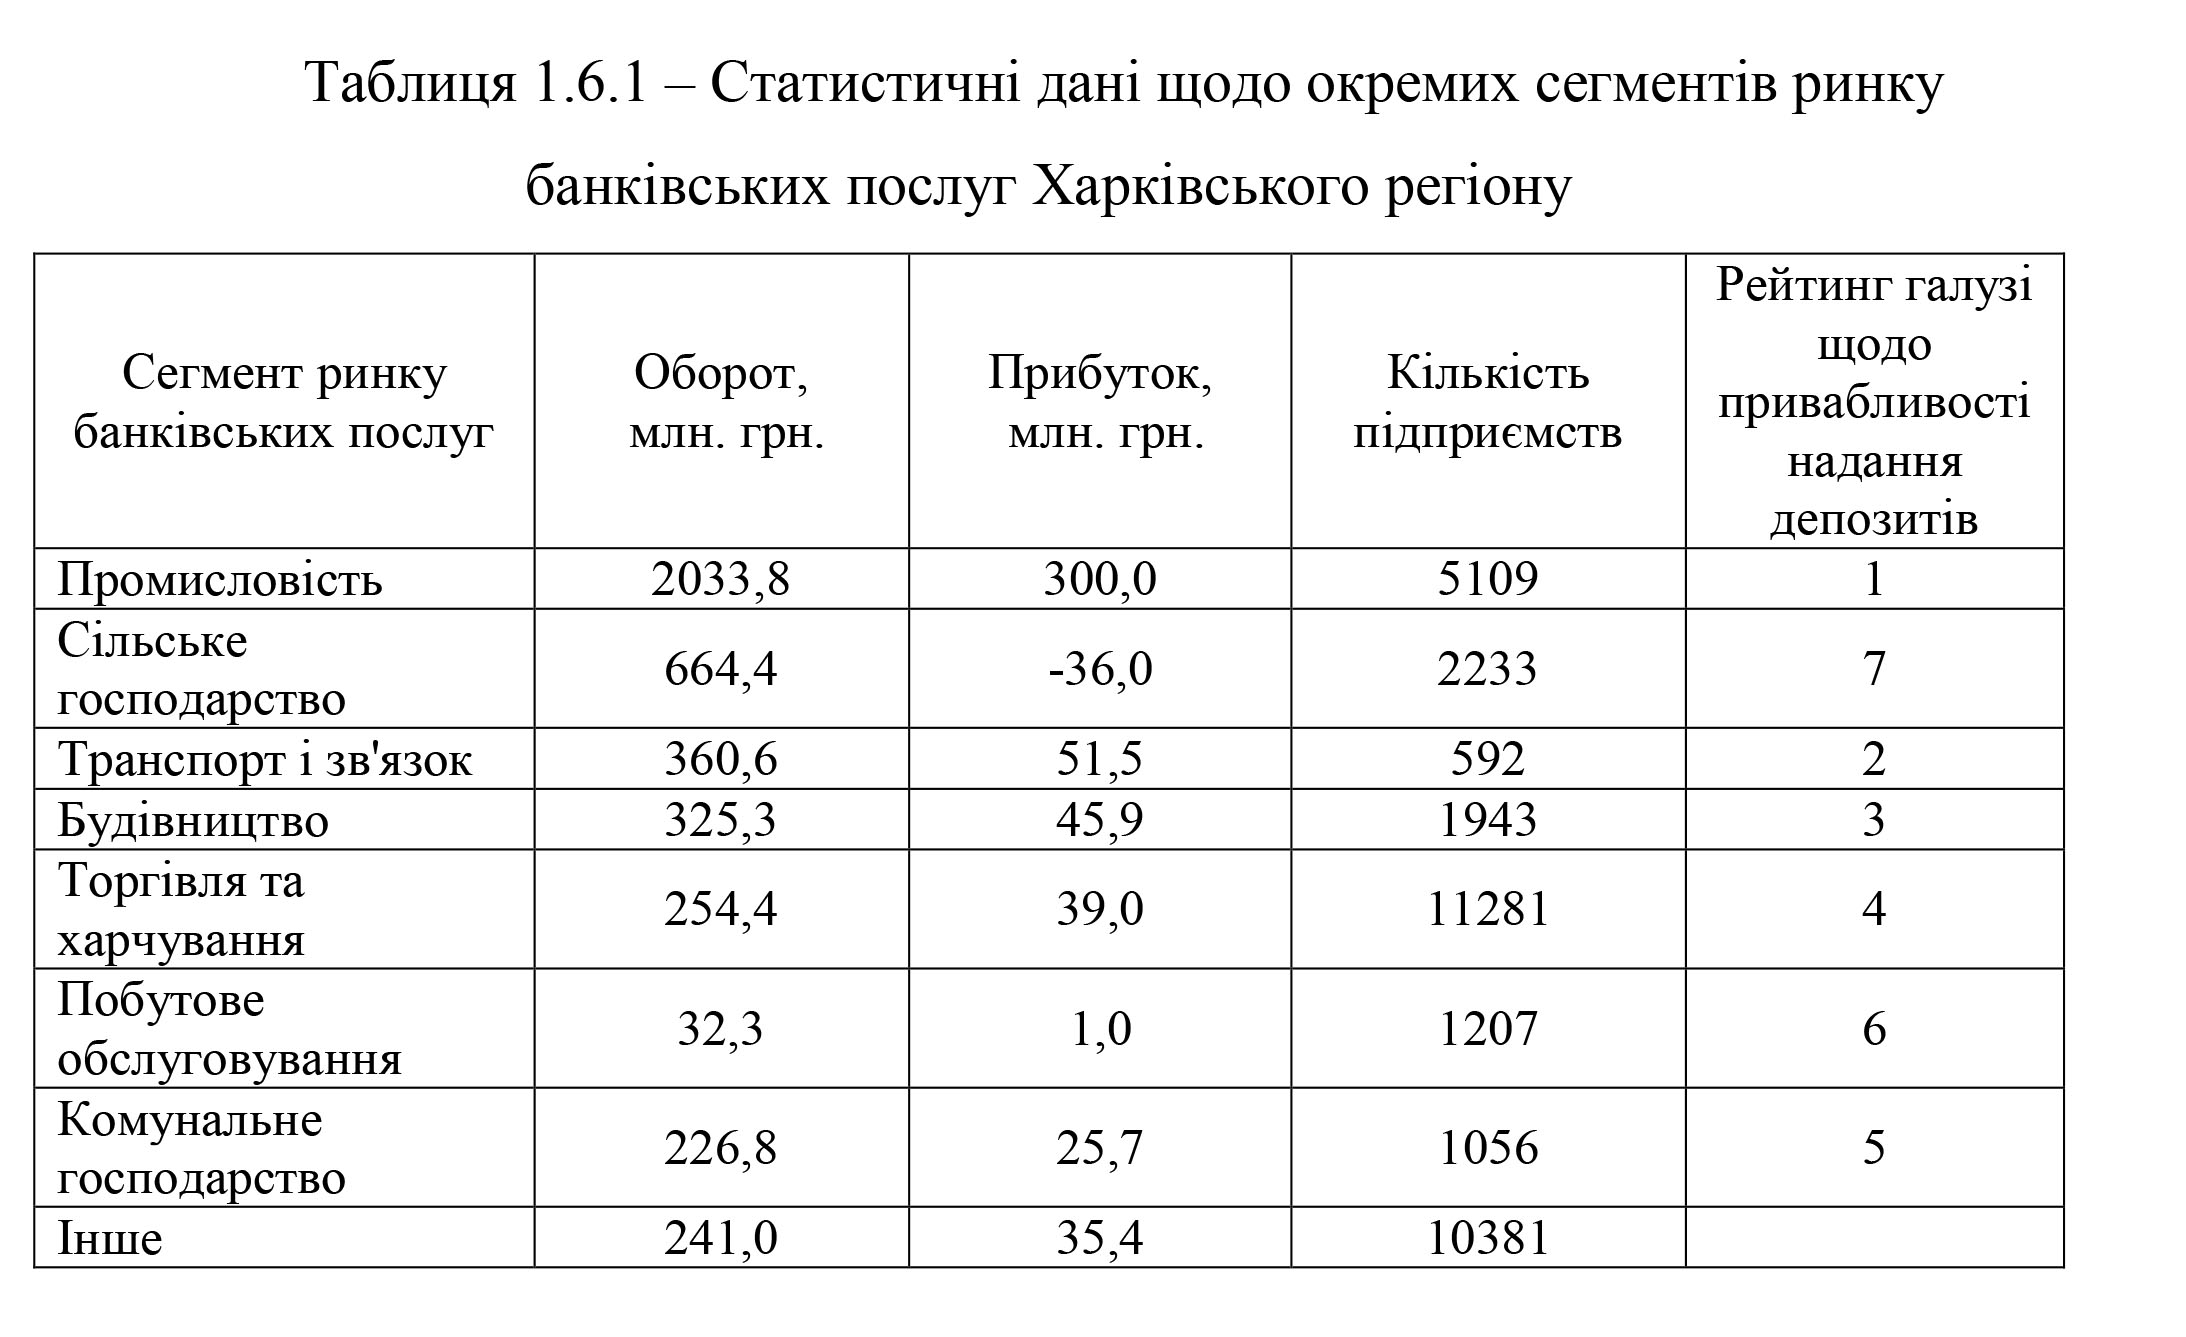
Despite the high rating of the industry, in this segment the most pronounced crisis phenomena (non-payments, barterization). In order to successfully use this group, it is advisable to organize consulting services on «growing clients» (for example, financial institutions of CB «Kyiv» and «Privatbank»).
In 2012, there was an increase in the value of resources due to the increase in the price of hryvnia resources in the second half of 2012, which was associated with a decrease in hryvnia liquidity in the market during this period. According to the Ukrainian Index of Rates on Deposits of Individuals, the average interest rate in national currency in 2012 increased by 3.5% to 19.2%, and in foreign currency by 0.5% to 6.4%.
Despite the National Bank’s reduction in the interest rate in March 2012 by 0.25% to 7.5% per annum, the lending activity of banks remained low during 2012, including due to the high cost of resources.
Thus, the total credit portfolio of banks increased by 2.2% or UAH 17.4 billion in 2012. (against + 9.6% or UAH 69.2 billion in 2011).
According to the results of 2012, loans to legal entities increased by 5.1% (UAH 30.3 billion), of which the growth was in national currency and in foreign currency + 2.7%. National currency lending to individuals increased in 2012 (+ 19.3% or UAH 16.1 billion increase over the year), but was offset by a decrease in foreign currency portfolio — 25.8% (UAH -29 billion). .). The decrease in foreign currency loans was due to the ban on issuing new loans and active work in the reporting year with overdue foreign currency debt of the population (restructuring, write-offs, work of collection companies). This led to a decrease in the total retail loan portfolio for 2012 by 6.6% (UAH -12.9 billion).
Due to high interest rates, experts predict an increase in the share of foreign currency loans (in which the rates are much lower and quite acceptable for Ukrainian consumers). The same survey showed that customers expect banks’ credit policies to be easy to obtain. It is possible to combine the client’s expectations and the desire of the banks to avoid the risk by introducing consulting services.
According to a survey conducted by ICPS, the following situation has emerged in the credit market today:
- used the loan — 20.2% of enterprises;
- 61.0% of enterprises would like to use it;
- high interest rates deter — 28.5% of enterprises.
The market of plastic cards of Ukraine in 2012 amounted in kind to 20 million pieces. In 2013, it is expected to increase to 22 million units.
3.2 Determining the market strategy of the Bank’s products …
In order to determine the competitive status and develop the market strategy for the Bank’s products, we will present data on the services it provides (deposits, loans and securities) on the matrix of the Boston Advisory Group (BCG). To do this, we calculate the relative market shares of the Bank… and the growth rate (growth in national terminology) of the above services. We will select the closest rated banks as VTB and Ukrsotsbank as the main competitors.
The calculations are presented in Tables 3.2.1, 3.2.2, 3.2.3
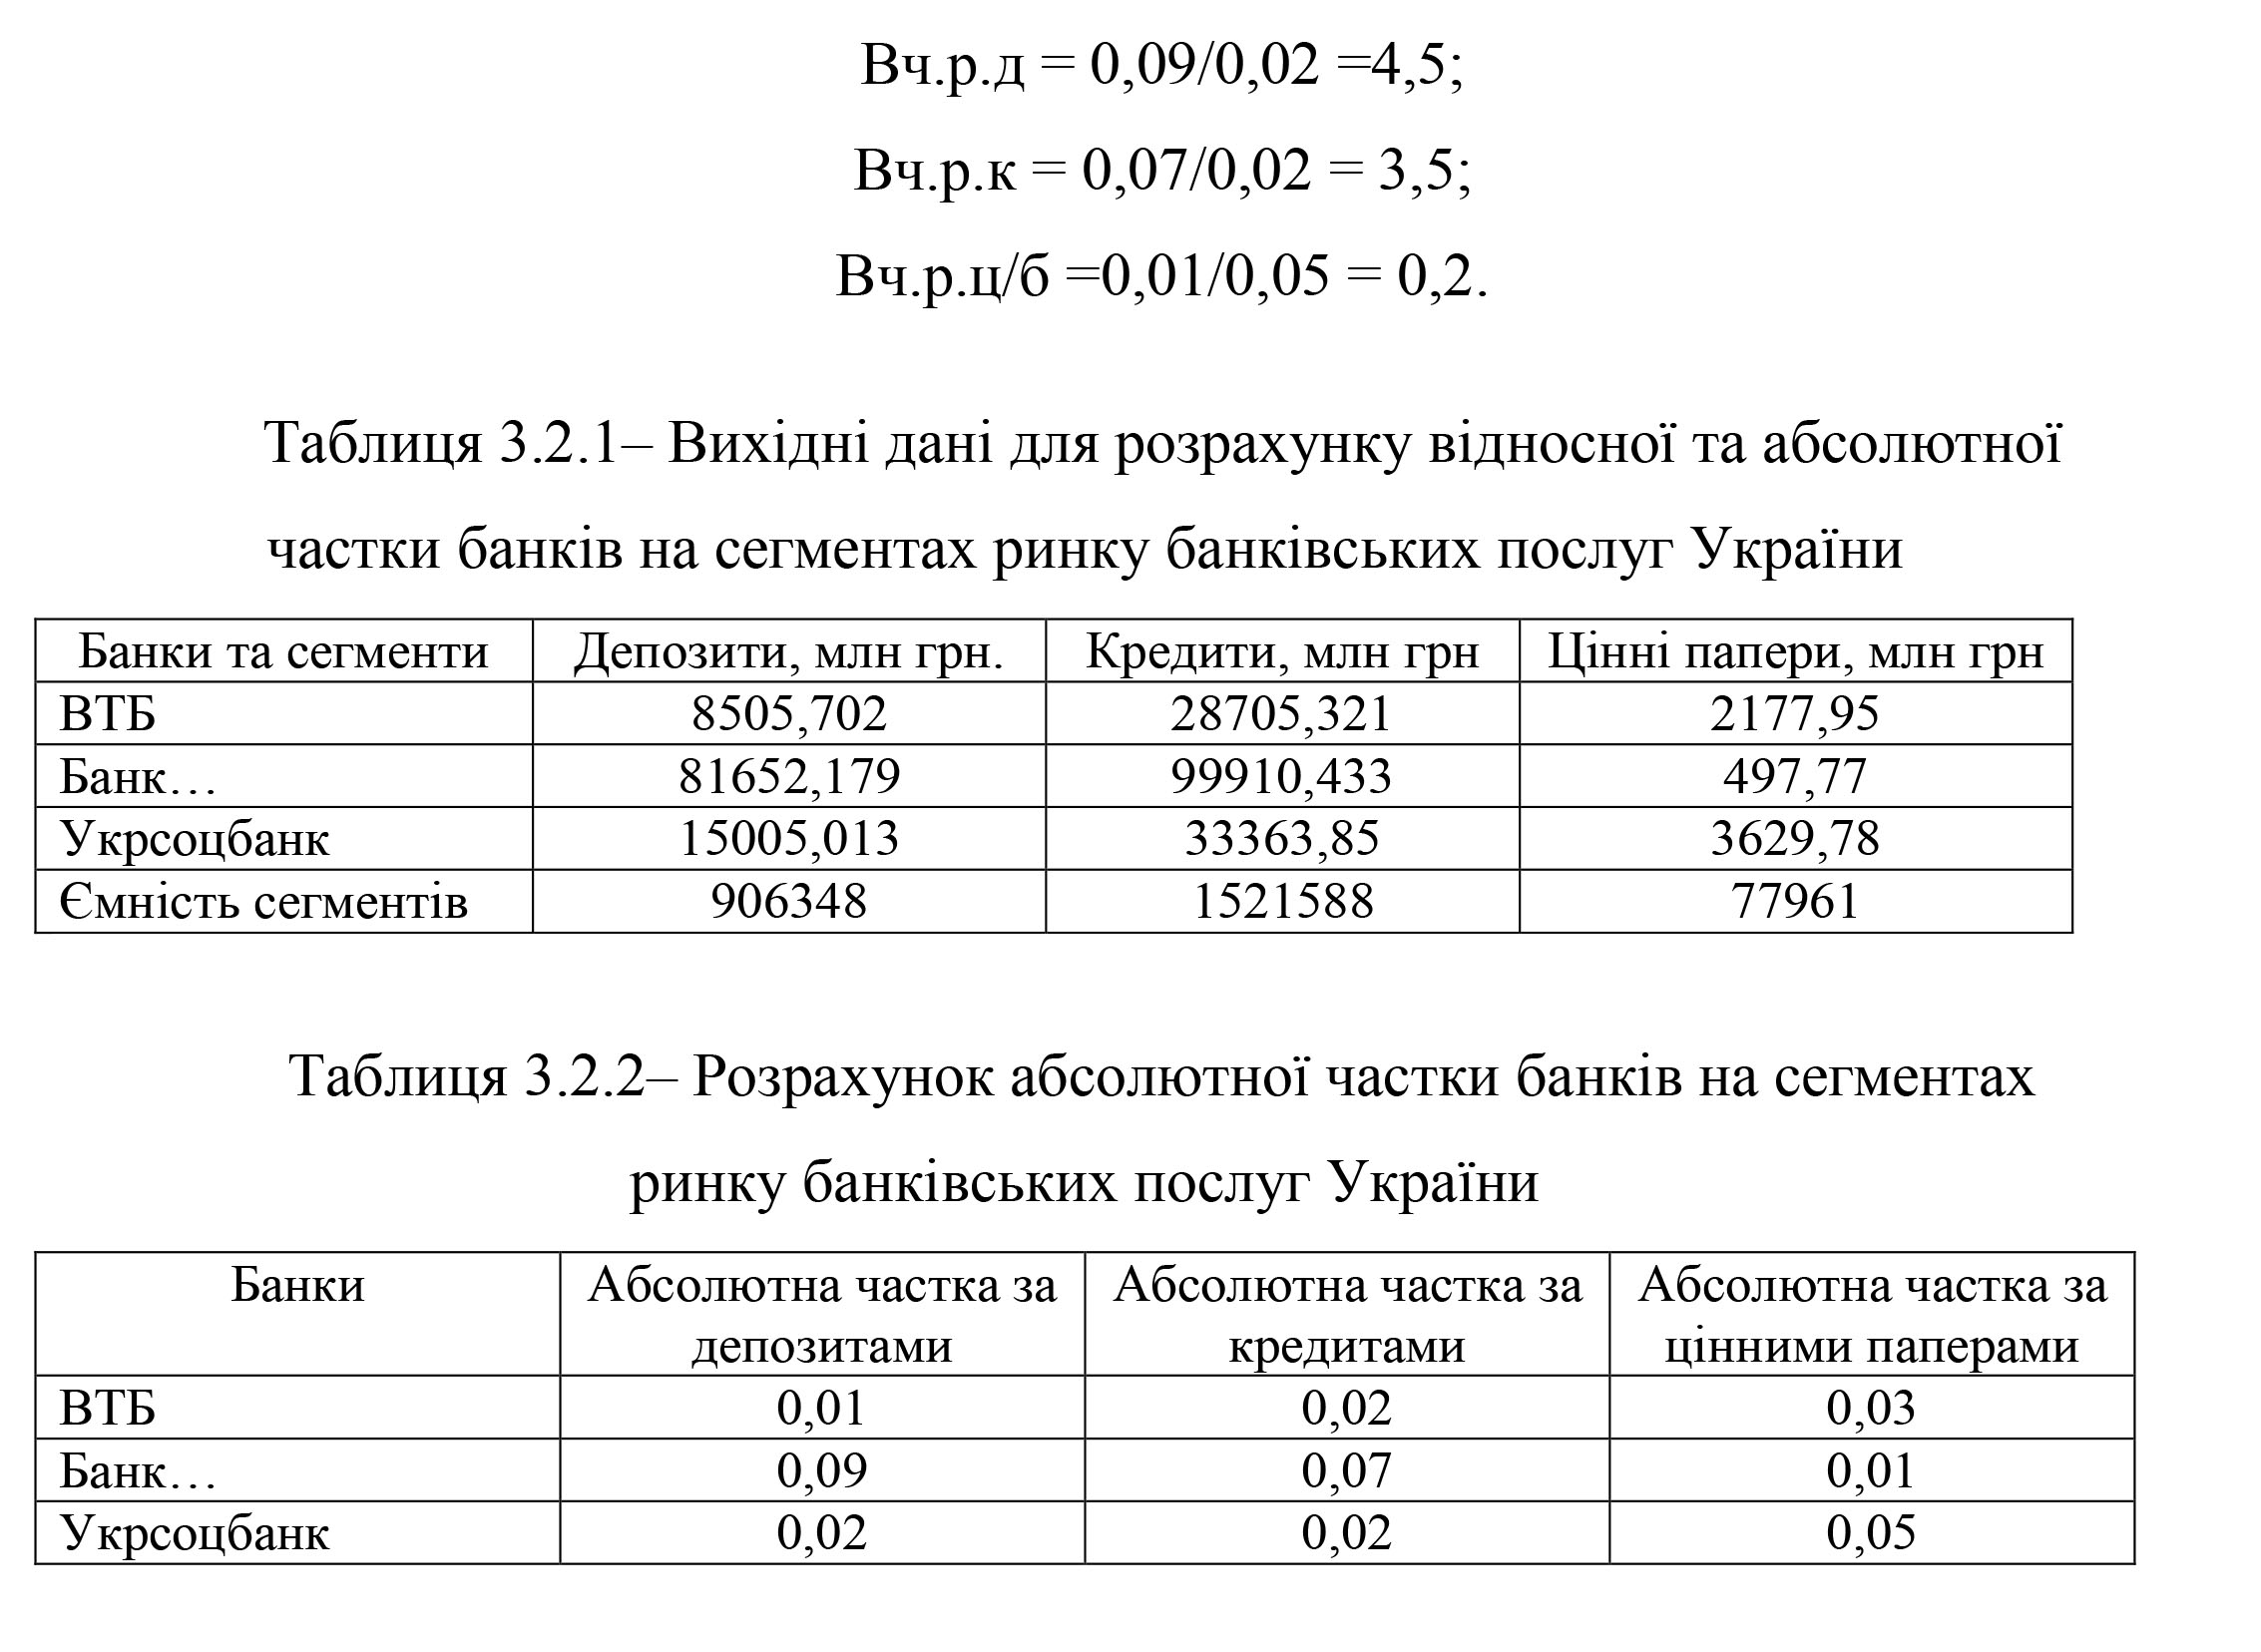
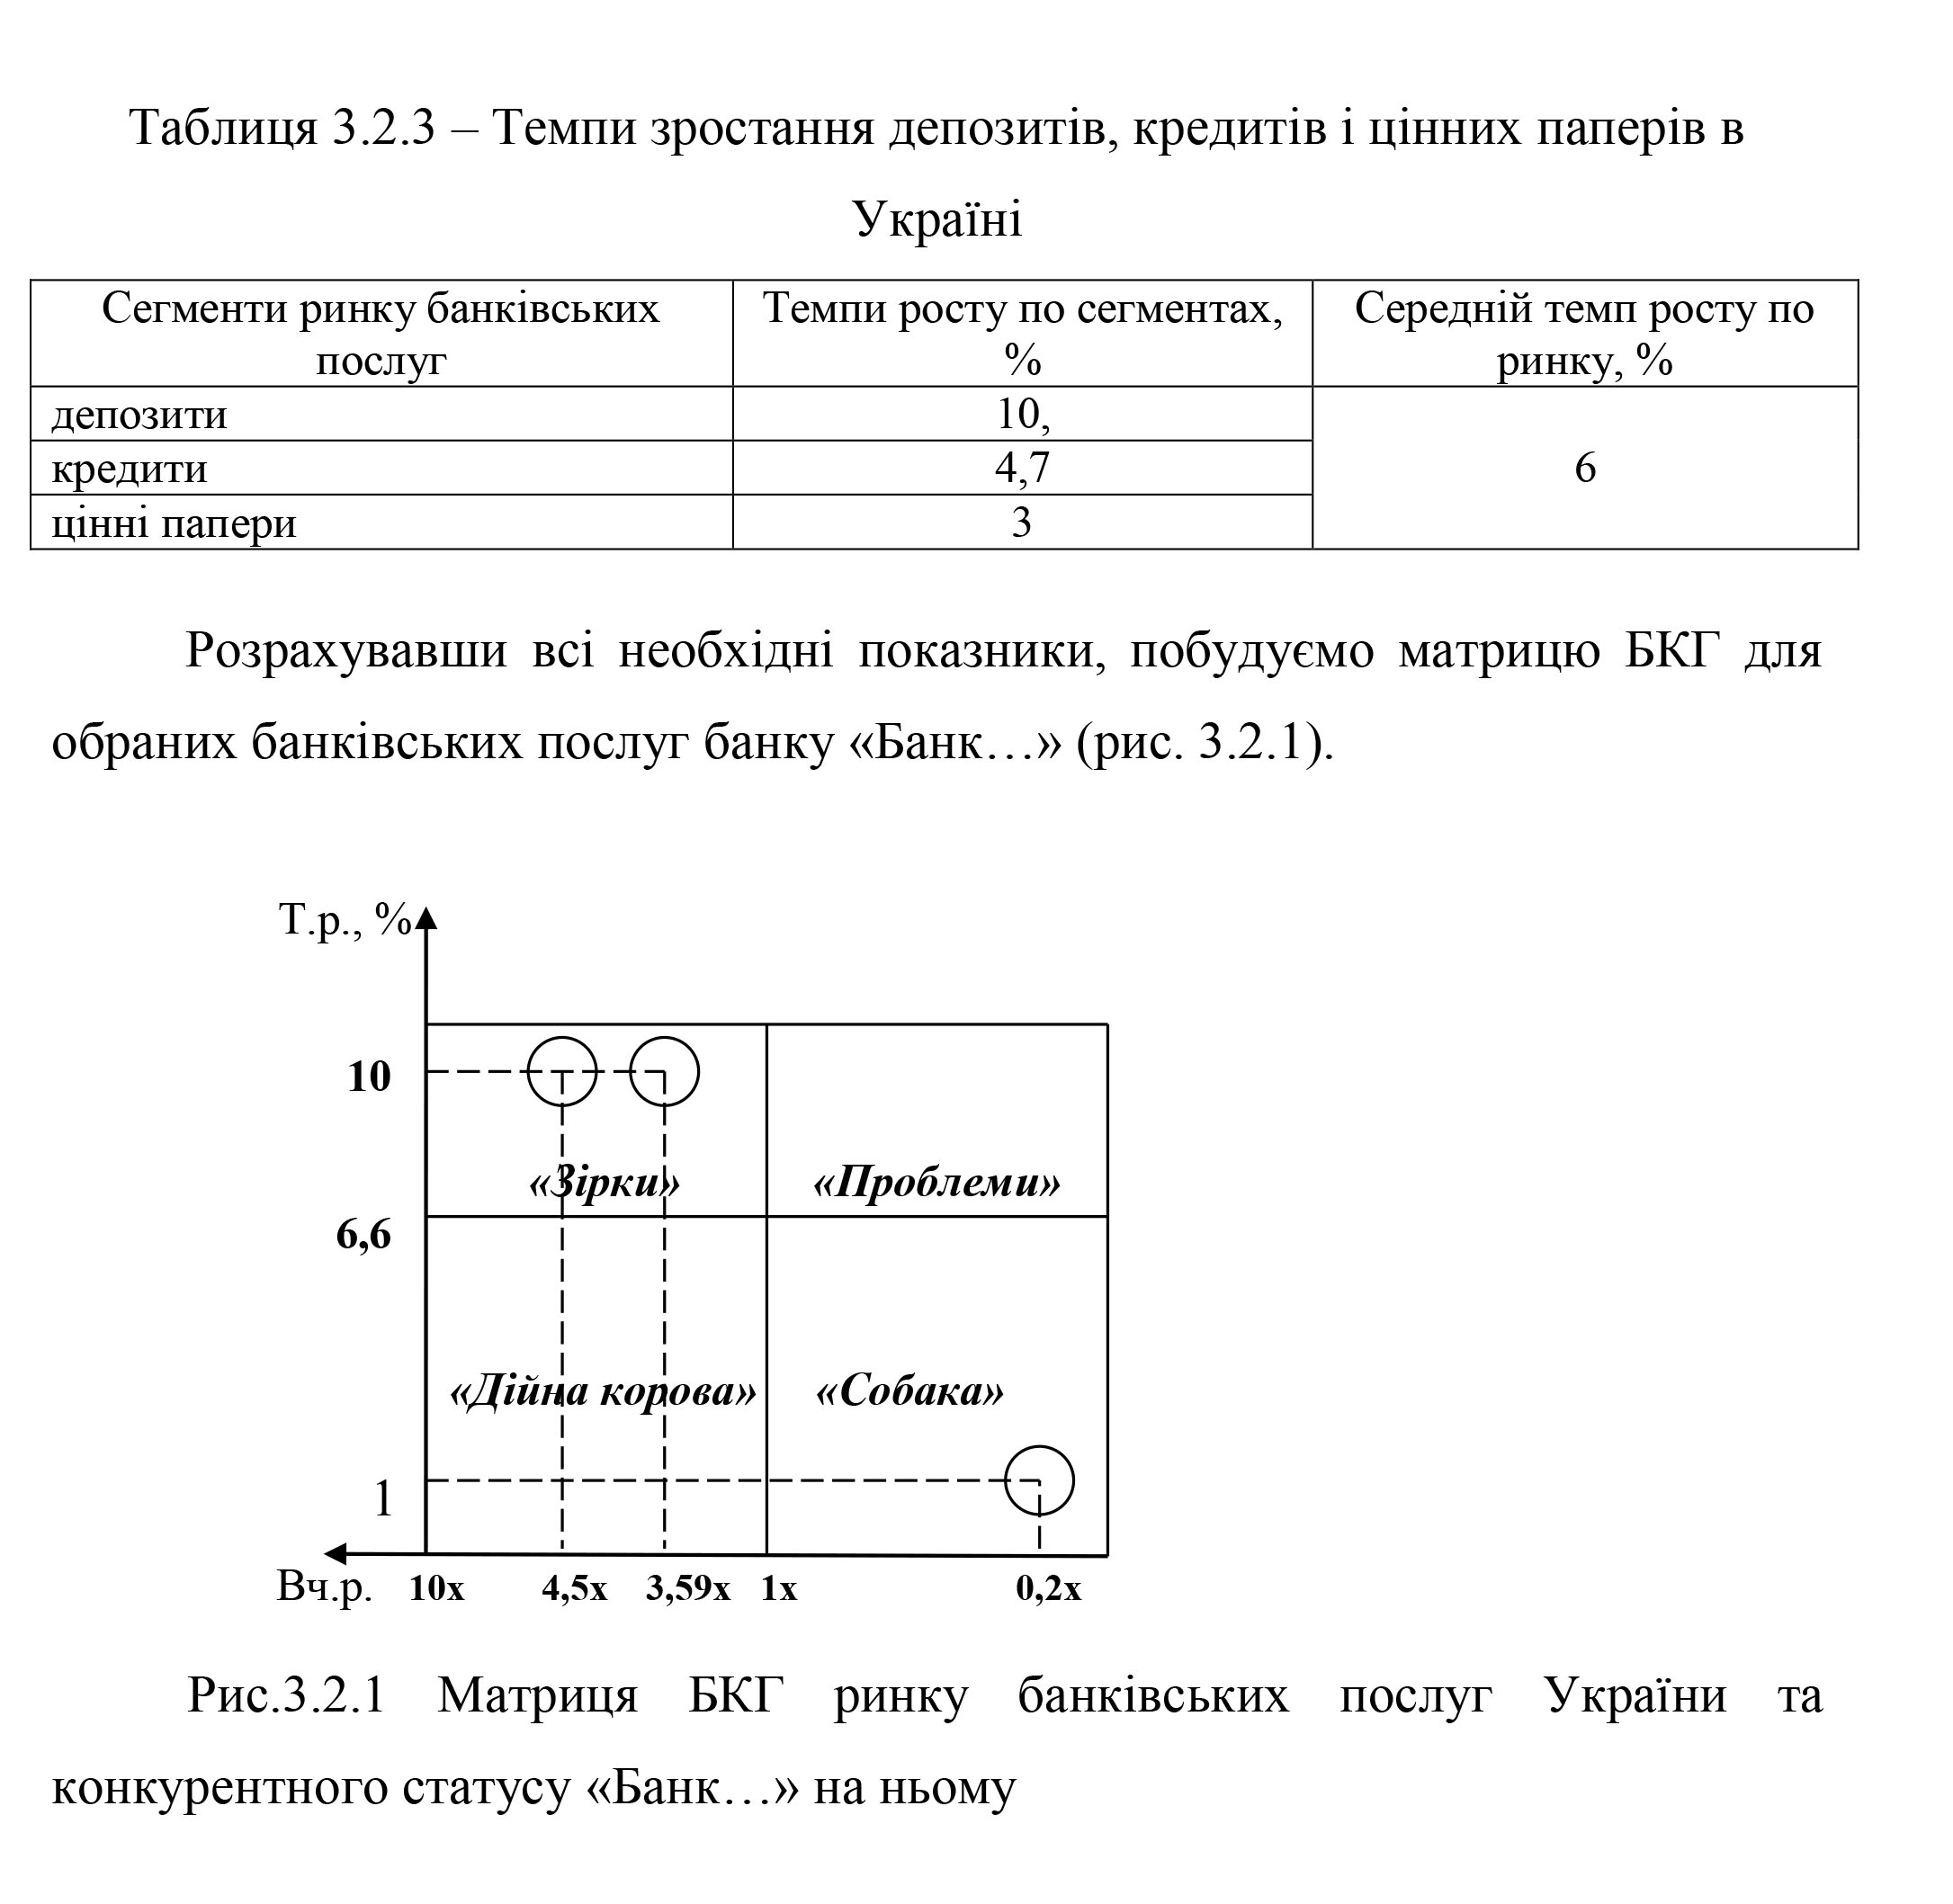
The relative share of deposits, loans and securities of “Bank…” is defined as the ratio to the absolute share of the closest competitor — “Ukrsotsbank”:
Vch.d = 0,09 / 0,02 = 4,5;
Rf = 0.07 / 0.02 = 3.5;
Rf / b = 0.01 / 0.05 = 0.2.
Based on the matrix data we can draw the following conclusions:
- The product group «Stars» includes credit services and deposits of Bank «Bank …». These two services are characterized by rapid growth and high share. They make significant profits due to their competitiveness, but also need funding to maintain a high share of a dynamic market.
- The product group «Dog» includes securities, which are characterized by slow growth and small market share. These are products that are at a disadvantage in terms of costs and do not have growth opportunities. The preservation of such goods entails considerable financial costs with little chance of improvement. Priority strategy is termination of investment and cost-effective existence.
3.3 Determination of the investment strategy of the Bank’s products …
For a more detailed analysis of the competitiveness of the Ukrainian banking services market and the choice of the Bank’s investment strategy, we will construct the McKinsey matrix (General Electric). The data required in Table 3.3.1 are necessary for the calculation.
The experts who evaluated the state of the identified factors and determined their specific gravity were:
- xxx
- xxx
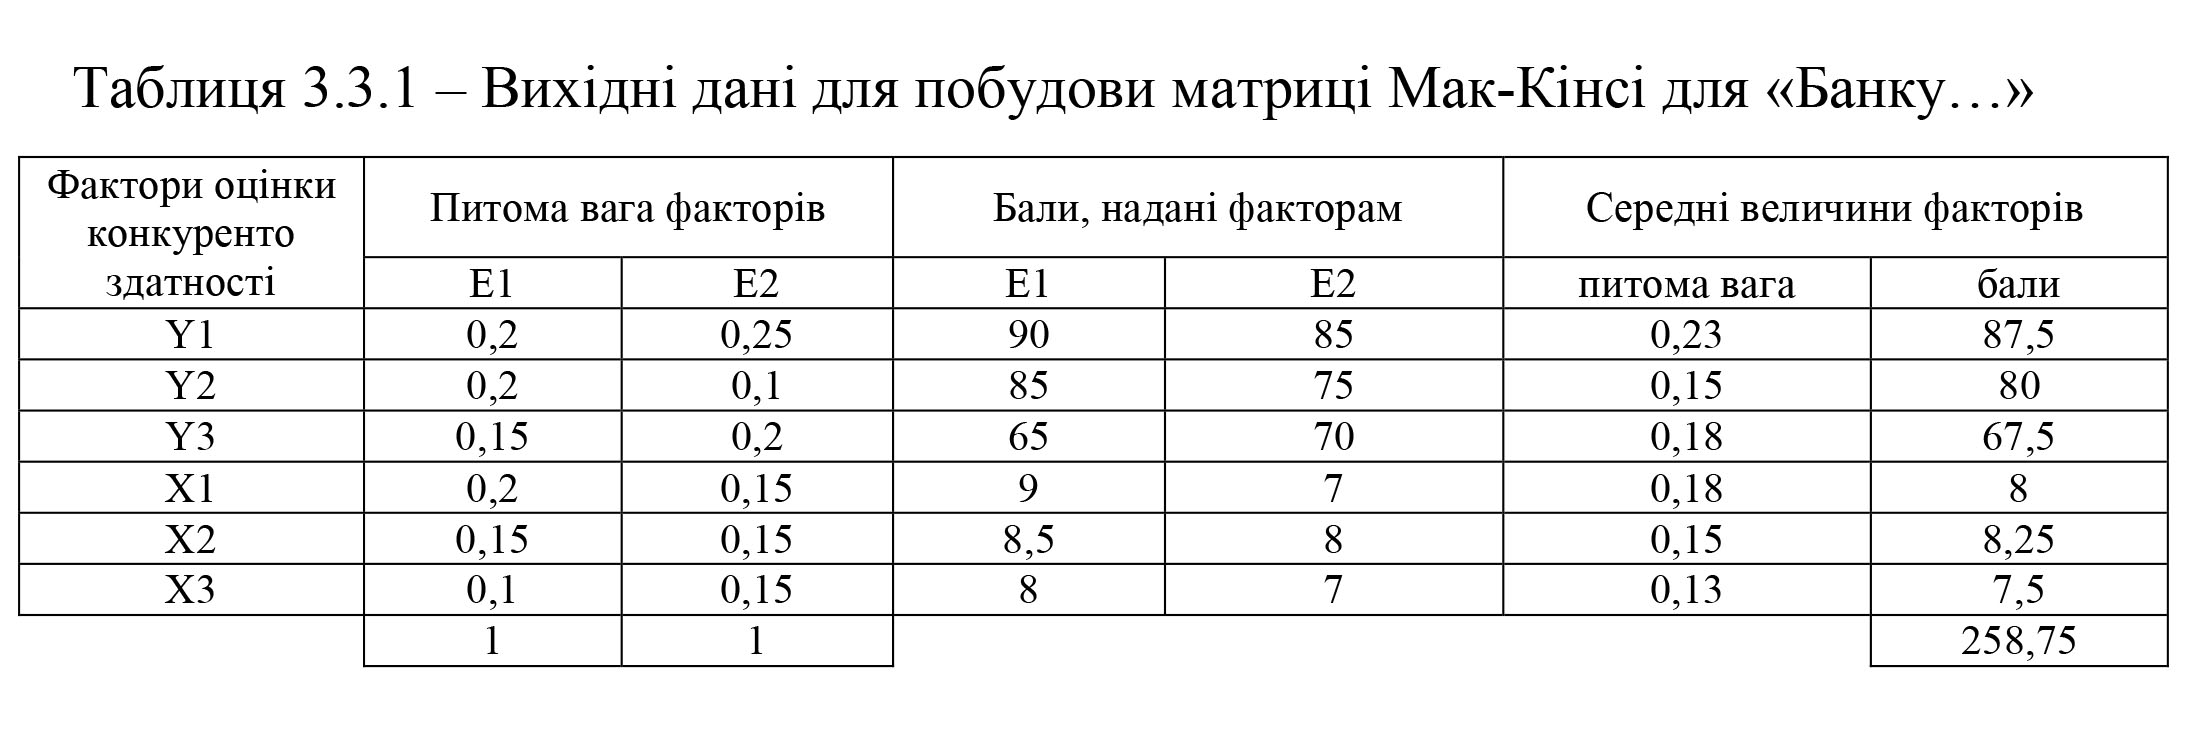
The factors characterizing the state of competitive status in the market were selected: Y1 — Relative market share; Y2 — Profit over competitors; Y3 — Management level.
Factors characterizing the attractiveness of the industry were selected: X1 — Market size and growth rate; X2 — Features of competition; X3 — Technology requirements.
To determine the position of the Bank… on the McKinsey matrix, it is necessary to calculate the integral indicators of competitive status and attractiveness of the industry.
Y (integral multifactor indicator of bank’s competitive status) = 0.23 * 87.5 + 0.15 * 80 + 0.18 * 67.5 = 20.13 + 12 + 12.15 = 44.28
X (integral multifactor indicator attractiveness of the industry) = 0.18 * 8 + 0.15 * 8.25 + 0.13 * 7.5 = 1.44 + 1.24 + 0.98 = 3.66
McKinsey is shown schematically as a portfolio analysis matrix, which determines, on one axis, the level of attractiveness of a particular industry for the company and, on the other, the competitiveness of the business units (products) of the company in the industry market.
Thus, the Bank… falls into the Intermediate 2 sector by the results of the calculations. This means that the bank has an average state of competitiveness, and the industry is characterized by the average attractiveness of the industry. The Bank needs to prioritize investing in the most profitable and least risky measures. This position is characterized by a prudent development strategy: safeguarding the existing program, concentrating investments on high-yield and relatively low-risk areas, so the bank should segment the market and monitor its weaknesses to avoid vulnerability.
5.3 Determining the competitiveness of banking products
The competitiveness of the major banking products — deposits, loans and clearing and settlement operations — can be determined using the interval scale (Likert scale). This scale measures, with the help of expressions of emotional coloring, which are then translated into points, the main criteria for banking products, according to which customers choose the bank that provides them. The criteria for banking products were evaluated on the basis of field research in the branches of selected banks and information from their official sites. The main competitors were Bank 2 and Bank 3 as the closest in rating. The main criteria for assessing deposits are the term of the deposit, terms of payment, level of service, interest rate (Table 5.3.1).
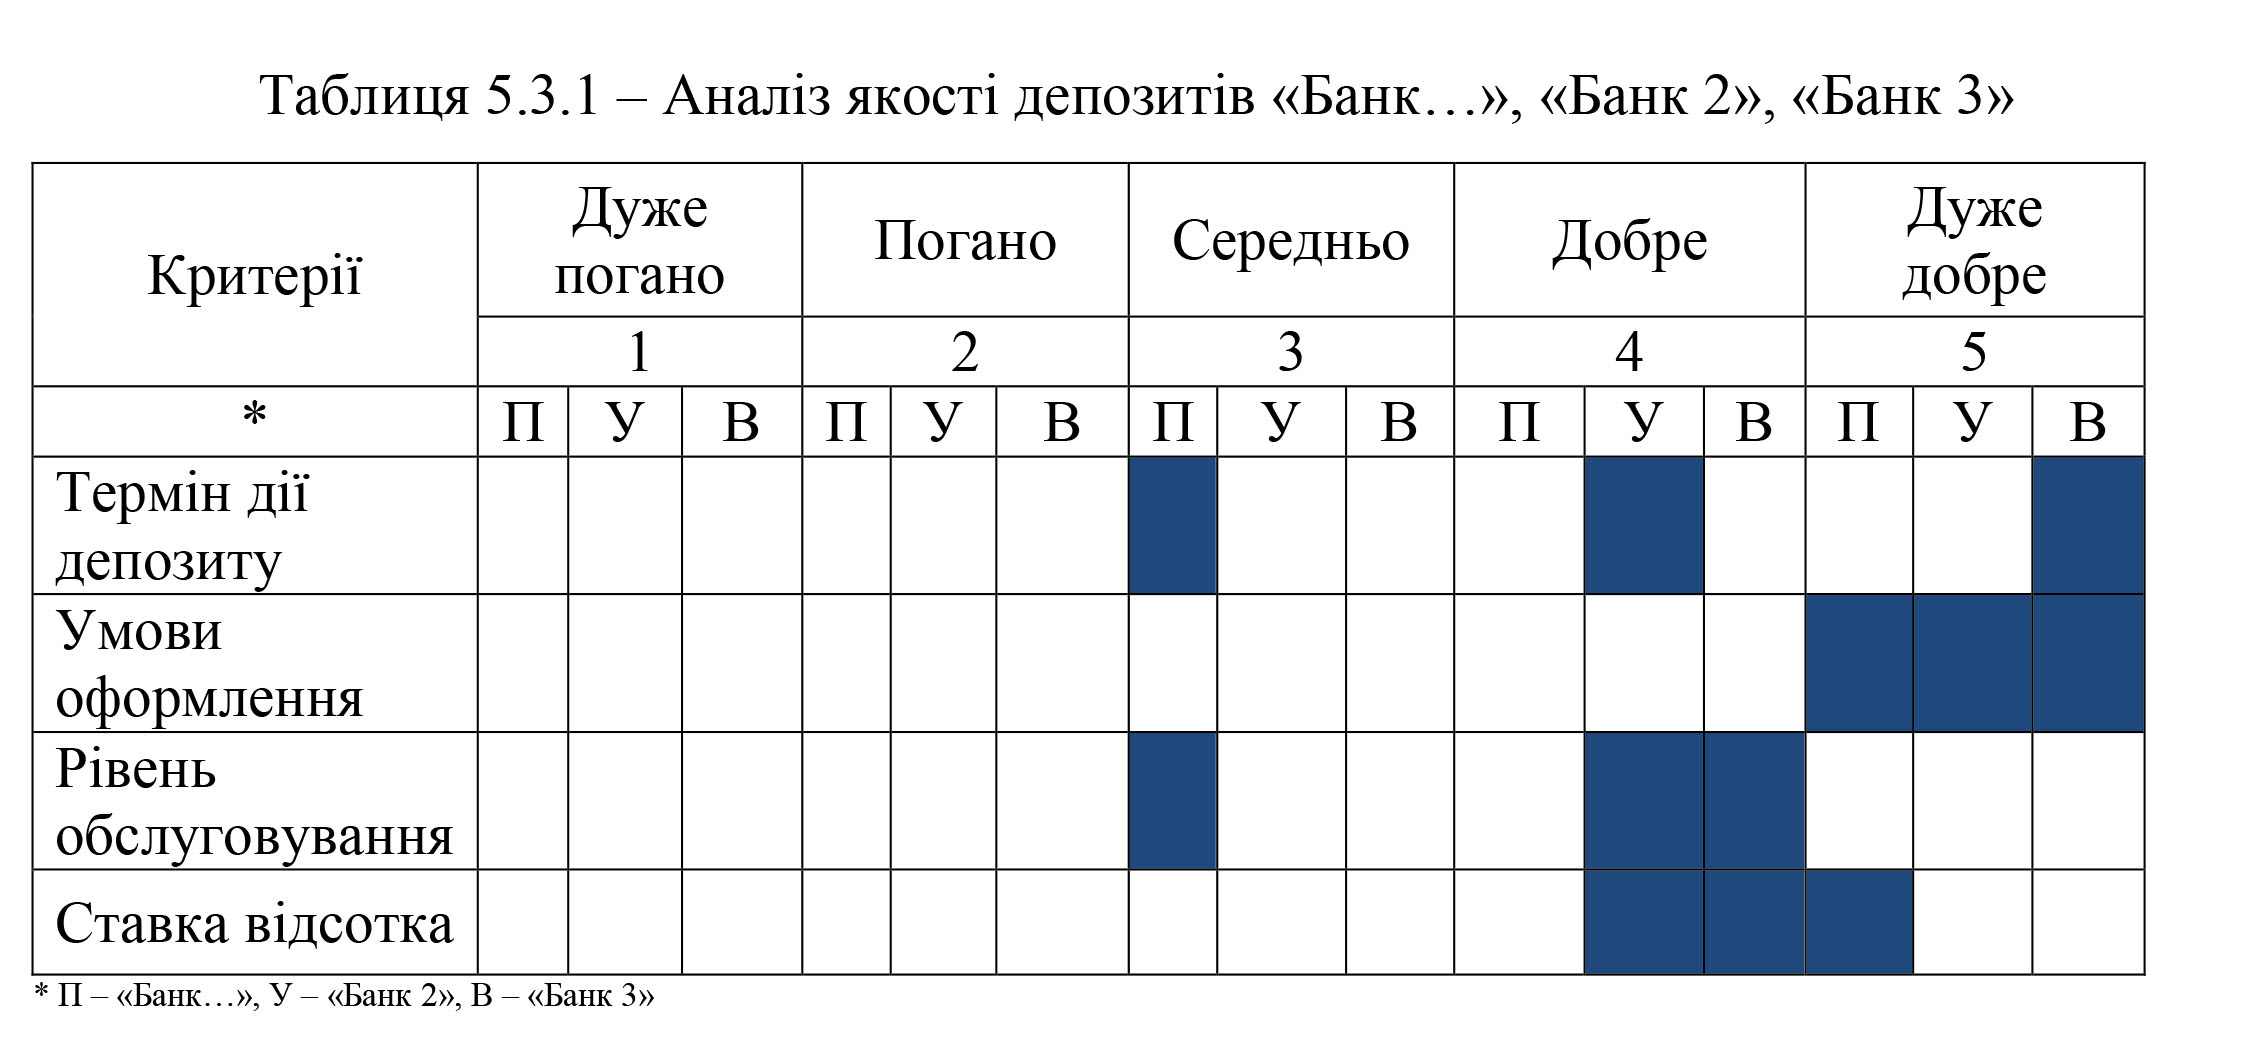
Calculate the average rating of deposits for each of the banks:
P = (3 + 5 + 3 + 5) / 4 = 4
V = (4 + 5 + 4 + 4) / 4 = 4.25
V = (5 + 5 + 4 + 4) / 4 = 4,5
Conclusion: From the above calculations we can see that the level of deposit provision varies from 4 to 4,5. The first place is Bank 3, the second is Bank 2, the third is Bank….
The main criteria for evaluating loans are the term for which the loan was issued, conditions of execution, level of service, interest rate (Table 5.3.2).
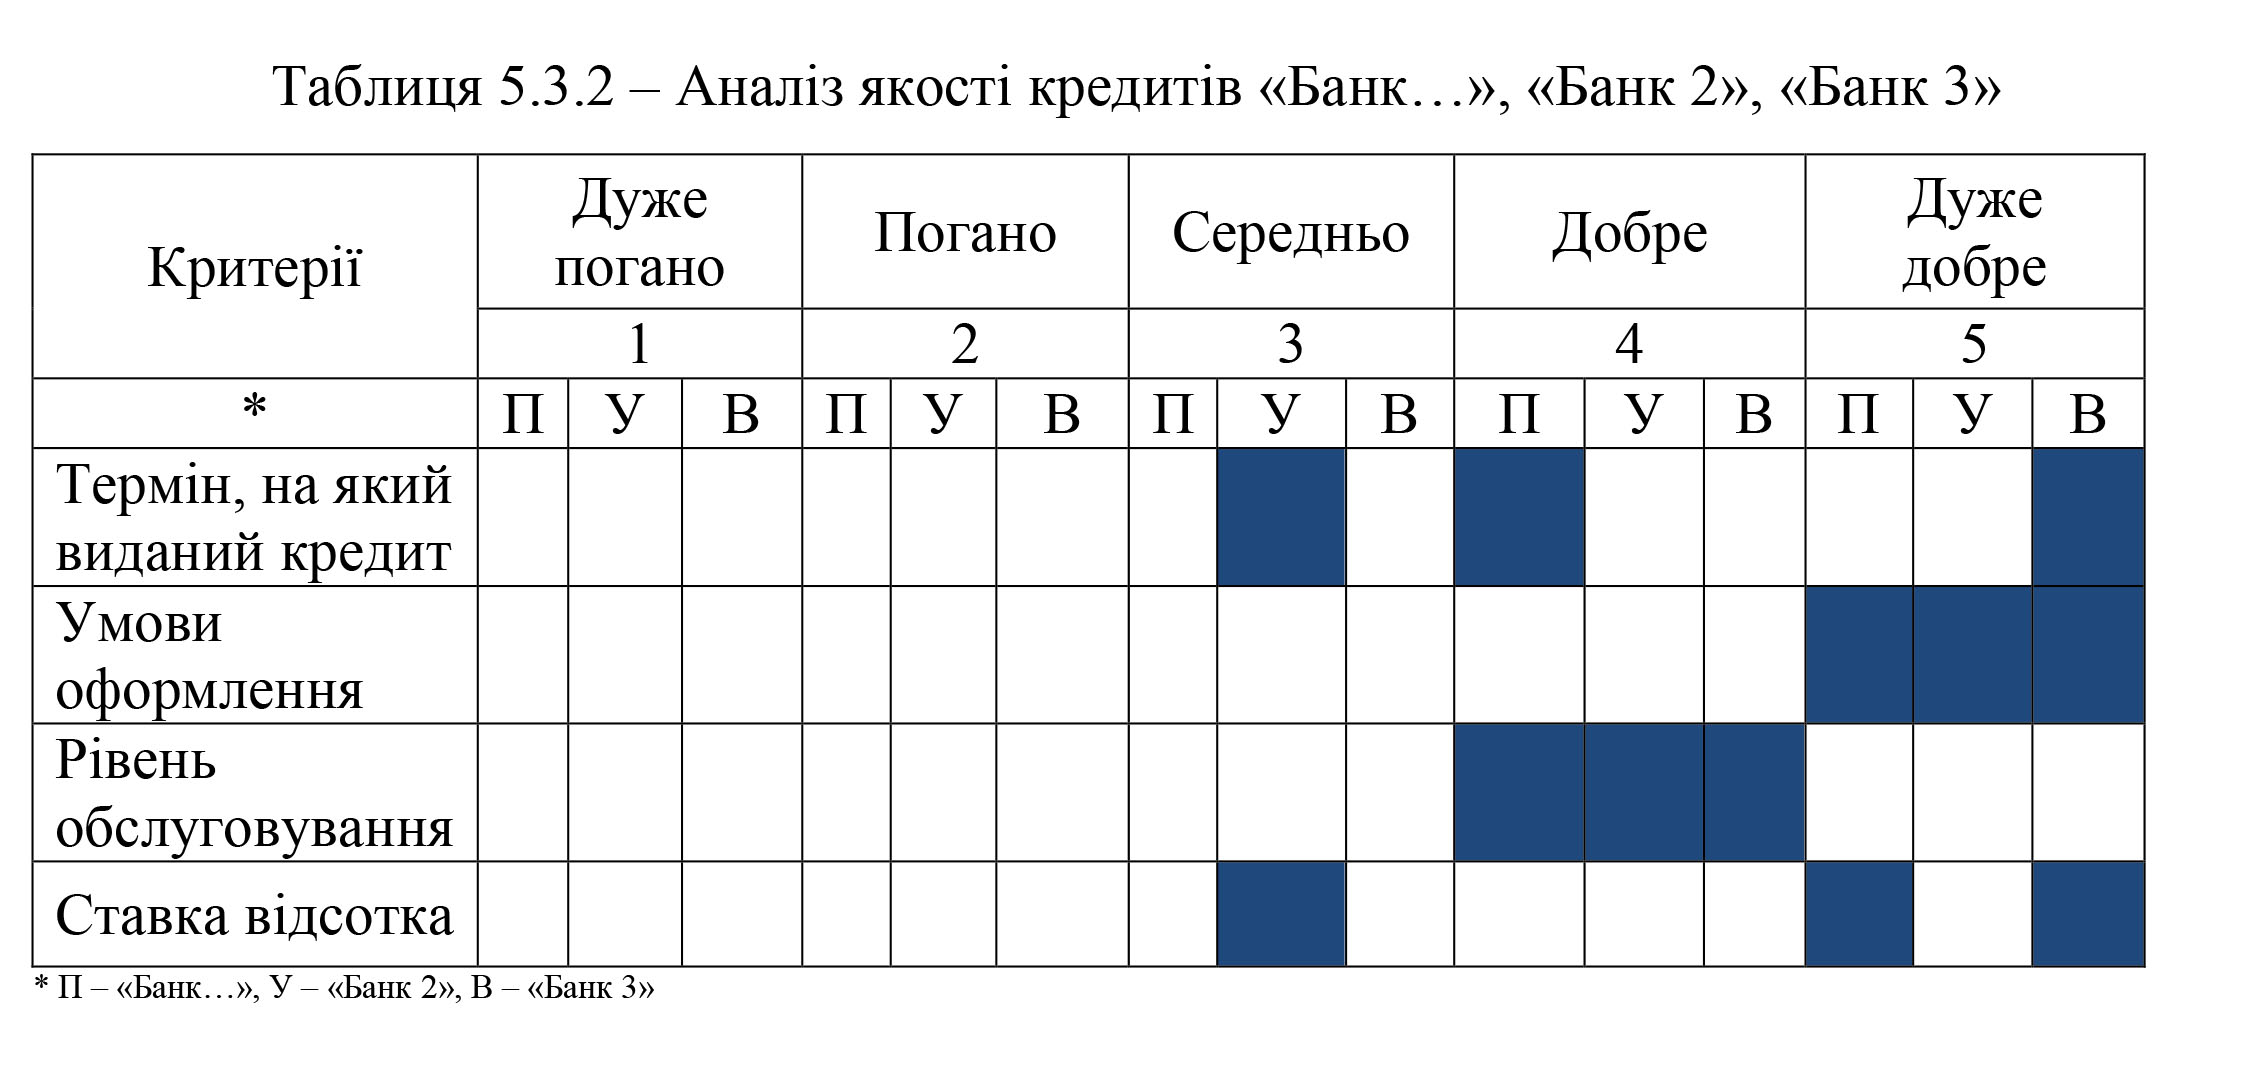
Calculate the average credit score for each bank:
P = (4 + 5 + 4 + 5) / 4 = 4,5
V = (3 + 5 + 4 + 3) / 4 = 3,75
V = (5 + 5 + 4 + 5) / 4 = 4.75
Conclusion: After analyzing the terms of the loan, it turned out that Bank 2 is far behind. The reasons for this are the short term of the loan and the high interest rate. The locations are as follows: on the first — Bank 3, on the second — Bank… and on the latter — Bank 2.
The main criteria for the evaluation of settlement and cash operations are speed of holding, commission, level of service, convenience of location of cash desks (Table 5.3.3).
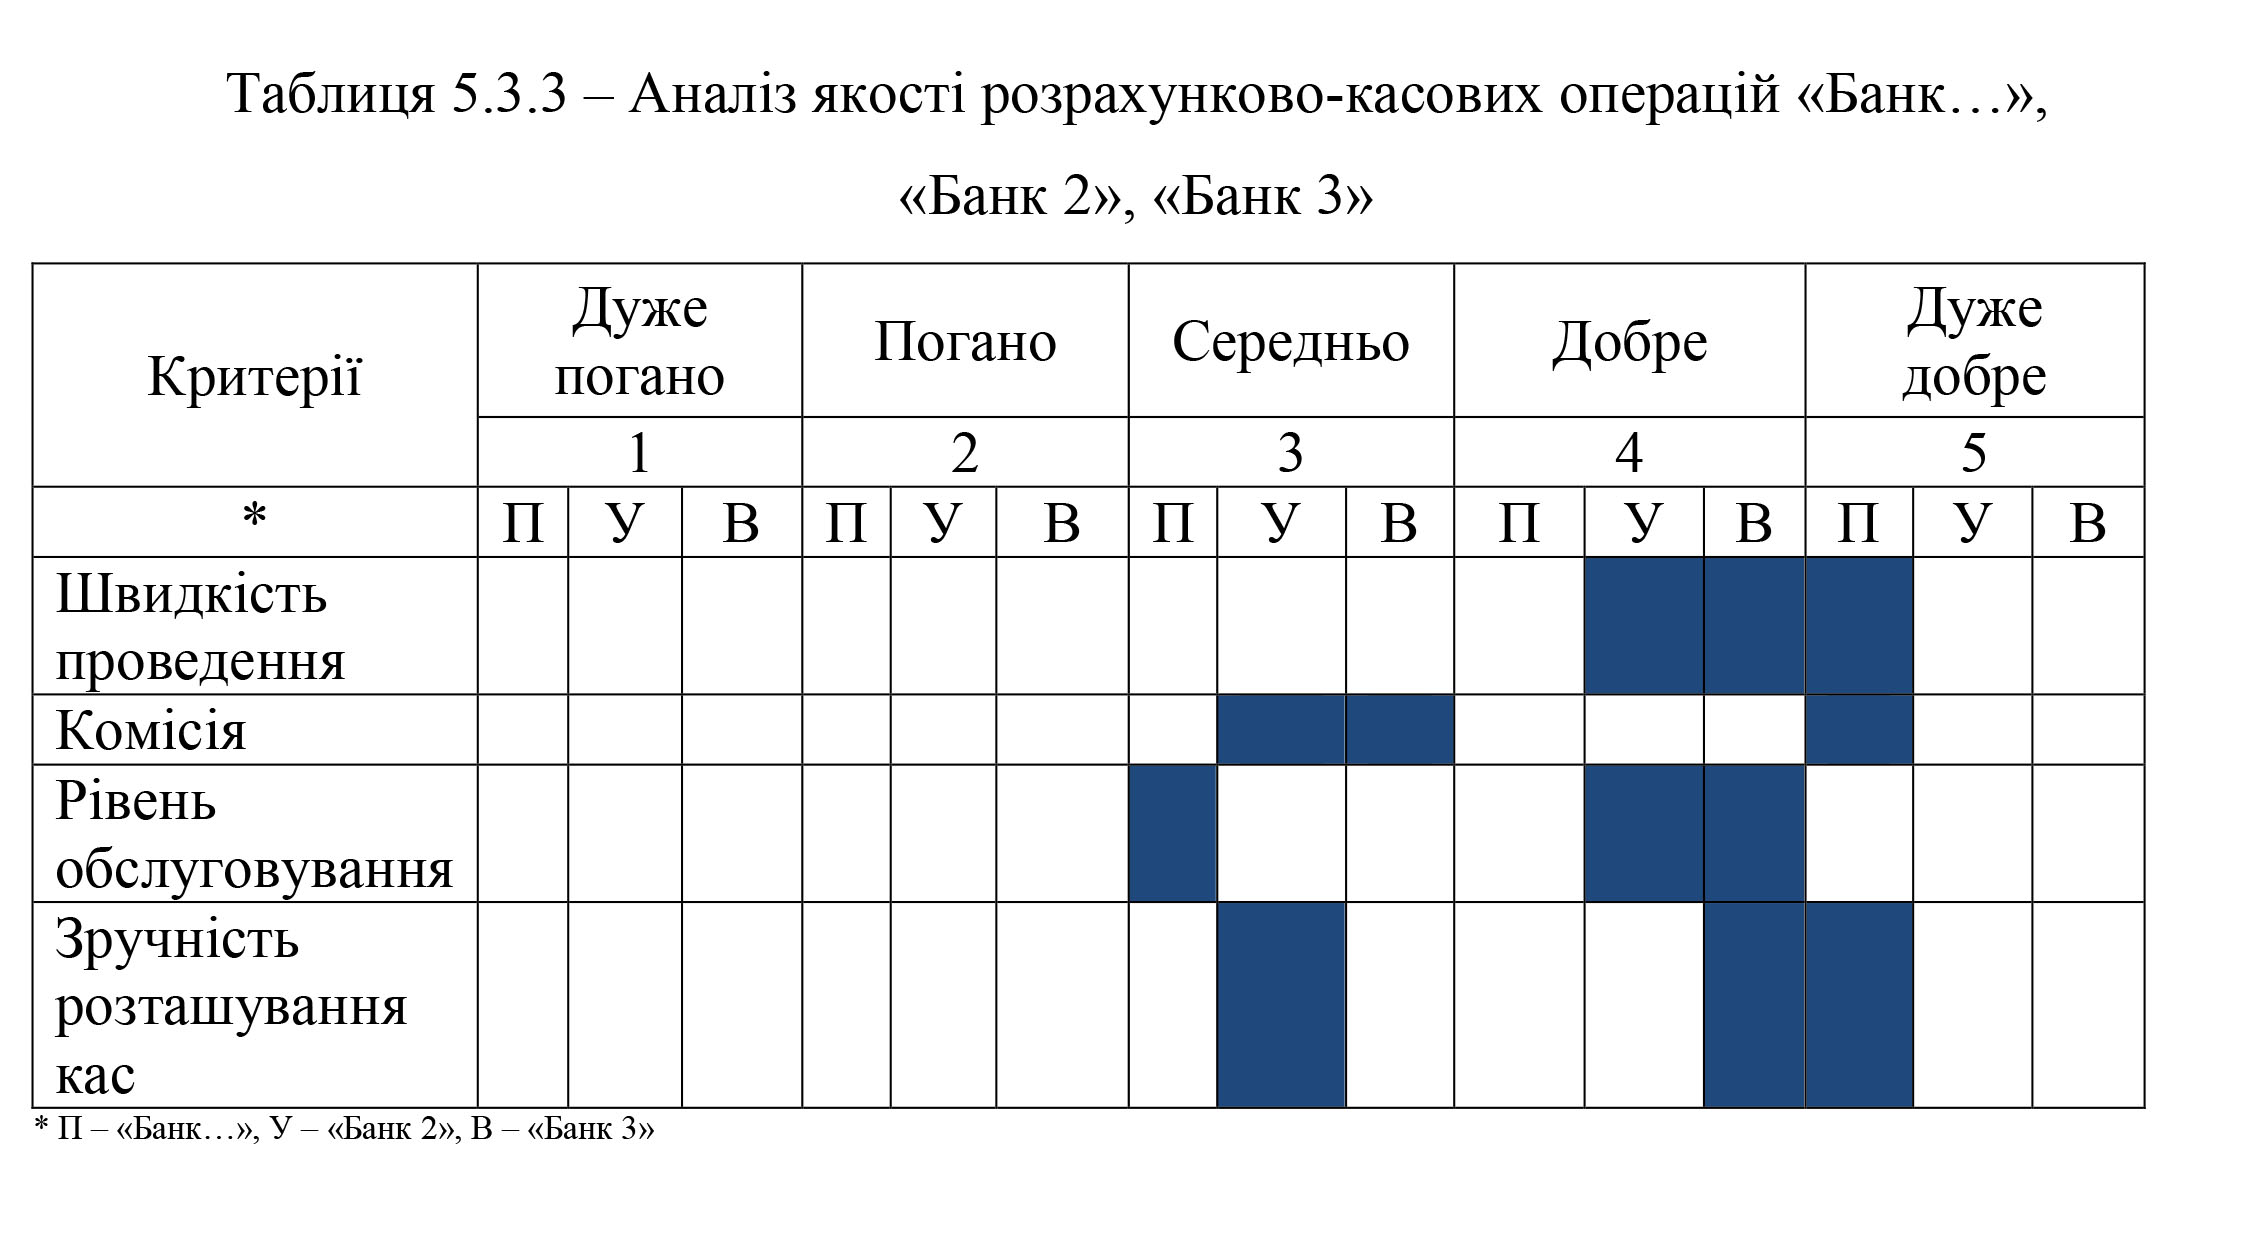
We calculate the average estimation of settlement and cash transactions for each of the banks:
П = (5 + 5 + 3 + 5) / 4 = 4,5
В = (4 + 3 + 4 + 3) / 4 = 3,5
В = (4 + 3 + 4 + 4) / 4 = 3.75
Conclusion: Bank… came out first, Bank 3 ranks second (a larger commission lowered its overall rating), Bank 2 ranks third (should be increased the number of cash registers where the transaction could be conducted and the commission charged).
EXCEPT FROM THE REPORT ON THE PROVISION OF CONSULTING SERVICES ON THE DEVELOPMENT OF SOCIAL RESPONSIBILITY OF THE BANK
completed in 2014, © Nemtsov OV
3.3 Development of the structure of the Bank’s social report …
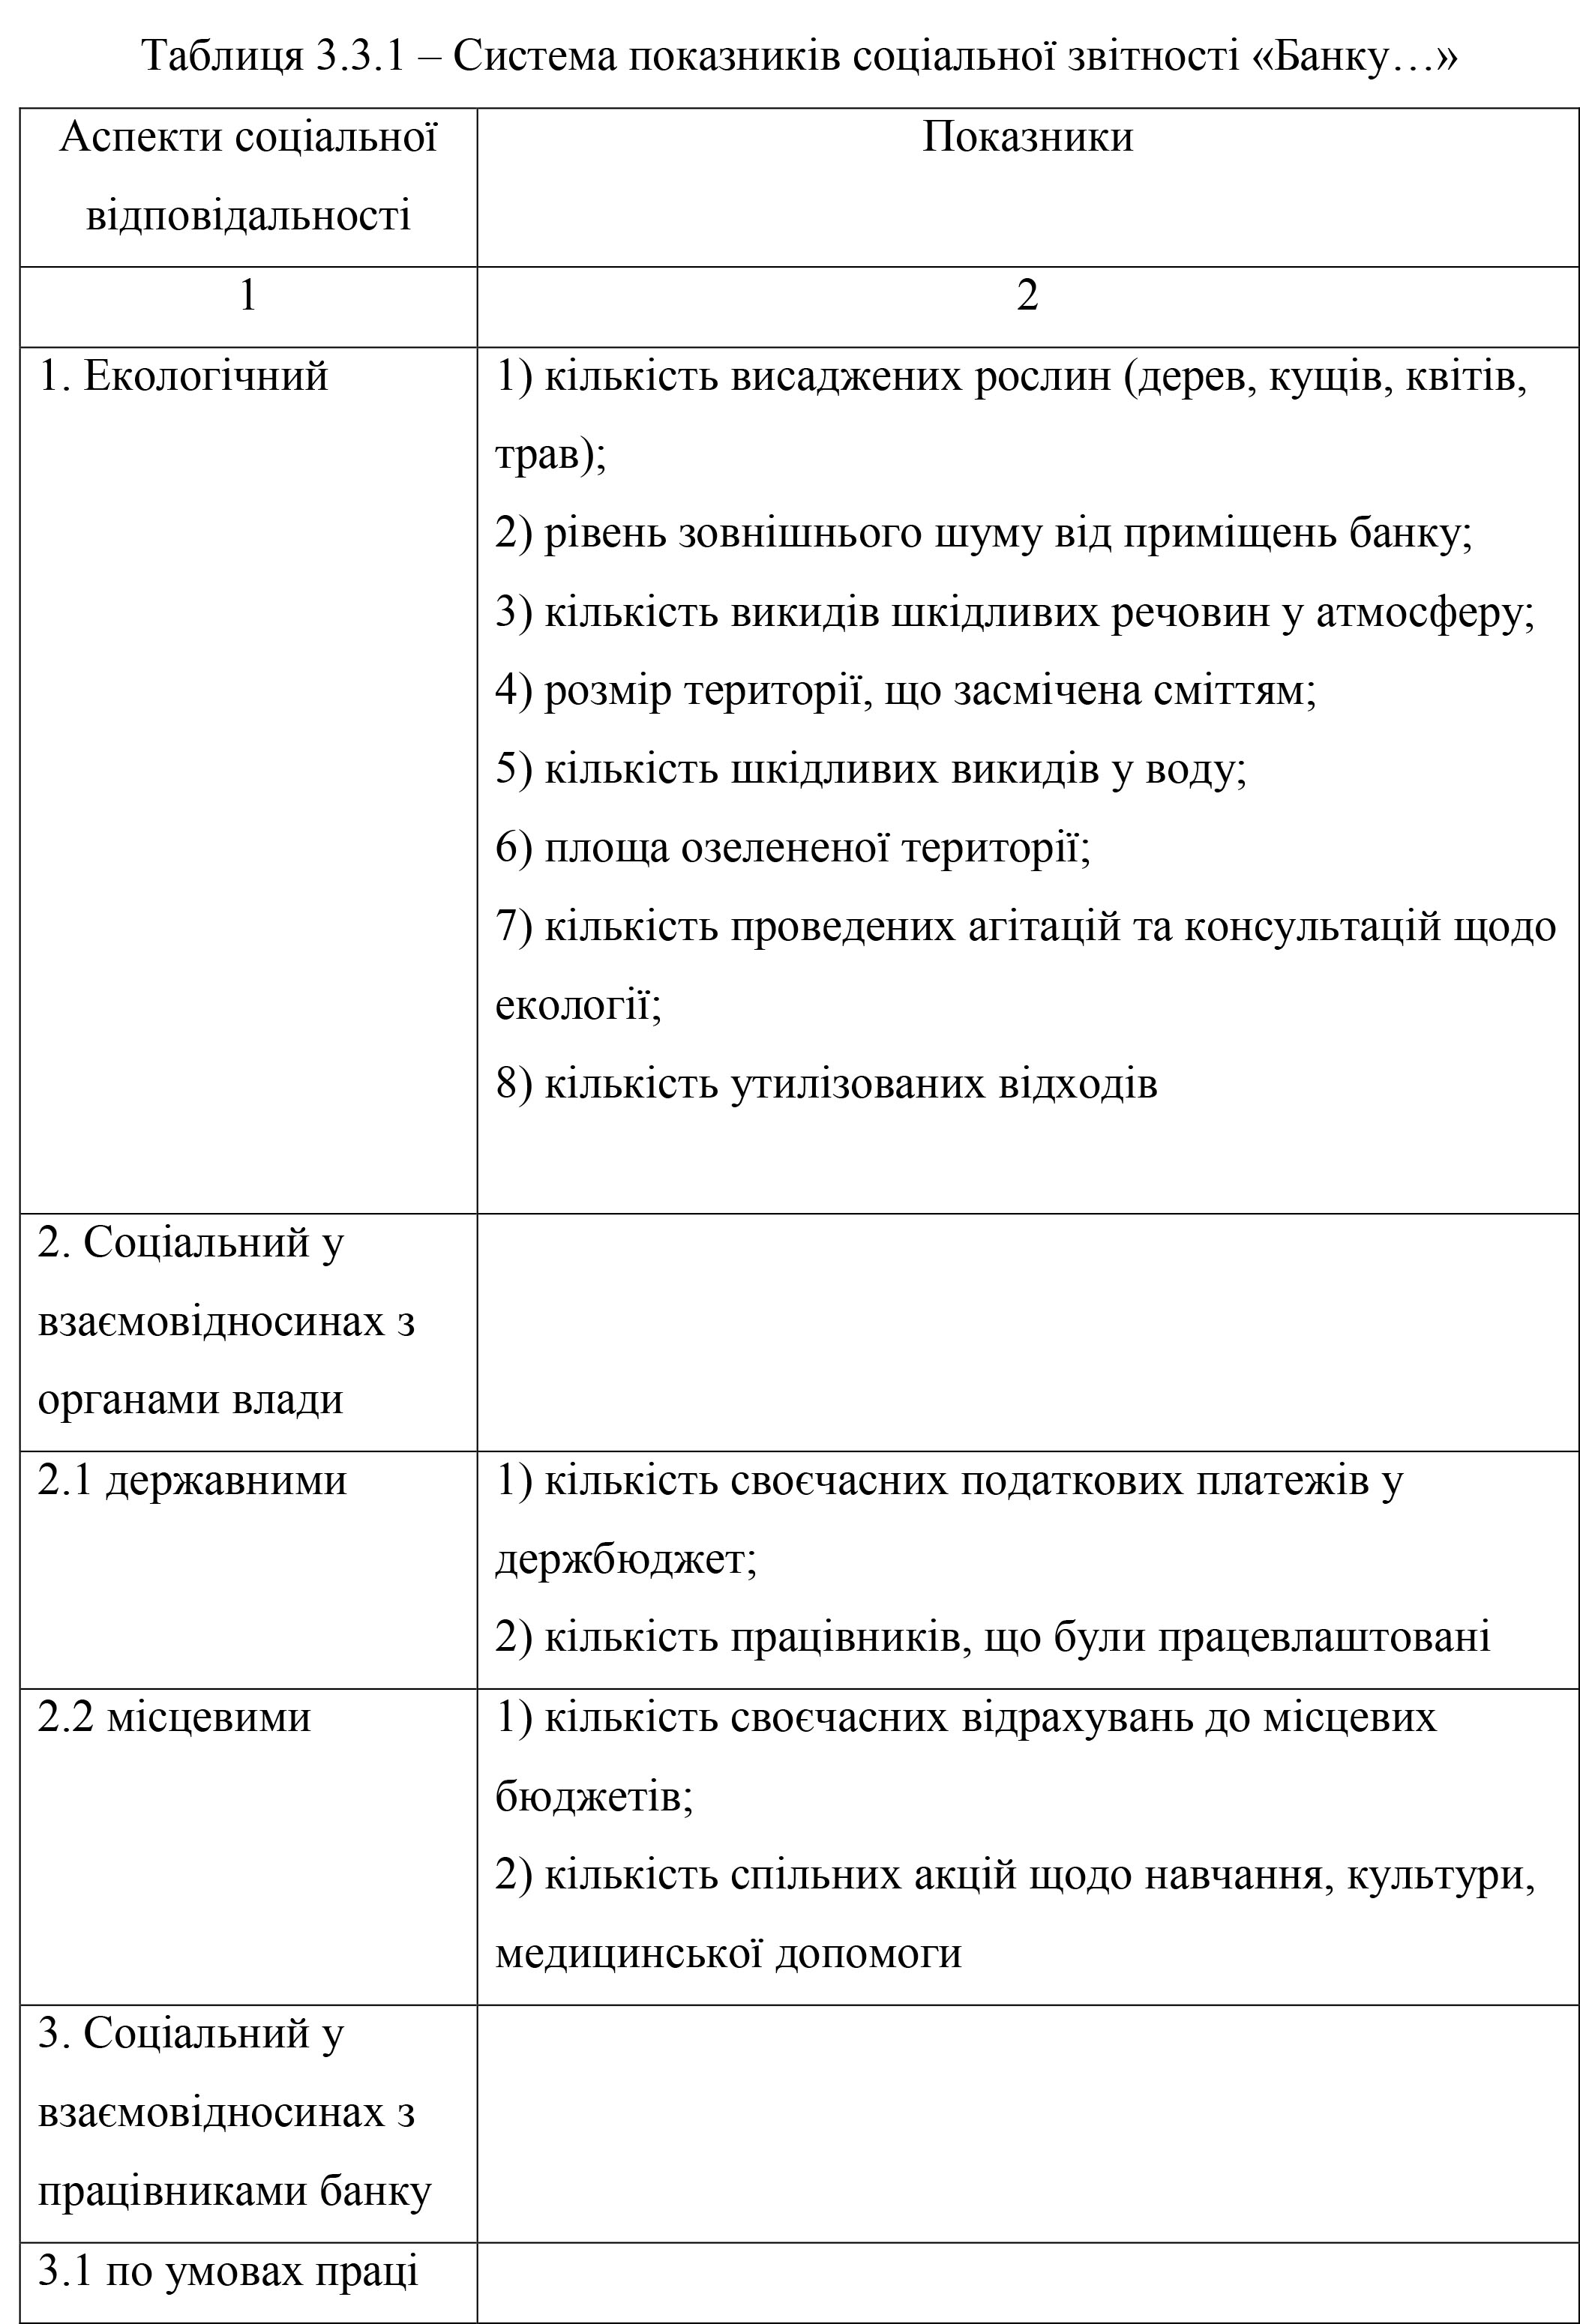
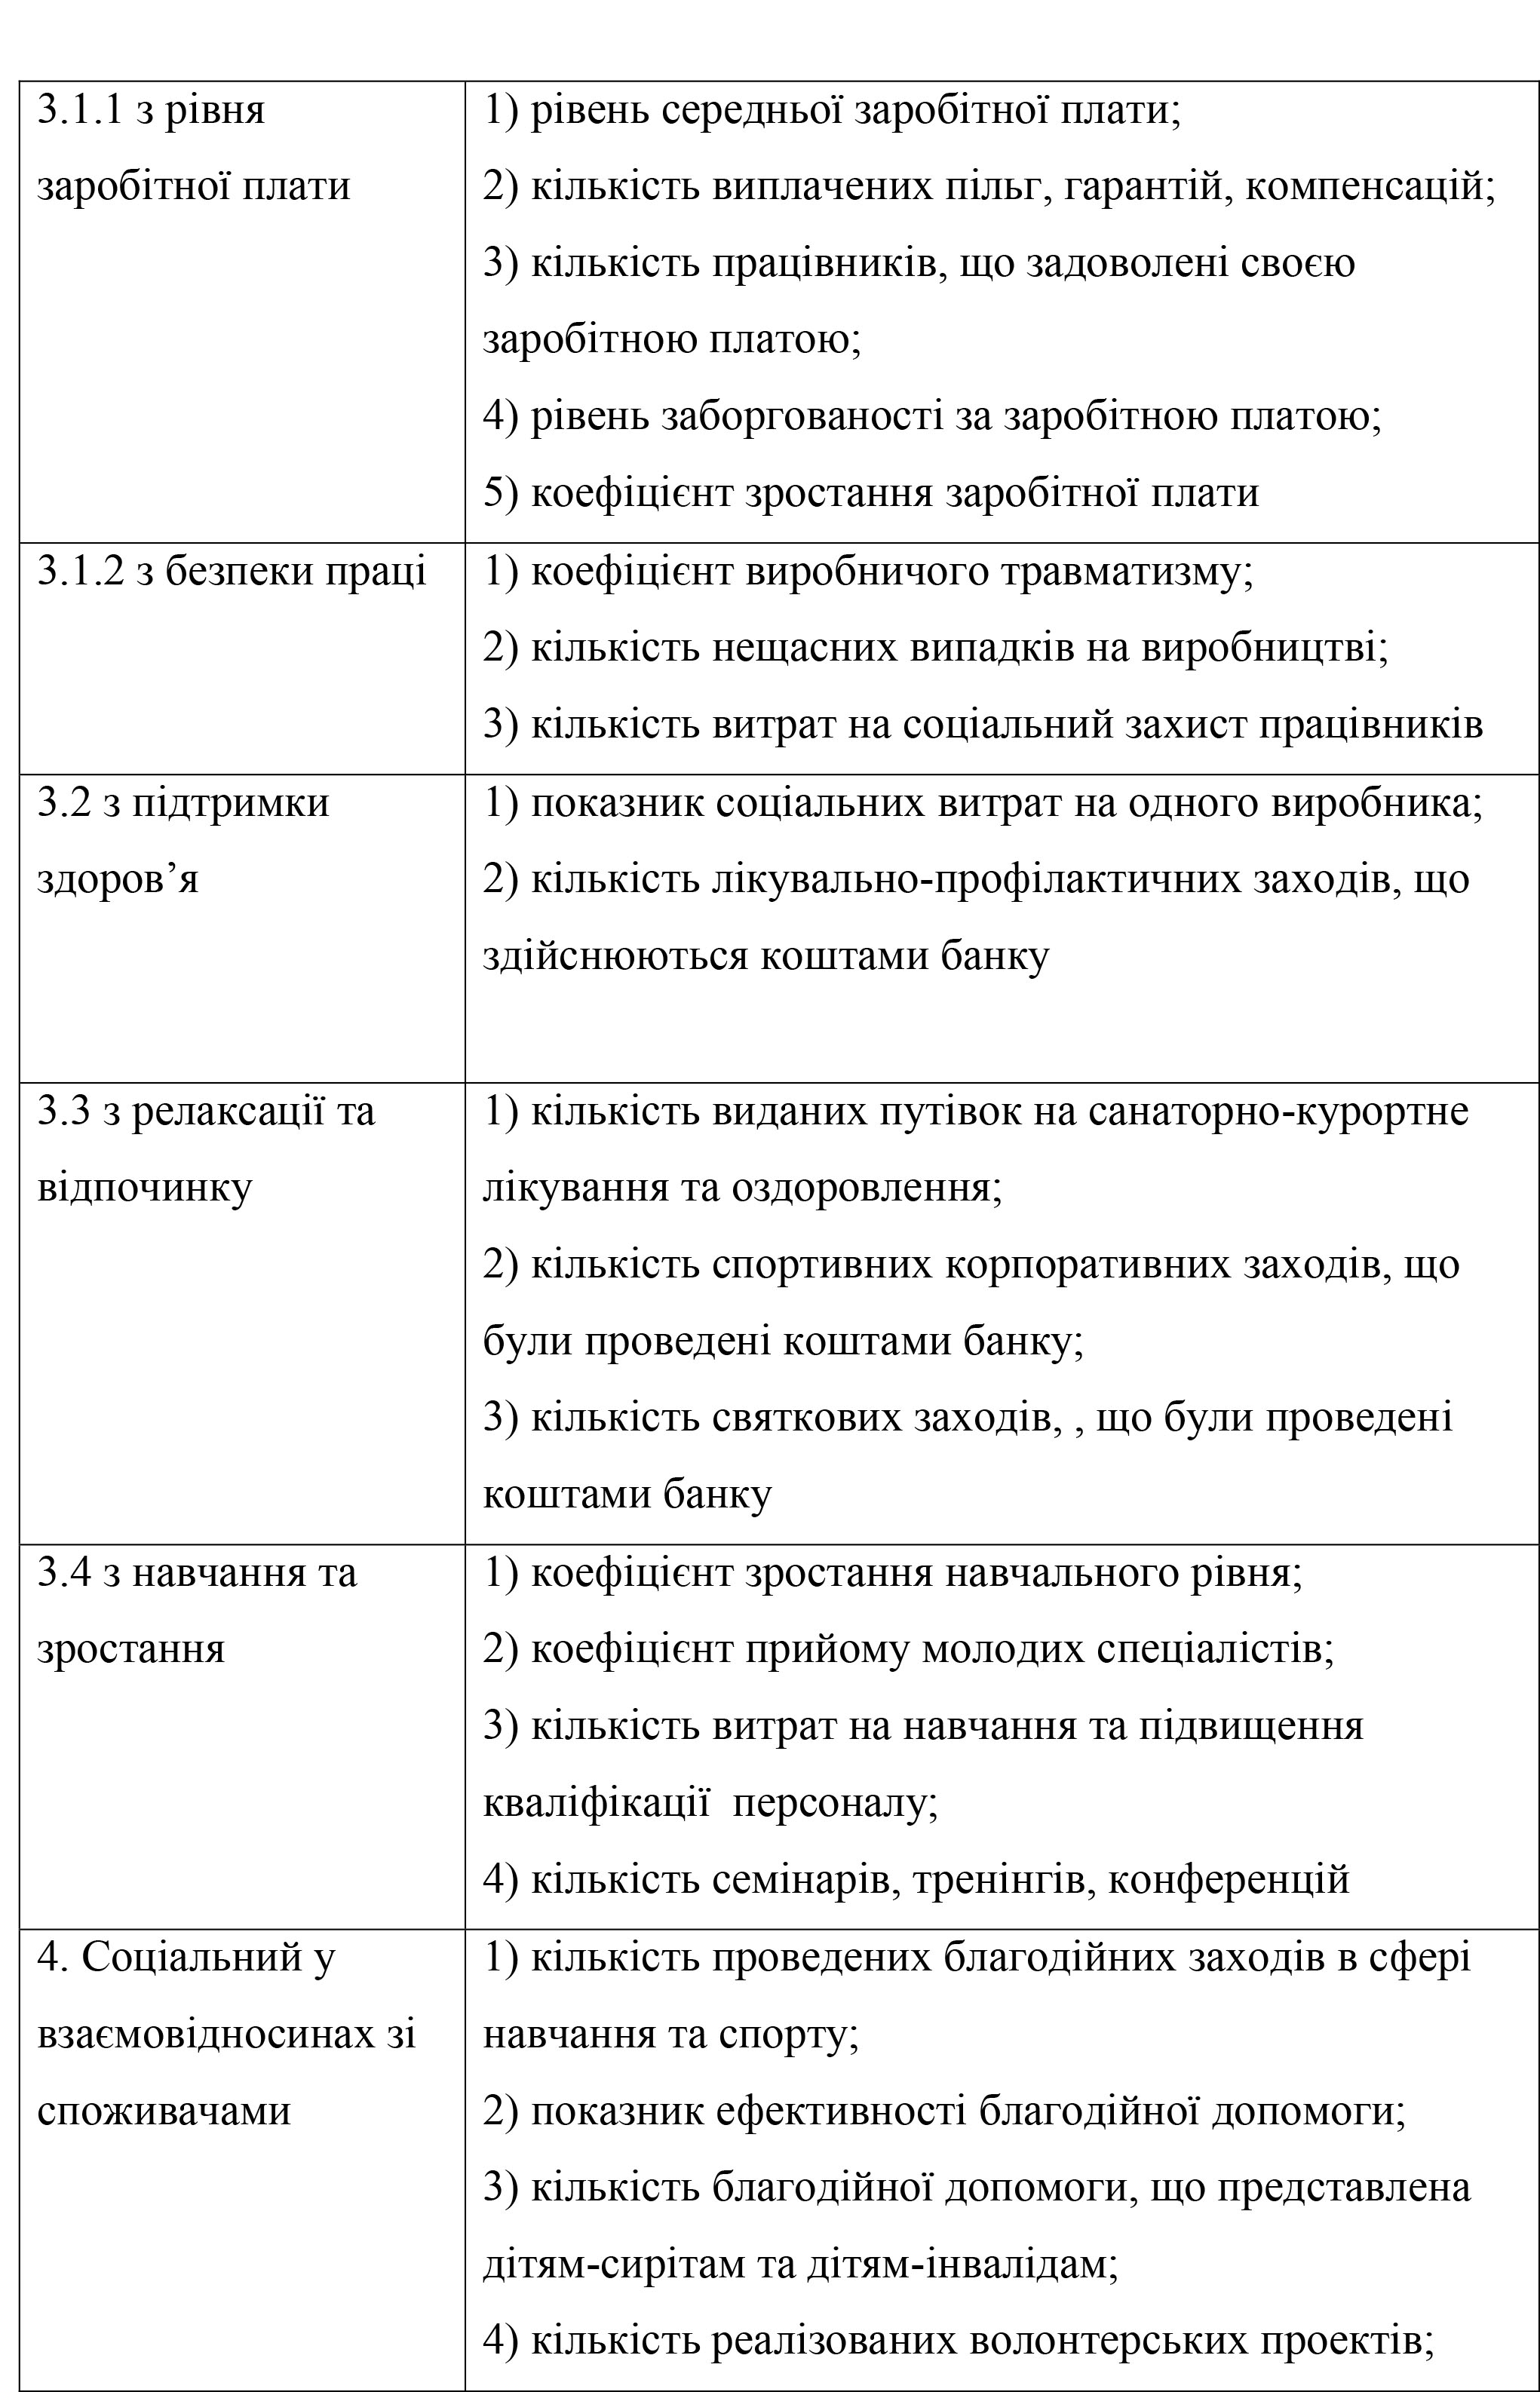
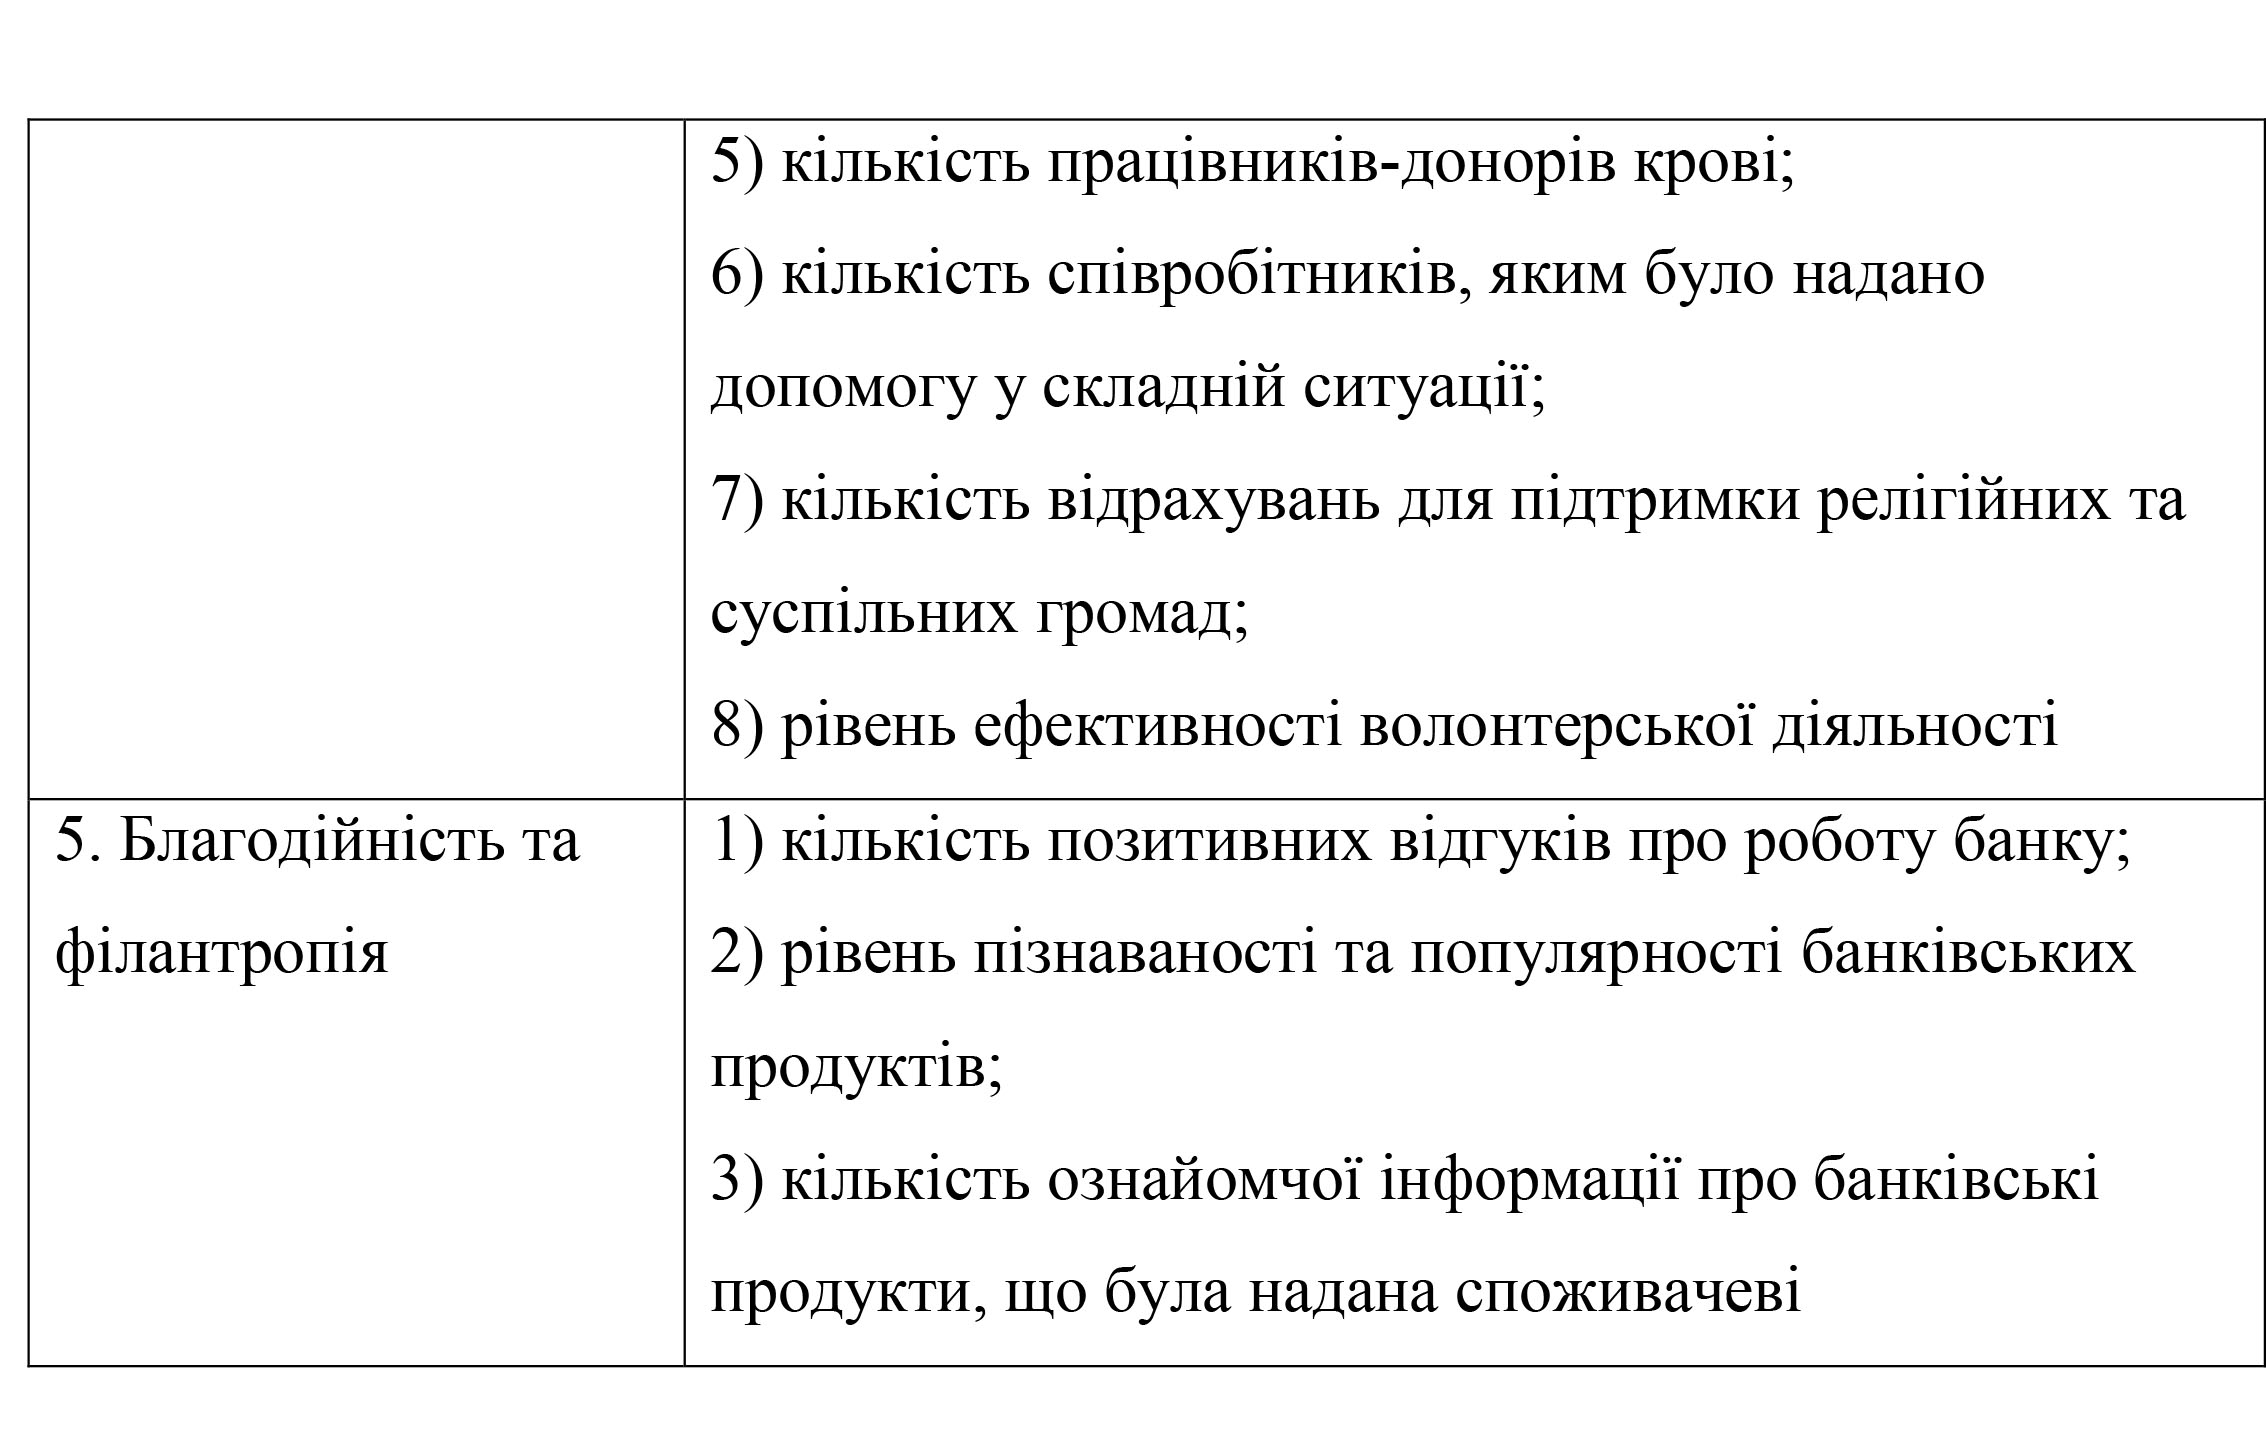
As shown in Section 2.3, the structure of the Bank’s social report is built on the basis of European standards for this type of reporting and is based on a European (continental) model, so all of the above aspects of the CSR strategy are taken into account. However, such a structure of social reporting lacks specifics, that is, in our view, it is necessary to express in concrete indicators all aspects of the bank’s social responsibility activities. This will allow for objective, clear and quantitative reporting on the implementation of certain measures, which will certainly meet the highest European standards of social audit, as well as the basic provisions of the management concept — a system of balanced indicators, which allows to operationalize the CSR strategy and create the preconditions for its real implementation . Table 3.3.1 lists the developed system of social reporting of the bank, which is proposed to be included in the social reporting of the Bank….
Analysis of the Methodological Planning Basis and Assessment of the State of the Planning System at Heat Supply
Enterprises
published in 2011. Effective Economics — 2011, © Nemtsov OV
Annotation. The systematic foundation of planning for Ukrainian heat supply enterprises have been analyzed. The system planning of Kharkov’s heat supply enterprises have been evaluated, using a functional information model. The appraisal of integration of Kharkov’s heat supply enterprises plans have been done.
Keywords : methodological support for planning of heat supply enterprises, methodical approach to the analysis of the formation of the planning system, methodical approach to the assessment of the enterprise plans system, functional information model, IDEF0 format.
Formulation of the problem in general.
There are many methodological provisions for sector-specific planning, including for heat supply. At these enterprises, a strong methodological basis for planning has been maintained and applied, but under the current conditions, it is necessary to change existing approaches to it, which are expressed mainly in the normative method of its implementation. The norms that underlie these standards are quite outdated and regressive, taking into account not only the latest but also the present realities. Many steps have been taken, especially in the activity of the Ministry of Industry and the Cabinet of Ministers of Ukraine in recent years, which have prepared new methodological recommendations for tariff planning of utilities. But such a specific kind of methodological provision as a methodical approach to the analysis of the formation of the enterprise planning system is not reflected in any single document or recommendations, and in general, even in the totality of those planning recommendations and regulations that exist today, are not clearly reflected and sufficiently blurred outlines. Therefore, it is very urgent to study existing regulations and planning recommendations, as well as to develop a methodological approach to the analysis of the formation of a planning system based on this methodological support.
Analysis of recent research and publications. Among the scientists and practitioners who were engaged in the analysis of methodological support and the actual methodologies of formation of the planning system include R. Akoff I. Ansoffa, G. Benveniste, P. Duyle, G. Mintsberg, F. Kotler, A. Ilyin, O. B. Bad, GM Tarasyuk, as well as many experts who have prepared various methodological recommendations for planning many functional aspects of the enterprise, especially industry — in the field of heat and utilities.
The purpose and purpose of the article. To analyze the methodological basis of planning that exists at the heat supply companies in the context of the formation of the planning system, and to evaluate the existing planning system, formed on the basis of the existing methodological support.
Outline of the main research material. Today, there are many methods for planning various aspects of activity of heat supply companies in Ukraine, the perfection of which can be assessed on the basis of comparative analysis with similar methods existing in the Russian Federation and the Republic of Belarus. The choice of such objects of comparison is due to the fact that the district heating companies are mostly in the countries of the former USSR and have no analogues in the countries of Europe, USA, Canada, Latin America, Japan and other developed countries and advanced developing countries. In these countries (Europe, USA, Canada, Latin America and Japan, other developed countries), the production of heat and hot water is essentially essentially where they are consumed, that is, directly outside the city of consumption,
The main directions in which we will carry out a comparative analysis of planning methods for the activity of district heating companies will be:
- system of indicators;
- mechanism and procedure of planned activity;
- methods used in planning;
- economic and legal aspect of planning.
The district heating companies of Ukraine, the Russian Federation and the Republic of Belarus use almost identical indicators, which is a consequence of the use of many of these indicators in these countries even during the coexistence of the USSR. However, there are some differences in the indicators used, which is primarily due to differences in tax law and accounting. That is, the grouping of the same costs is somewhat different, but in general they show the same.
It should be emphasized that in general absolute indicators are used in planning and only in Belarus several relative indicators are used to characterize and show qualitative changes that are to take place in the planned period, namely: growth rates of production of services, growth rates of sales volumes services, energy saving, cost reduction, wage growth.
The mechanism and procedure according to which it is carried out play a prominent role in the methodology of planning the activity of the enterprise. In our understanding, a mechanism is a sequence of certain actions of a computational nature, that is, answers the question «how?». The procedure is a sequence of specific regulatory actions, ie it answers the question «when?» and «who?» Therefore, the mechanism outlines what planning actions should be carried out in the context of the calculation of indicators or the definition of goals or objectives, and the procedure describes when and by whom these actions should be implemented.
The planning mechanism used in district heating enterprises in Ukraine [85, 86, 87] is as follows. Initially, the enterprise should conduct an assessment of preliminary results and analysis of production and economic activity in previous years, which involves a sufficiently thorough study of the technical and technological parameters of production, commercial contracts with suppliers and consumers, pricing and payments both at their own enterprise and counterparties. The next step is to determine the resource requirements for the provision of services in kind, which involves forecasting the production of thermal energy, material resources for its production, the number of employees of the enterprise, etc. The third stage is the most time-consuming and time-consuming work, because it calculates the individual components of costs in monetary terms, that is, determines all types of costs that are and can be at the enterprise, those costs that can be predicted, are planned taking into account the rules and regulations defined by the normative legal acts of Ukraine in this field. In the next stage, the costs per unit of service are directly determined and the cost of 1 Gcal, produced and supplied thermal energy for district heating, and 1 m respectively are generated.3 , produced and supplied heat for district heating, as well as the cost of other services (if any) provided by the enterprise, and the total cost of services is formed. The final stage is the formation of tariffs for consumer groups, which provides for the distribution of costs for the conditional and conditional variable parts and the formation, respectively, of the tariff for the right to use district heating systems and for directly consumed thermal energy by consumer groups.
An innovation in this area is the emergence of an investment component, which some regulatory acts interpret as part of the target costs, which should be spent on the reconstruction, modernization and restoration of fixed assets of heat supply companies, and some regulatory acts equate this component to the profit, which they believe should to be directed only at reconstruction, modernization and restoration of fixed assets of heat supply enterprises. This legal conflict is in the process of being resolved, as long as the enterprises use the investment component for the target expenses and the profit is not generated at all due to the inconsistency of the tariff.
Among the features in the planning mechanism implemented by the heat supply companies in Belarus and the Russian Federation are the following:
- In the Russian Federation, the analysis of actual data for the previous periods is more complex in nature, since it involves the determination of reserves for reducing material costs, the analysis of resource conservation measures, the analysis of factors that increase the value of cost.
- In the Russian Federation, there is such a step as determining the basic ratios and proportions that occurs through the use of a system of standards-indicators. That is, for all indicators used in enterprise planning, indicators are indicators that represent a specific guideline to which one or another plan indicator should gravitate, this is a kind of a control phase that allows one to reconsider the feasibility and rationality of plans. It can be said that this stage is characteristic of this kind of planning as indicative.
- In the methodology used in the Russian Federation, more attention is paid to the modernization and development of fixed assets, which with a considerable percentage of their wear and tear is extremely necessary and advisable, because it can significantly increase the efficiency of energy savings in the transport of coolant in networks and in the production of thermal energy. At the same time, the methodology used in Ukraine describes in more detail the process of cost formation and sources of their formation.
- In the Russian methodology, considerable attention is paid to the amount of investment for development and resource conservation, and in Ukrainian — the order of tariff formation is more detailed.
- The result of the planning mechanism is described somewhat differently in the investigated methods: in Ukraine, more attention is paid to internal social processes occurring at the enterprise — the development of its economic relations, in the Russian Federation — to external social processes — compliance of services provided by the enterprise to the quality of service standards, and in Belarus takes into account both — the social component and the possibility of expanding enterprise reproduction are taken into account.
The planning procedure for district heating companies in Ukraine is a detailed schedule by days of planned actions and those responsible for these actions: the structural subdivisions of the enterprise, which compile, analyze, transmit, receive various planning information, in the form of certain documents, within a specified time. Based on a comparative analysis of the methodological provisions for planning at the heat supply companies of Ukraine, the Russian Federation and Belarus, it can be noted:
- There is no direct information on the planning procedure in the normative documents of Ukraine, only on the basis of indirect information (a number of legislative acts) can a general planning procedure be formed.
- In the Ukrainian methodology, more attention is paid to the operational level of planning, which determines the relationship in the current activity of planning entities with various consumers of their work: state and municipal authorities, contractors, independent organizations, external investors, etc.
- In the Russian method the general procedure of planning procedure is specified, which is specified in other special normative legal acts or in administrative documents on the enterprise.
- The Belarusian methodology tends to the tactical level, specifies in detail the subjects of the planned activity in the enterprise, interacting with specific bodies of state and municipal authorities, their relationships, rights and responsibilities, while specifying the specific terms of performance of their part of the planned work.
- In general, the planning procedures outlined in the investigated methods coincide, the only difference being the possibility of having several contractors of the same service in the Russian Federation, which contributes to the development of competition in this field.
Another area of comparison for planning methods for district heating companies is to study the methods by which planning is carried out. From the context of the legislative acts under study, it can be concluded that the main method used in planning the cost and tariff of a district heating company is the normative method.
However, a number of different methods can be used in the activities of district heating companies, in particular when developing standards and standards on their own. It should be noted that norms and norms, independently developed by the enterprise, must be approved by the relevant state authorities as far as they are competent and only after certain verification has been carried out. The application of certain methods in planning should not be contrary to the norms and norms established by law.
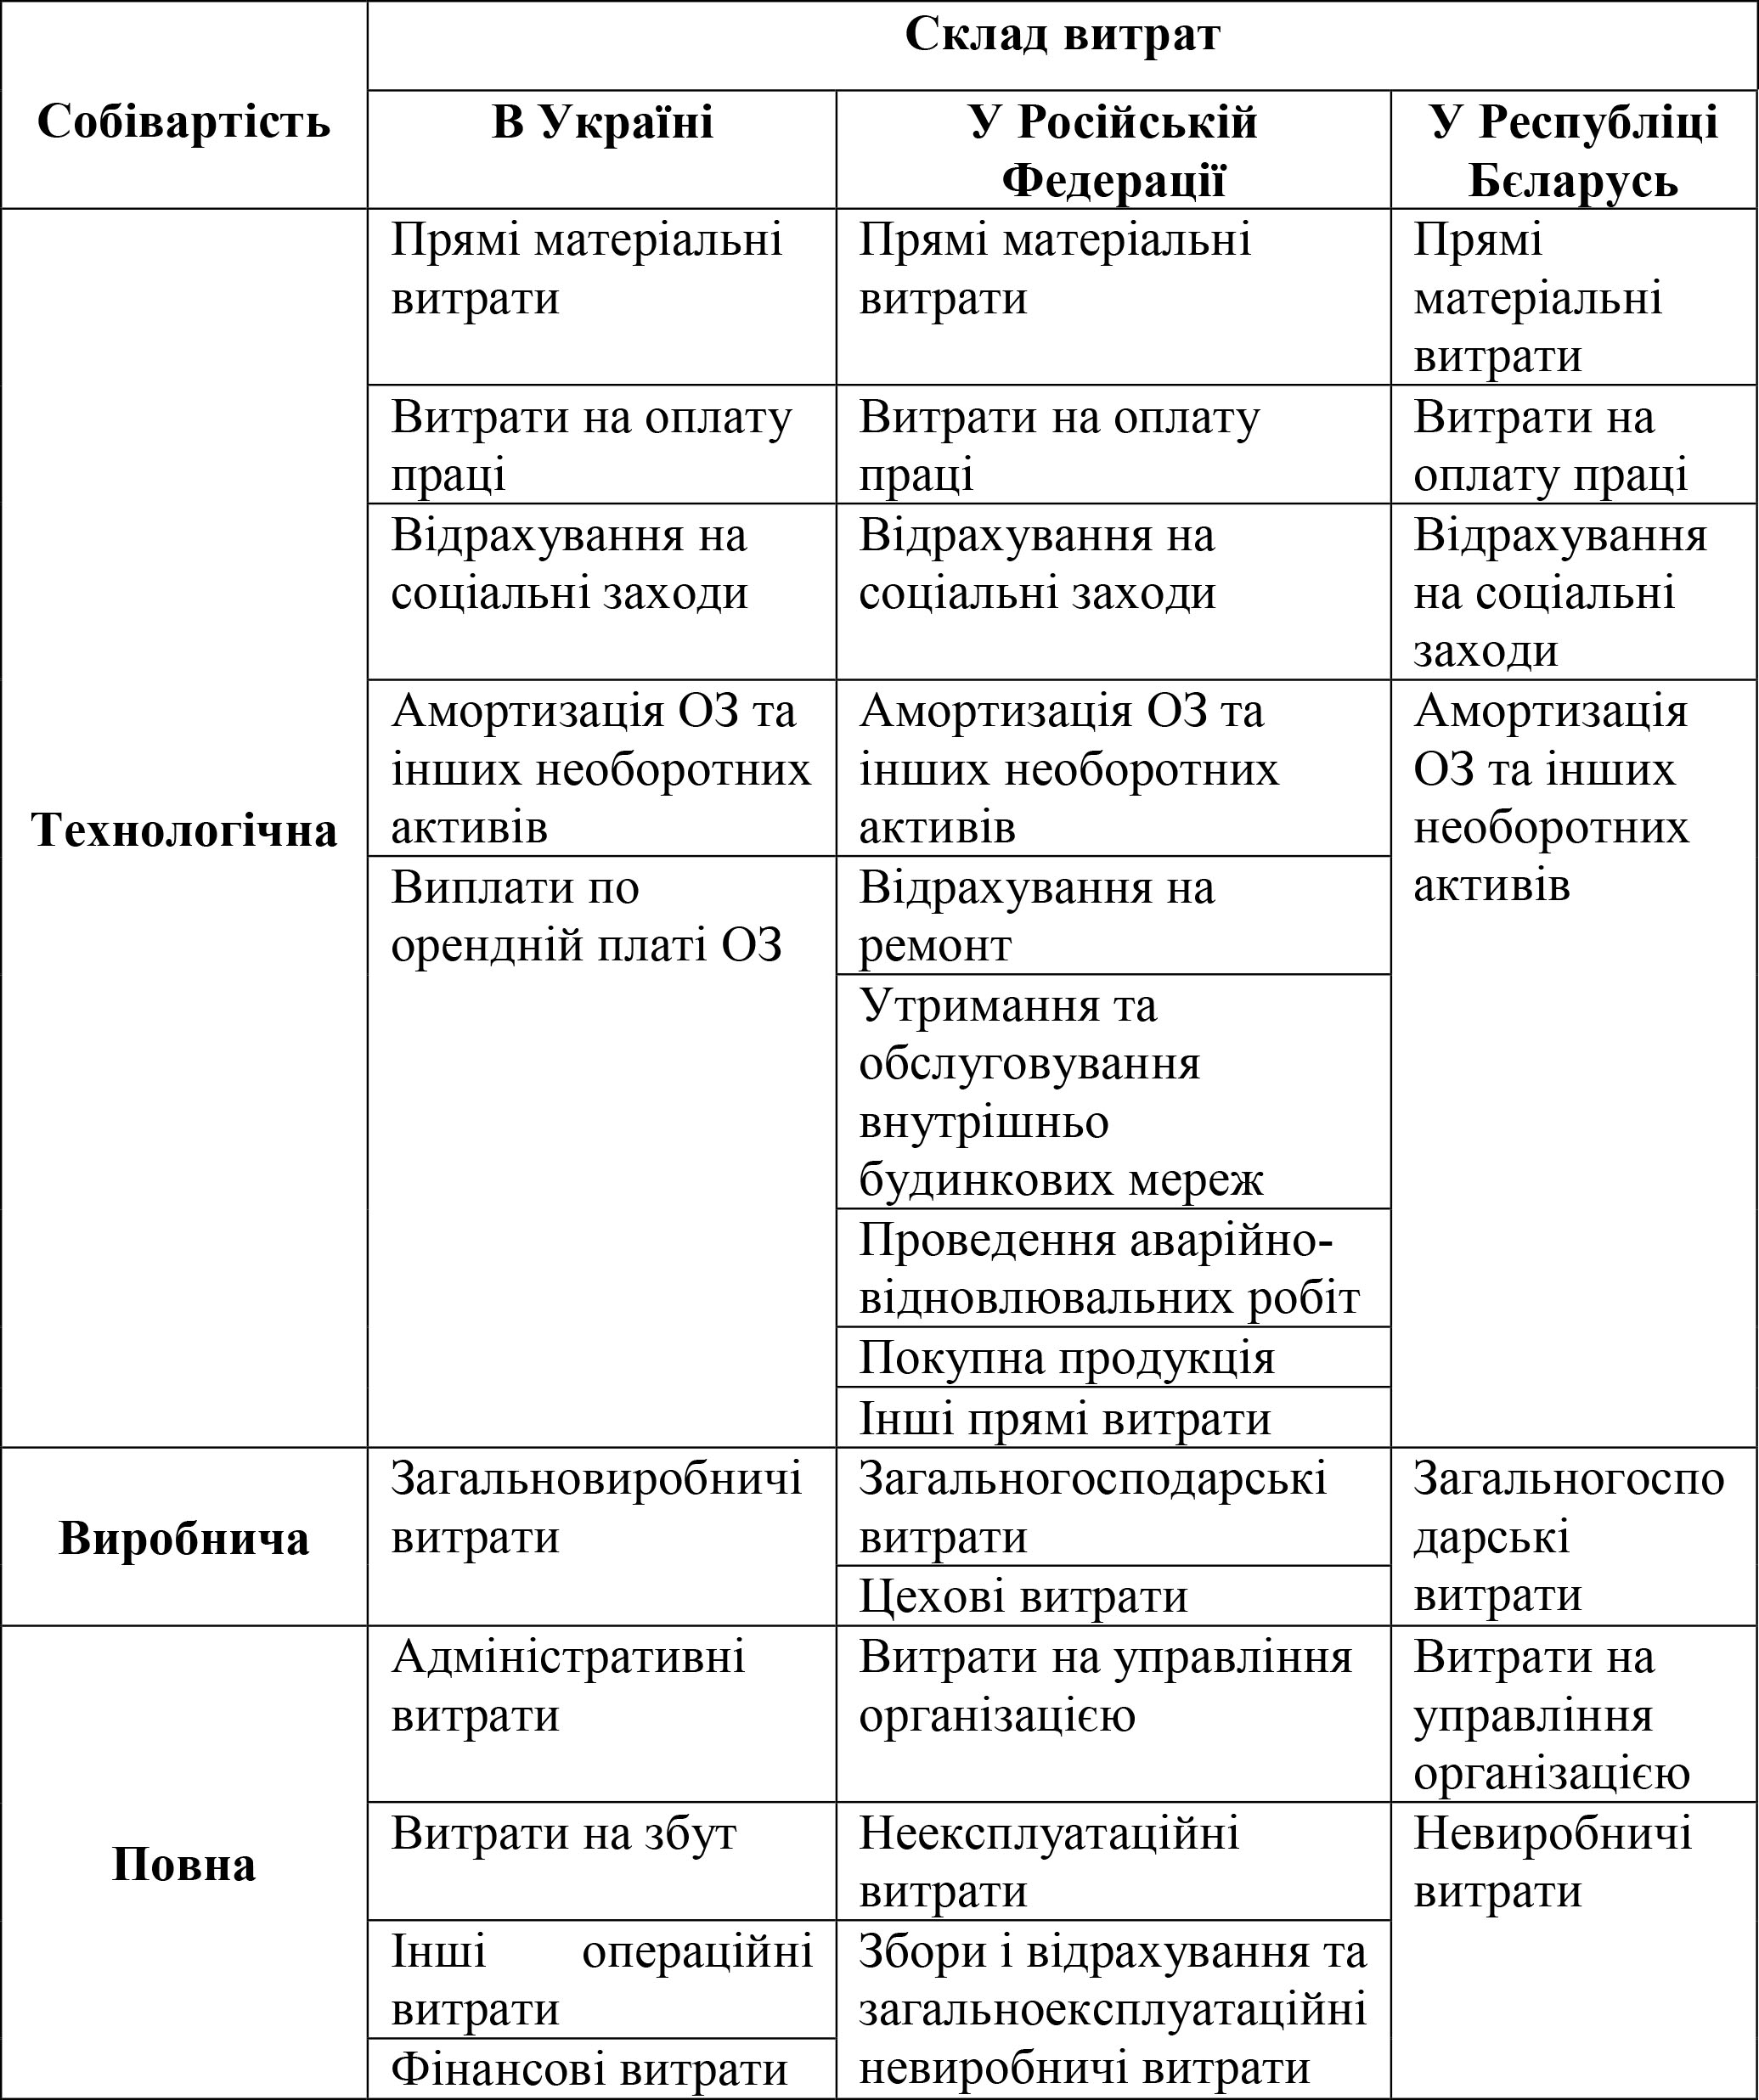
Fig. 1. Structural and comparative model of cost
The economic and legal aspect of planning is manifested in determining the type and amount of costs, profits and investment component. Structural and comparative model of cost, which is formed in Ukraine, in the Russian Federation, in the Republic of Belarus, which is shown in Figure 1, shows that:
— different types of cost according to the Russian method include some more types of costs than in Ukrainian and Belarussian;
— the production cost is almost the same by all methods, but in Russian also includes the costs of auxiliary workshops;
— full cost is described in more detail in the Ukrainian methodology, in addition to it it is possible to include also the financial costs associated with the repayment of credit obligations, which in the current state of shortage of working capital of heat supply companies, is necessary for their stable functioning;
— present in accordance with the Russian method the cost item as a part of the full cost, which is not included in it, but is reflected in the accounting documents: losses from downtime, damage to material assets while maintaining them at the central warehouses of organizations, when the damage cannot be recovered by the perpetrators, as well as non-production costs associated with compensation to employees of the injury, occupational disease or other health damage associated with the performance of their work responsibilities.
According to the analysis of the above methodological provisions, there is no single methodology that would allow analyzing the process of functioning of the planning system as an integrated, global superstructure with respect to its components. To solve this problem, we propose the use of a methodical approach developed by the author to analyze the formation of the planning system, which was developed on the basis of IDEF0 methodology.
IDEF0 methodology involves the construction of a hierarchical system of diagrams (decompositions), which are single descriptions of fragments of a master or context diagram. The contextual diagram, which is its own planning system, is described in terms of its relationship with the external environment. The next step is to perform functional decomposition, which results in decomposition diagrams that are subsystems of the planning system. After each stage of the decomposition, there is an opportunity to carry out an examination, which can involve all interested parties: subject matter experts, representatives of the interested party, analysts, employees of the functional and structural department involved in the development of this business process.
To implement this methodological approach to the analysis of the formation of the planning system, and considering that the research enterprise KP «KTM» is city-forming and is characterized by many and varied connections, both in the middle and outside, it becomes necessary to use modern computer technology and applications .
Based on the analysis of the software products, we can conclude that one of the best options for building a simulation model of the planning system for its further analysis, and the possibility of creating an automated management information system is to use the AllFusion Modeling Suite 7.1 software package. From this toolkit, we will use AllFusion Process Modeler 7.1 software, which allows us to build a functional-information model of a planning system in AS-IS format, that is, as it is today at the enterprise.
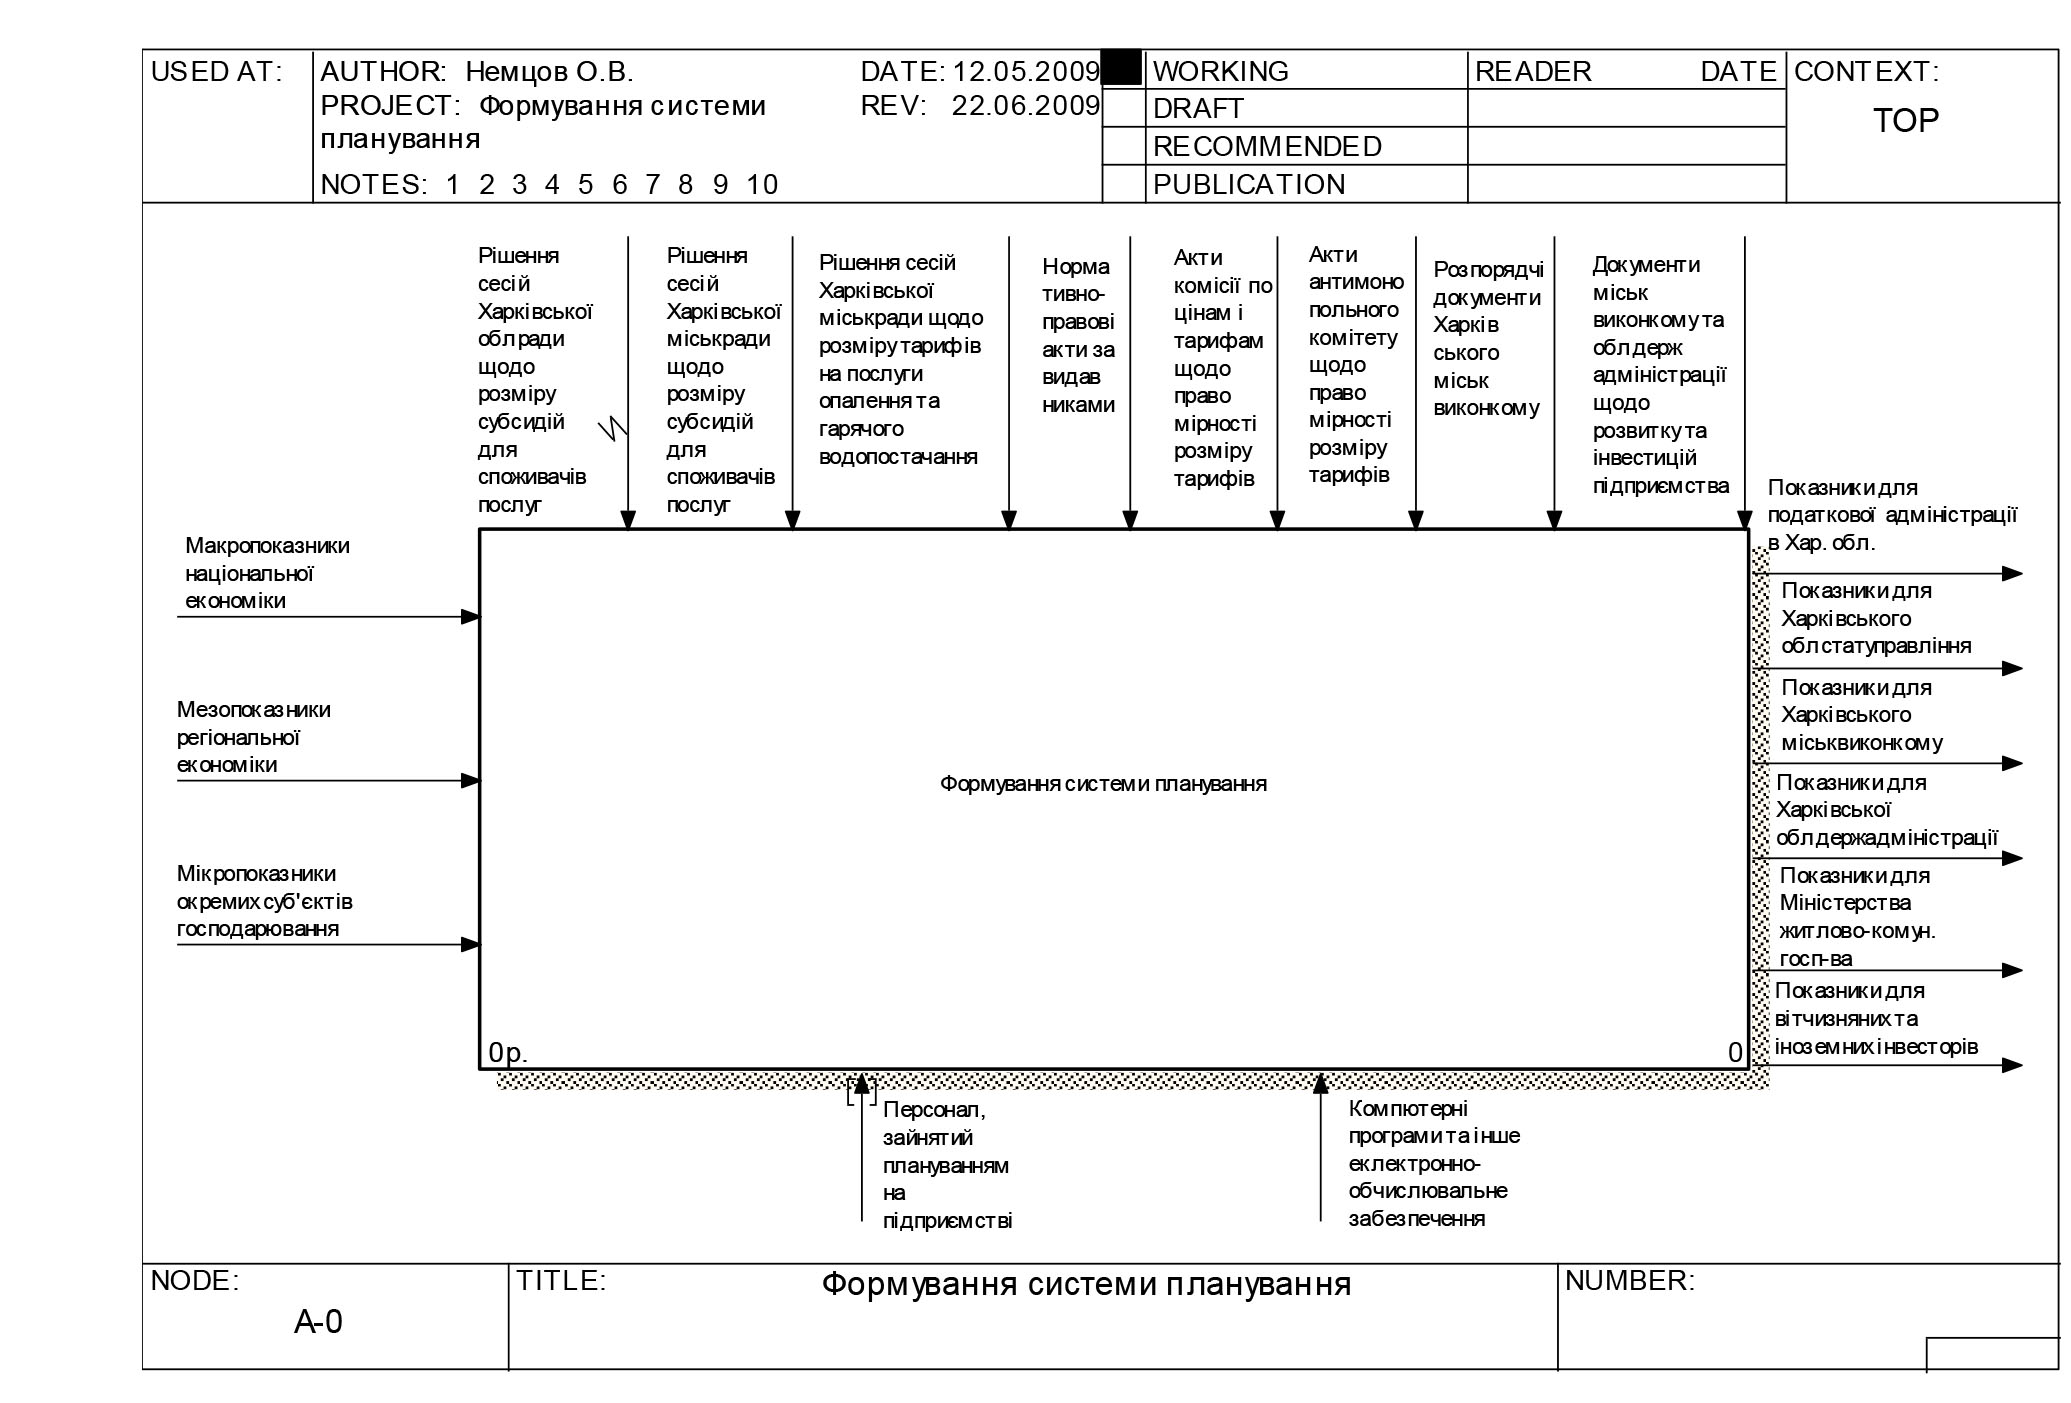
Fig. 2 Context diagram of the model of planning system formation at KTM enterprise
Figure 2 presents a contextual diagram of the model of the planning system formation, which graphically displays information about how the planning system of the KP «KTM» enterprise is formed.
Our planning system includes external information in the form of various macro-, meso- and micro-indicators, which is the basis for the formation of planning data of the enterprise.
The macro indicators reflect the state, dynamics and tendencies of the national economy of the country and are a guide for the development of strategic plans of the enterprise.
Mezzo indicators reflect the status, dynamics and tendencies of the Kharkiv region’s economy, are also taken into account in the development of strategic plans of the enterprise, but are directly related to tactical plans, especially in the context of increase or decrease of different groups of consumers of enterprise services: population, budget institutions, other enterprises, organizations, consumers .
Micro indicators show the status of individual entities, the dynamics and tendencies of their relations with KP «HTM»: relationships in terms of payment, terms, conditions of supply of raw materials, purchase of heat and electricity, etc., in payment for heat supply services to consumers (households, enterprises, institutions and organizations), in lending to the financial sector and commercial entities, in investing by domestic and foreign investors.
The process of forming the planning system of KTM KPM enterprise is mostly regulated by normative legal acts of various state and municipal authorities, controlling bodies and is under their direct control (control arrows indicate by what rules, strategies, procedures or standards the work is performed). Thus, the formation of the planning system at the enterprise is, first of all, influenced by the laws of Ukraine, the Cabinet of Ministers’ decrees, orders and orders of the State Committee on Public Utilities and Housing, that is, regulatory acts by publishers.
As one of the main generalizations of the enterprise is tariffs for heating and hot water services, the mechanism and procedure for planning these indicators play a significant role in the whole planned work of the enterprise, and their size is determined by the decision of Kharkiv Executive Committee.
However, before approving the tariffs for heating and hot water services by the members of the executive committee, these planned values are subject to examination and inspection by the state and the Supervisory Authorities of the State Pricing and Tariff Committee and the Antimonopoly Committee, which is formulated by the relevant acts on the legality of the tariff.
Based on the fact that KTM KTM is a city-forming enterprise engaged in the production and supply of strategic services for the region — heating and hot water — its activities, as well as its development, are subject to management and control by the executive, regional authorities — Kharkiv Executive Committee and Kharkiv regional state administration in the form of relevant programs, projects and other documents, which outline the ways of such development, sources of investment for its implementation. Such documents act as strategic guidelines for the enterprise we are investigating, on the basis of which a strategic plan for enterprise development and its reconstruction is formed.
In its activity, the enterprise is guided by the social aspect, that is, the services it provides are vital for their customers, regardless of the timeliness and completeness of their payment, especially in winter. Suspension of the operation of this enterprise can lead to severe social, economic, political and environmental consequences. Therefore, some refurbishment of boilers, transmission systems and thermal networks must take place, regardless of whether or not the company has the necessary funds for their implementation. In view of the significant role of KTM KTM, the regional legislatures are financing them for such activities in the form of subsidies. Another aspect of social character is that the investment component in tariffs for heating and hot water services for the population is paid to the enterprise at the expense of the same subsidies of local and regional budgets, that is, the population pays only the cost of production and supply of these services. Thus, when planning an enterprise, the size of subsidies, which are determined by the relevant decisions of sessions of the Kharkiv Regional Council of Deputies and Kharkiv City Council of Deputies, are of significant importance.
In its day-to-day activities, the enterprise is accountable to the Department of Housing and Communal Services of the Kharkiv City Executive Committee and is guided by its administrative documents, which affect the operational activities of the enterprise, and therefore the content of its operational plans.
All the work involved in building the scheduling system is done by the planning staff at the enterprise and using computer programs and other electronic computing software (in the context diagram, the arrows of the mechanism are shown in square brackets, indicating that they are tunneling, ie used in all the works of our model).
To the personnel engaged in planning at the enterprise, we, first of all, include employees of the planning and economic service, who directly carry out all stages of the planning process at the enterprise. However, all branches, departments and services of the enterprise are involved in the planning process at the stage of primary data formation. It should be said that such participation in the planning is passive in nature, that is, the plans formed at the top in the form of task plans for branches, other administrative and attribution documents for services and departments are descended from the planning and economic service for execution by other departments of the enterprise. Thus, the latter do not participate in the planning process at the stage of primary data processing and the subsequent formation of planning tasks.
However, there are also several branches, services, and departments that are partially involved in the planning process at the planning stage in the form of submitting various business proposals to the planning and economic service, where the latter are processed, analyzed and returned to these units in the form of prepared planning documents. and distributed to specific consumers across the enterprise. The following branches, services and departments include the following: accounting department, information and technical center, logistics department, production and technical service, information technology and communication service, repair service, personnel department, repair and reconstruction department, district branches of heat supply, branch of Kharkovteplozbut, transport branch, centralized emergency dispatching service.
The formation of the enterprise planning system is contained in the processing, evaluation, analysis of input information flows, which are expressed in qualitative and quantitative indicators, and the development of new qualitative and quantitative indicators that become output information flows. Thus, working with such a large information array requires automation, which is achieved through computer programs and other electronic computing software. For example, the accounting department uses a specialized program for accounting 1C: Enterprise, planned and economic service with the help of a specialized program developed by specialists of the information technology and communication service, calculates the planned volumes of heat production for the production and supply of heating and water heating services . Some metrics are calculated using Excel programs (such as the Calculator) in Excel, and further descriptions and qualitative metrics are performed in Word, Word Pad, Power Point, Info Patch, Publisher, and more. The storage and subsequent use of certain documentary information is accomplished through the Access database storage program.
The output for work on the formation of the planning system is a variety of information in the form of certain quantitative and qualitative indicators for external users. The main users of the planned information of the KTM KPM enterprise are the Tax Administration in Kharkiv region, Kharkiv regional statistics department, Kharkiv city executive committee, Kharkiv regional state administration, State Committee on Public Utilities and Housing of Ukraine, domestic and foreign investors.
All the work that happens in the construction of the planning system can be divided into the following fragments: forming a methodological basis for planning various processes, generating various information data, forming a plan of work and activities for the next year to the program of development of the district heating system of Kharkiv, forming a financial plan for the next year , forming monthly task plans for branches, services and departments of the enterprise. Figure 3 shows the decomposition diagram of the context diagram of the planning system.
A very important aspect in the formation of the planning system is the analysis of the enterprise plan system, as the plans provide the final and final form of the process of forming the planning system.
The well-known methodical approach to the assessment of any plan in the enterprise, which involves a comparison of planned and actual values of indicators, does not accurately reflect the results of the planned activity, since the actual values of the indicators are the result of the entire management process, not just planning. Therefore, the author proposed such a methodical approach to the evaluation of the plan system, which focuses on the assessment of the degree of integration of the set of plans into a whole, their interdependent and interdependent device, consistent with the interactive concept of planning.
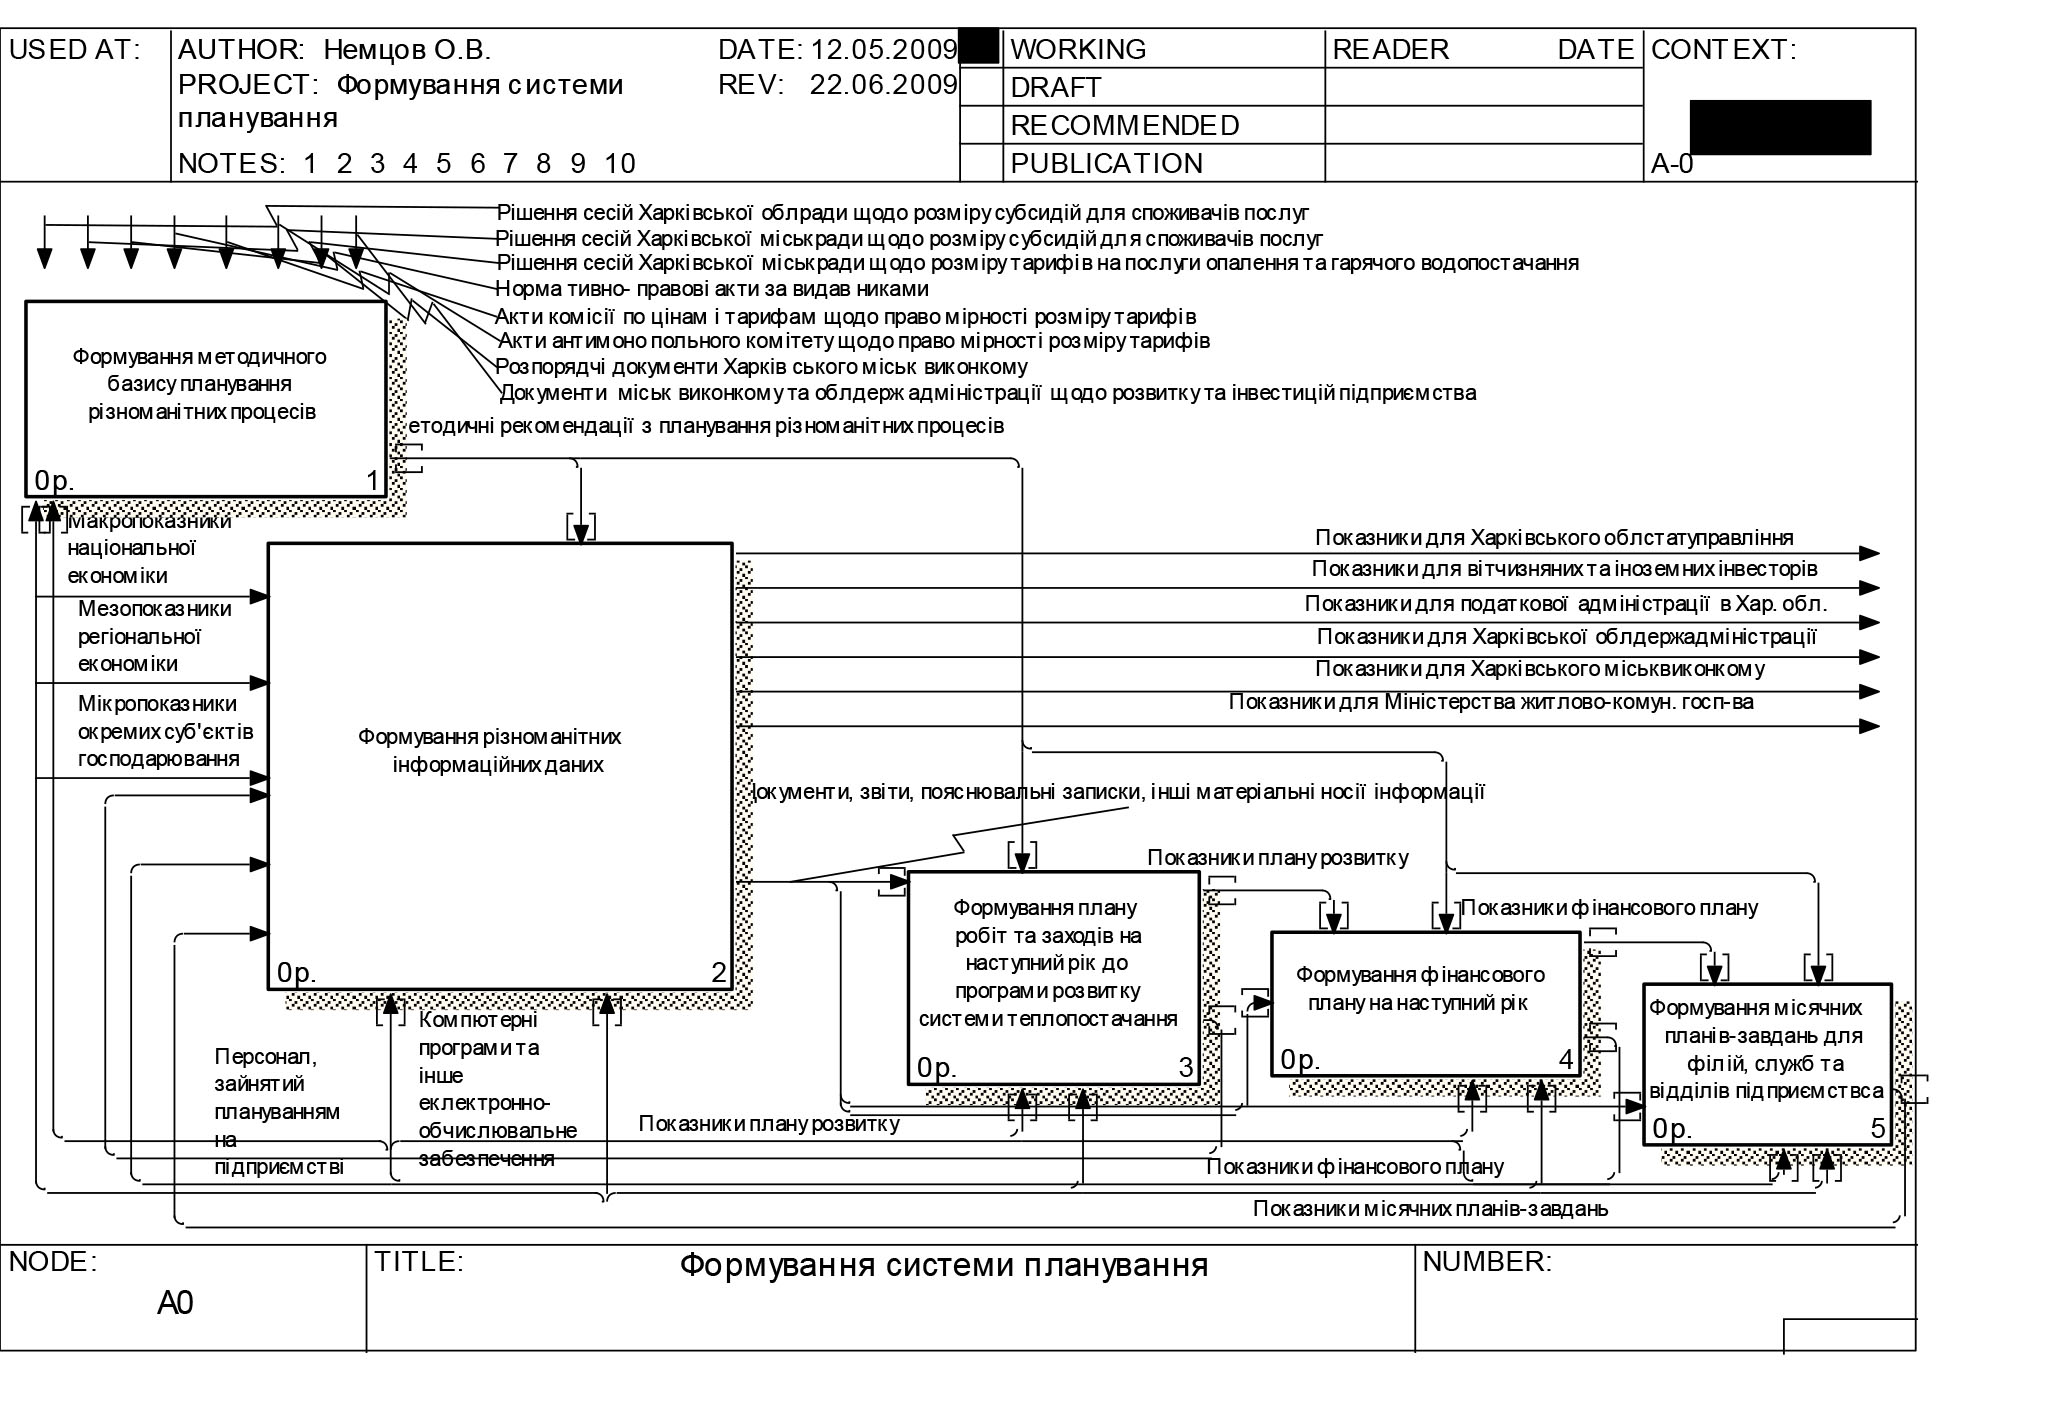
Fig. 3 Decomposition diagram of the context diagram of formation of planning system at KTM enterprise
The system of plans of the enterprise KP «Kharkiv Thermal Networks» is a set of all plans used by the enterprise to display the planned information in clear, concise, logical and concrete forms. Among the plans of the company are the following: the plan of work and activities for the next year in the program of development of the heat supply system, the financial plan for the next year and an explanatory note thereto, monthly plans for the branches, services and departments of the enterprise. The specific elements of the enterprise plans system are various development programs: «Program of reforming the district heating system in Kharkiv to maximize the use of heat produced by JSC» Kharkiv CHP-5 «,» Feasibility study for improving the efficiency of district heating.
All these planning documents can be conditionally divided according to the level of tasks that are assigned to each of them: strategic, tactical, operational. Strategic plans include by far all the programs and work plans and activities planned for next year listed in the heat supply development program, tactical plans include the financial plan for the following year and explanatory note to it, and operational — monthly plans for branches, services and departments of the enterprise. According to functional areas, these planning documents are not distributed. More meaningful distribution is acquired by these plans by the level of enterprise management, although it is also possible to distribute these plans by the planning horizon, by stage of development, by the degree of detail, by the possibility of changes, etc. By the level of enterprise management you can distinguish plans,
Analyzing the Program of development of the Kharkov District Heating Utilities Company until 2015, which we have referred to the strategic plans of the enterprise, we can say that only the directions of development have been worked out, but there is no priority and priority of their implementation, a logical connection between their implementation ( that is, the implementation of one event has a certain economic effect in the form of additional opportunities that can be used to implement other measures, with the amount of investment attracted will be less by the corresponding amount economic effect).
The researches of other strategic planning documents of the enterprise of KP «KTM» make it possible to conclude that the majority of the measures and works done in them, which are expressed in specific indicators, are carried out chaotically, haphazardly, there is no complex nature of their implementation and accordingly a synergistic effect. Such a situation does not allow to achieve in full the results (economic effect) defined in these strategic documents, and accordingly to reduce the costs and cost of services, which will either reduce the tariff or release some funds that can be directed for further modernization and reconstruction of fixed assets.
The financial plan, which is tactical in nature, consists of large indicators of the enterprise and deciphering its most important elements: administrative expenses, sales expenses, elements of operating expenses, capital investments, cash flow. The explanatory note to him comes in the form of information in the financial plan and consists of the following sections: information about the enterprise, information about the business enterprise, information on the loans of the enterprise, expenses for maintenance of transport, information about planned investments and other additional information. The unit of other additional information, in turn, consists of the main indicators of production, the calculation of energy costs, the planned cost estimate,
Other additional information to the financial plan is intended to clarify and explain some indicators of the financial plan, in which it presents a group of natural and cost indicators that are weighted and should be reflected in the production plan (the amount of heat produced in Gcal), in procurement plans (volume of gas purchases by consumers of services in thousand m 3 , volume of purchases of electricity in thousand kW * g, chemical reagents in UAH, water in thousand m 3), in terms of cost and profit (gas purchase costs in UAH, electricity purchase costs in UAH, water costs in UAH, costs of chemical reagents in UAH, costs of repairs at the cost of UAH. , depreciation in UAH, the cost of 1 Gcal in UAH, tariffs for district heating and hot water services by consumer groups in UAH), in terms of sales (volume of sales of heat by consumers in Gcal, income from the sale of heat for consumers in UAH), in terms of investment and (capital investment by type of fixed assets in UAH). All of these indicators are primary to the financial plan indicators because they determine the size of the financial plan indicators.
The financial plan we have analyzed and the explanatory note to it give us an opportunity to point out that this plan has a weak link with the «Kharkiv Thermal Networks Utility Development Program 2015» and the 2011 Robots and Activities Plan to the Utility Development Program the enterprises of Kharkiv Thermal Networks till 2015, the indicators indicated therein are finite, ie those that characterize the overall final activity of the enterprise, which makes it impossible to trace the process of formation of these indicators, indicators provided in the primary explanatory note to the financial plan did not fully disclose the formation of final figures, indeed their planning process, too, in our view, should be changed in the part of determination of volumes of realization of thermal energy from which all other indicators are then formed. The information presented in the financial plan and explanatory note is largely duplicated, or there is no logical connection with other information, which complicates the perception and understanding of the information.
The operational nature of the plans is inherent in the monthly plans-tasks, the purpose of which is to directly regulate the work of the enterprise on the specified indicators, which are the benchmarks in the process of its implementation. Some indicators of plan-tasks are formed by calendar months by the breakdown of the corresponding annual financial plan, which, as noted above, is distributed further by quarter. Other indicators are taken from the explanatory note to the financial plan, including natural ones, which reflect the production of services and the resources required for this purpose. However, there are indicators that come from internal company documents, such as runoff of domestic and process water in thousand m 3 .
The procedure for the formation of monthly plans-tasks is slightly different from the planning of other types of plans at the enterprise. These monthly plans show these types of metrics as adjusted targets. Since all indicators are initially planned based on the data on the amount of heat produced in the past year, they are not very accurate, so in shorter time periods it is possible to more accurately determine this amount of heat due to the knowledge of such an indicator as the average ambient air temperature. for the previous month, which is forecast by the meteorological center of Kharkiv.
There is a relationship between the indicators used in the monthly task plans, which is expressed by simple mathematical calculations between the resultant and factor indicators. There is a certain relationship between the financial plan indicators and the explanatory note to it and the monthly plan-tasks, which is expressed by the fact that the sum of 12 indicators for each indicator must correspond to the value of this indicator for the year. The indicators planned in the monthly plan-tasks correspond to the indicators of the financial plan, except for the indicators of overhead costs and sales costs, which is explained by incomplete reflection of these costs at other branches, services and departments of the enterprise. The indicators for the reconstruction, modernization and restoration of the fixed assets of KP «KTM», indicated in the strategic,
Conclusions. Based on the analysis of the methodological provisions for planning the activity of district heating companies in Ukraine, the Russian Federation and the Republic of Belarus, it was found that the methodology for planning the activity of district heating companies in Ukraine solves the purely legal, partially fiscal aspects of the planned activity of the enterprise.
All indicators used in drawing up the plans of the heat supply companies are absolute, and their norms and norms are calculated by the respective branch ministries and departments, which makes it impossible for the enterprise to manage its activities flexibly. Approval of the plans goes through several stages, namely approval by the antitrust committee, approval by the state commission on prices and tariffs (the first two steps apply only if new tariffs for the services of the enterprise are approved), approval by the relevant regional department of economy, approval by the department of local councils . All this leads to the presence of a large number of documents, the same indicators, but grouped by another, that is, planning at such enterprises performs basically a controlling function. Performance, development and investment indicators are not sufficiently taken into account in the regulatory and methodological documents of Ukraine. It is important to resolve the issue of interpretation of the investment component and profit, since the identification of these concepts leads to the impossibility of directing profits to other areas, including material incentives for employees, payment of bonuses, social programs, in addition to the reconstruction, modernization and restoration of fixed assets of the enterprise.
Using a methodical approach to the analysis of the planning system, an assessment of the planning system was performed, which revealed that the overall process of forming a planning system in the enterprise under study is consistent with the logic of creating and operating planning systems, but does not take into account many current trends and innovations in this field.
Therefore, the mechanism of implementation of the planning system, on the basis of which the methodology of forming the planning system should be formed and its basic principles, should not be sufficiently illuminated. The technique does not sufficiently describe the process of formation of planning system at the enterprise, but only touches on some aspects of it.
The information system does not correspond to the modern idea of such systems: weak automation of administrative processes and lack of coordination within the computer system of work performed at the enterprise.
There is no clearly spelled out information about the staffing system of the formation of the planning system, although the staff themselves are the main mechanism that converts the input information to the output, implements planning decisions, analyzes and corrects them.
Legal, organizational, scientific and research processes within the enterprise are not well described within their planning aspect, although it is not possible to carry out the planning process only within one planning and economic service.
The processes of strategic, tactical and operational planning are not defined at all, they only exist within the framework of the unwritten tradition that has developed in the sphere of planning at this enterprise, orally at the level of the subconscious mind of the planning specialists.
The developed methodical approach to the assessment of the system of plans of the enterprise made it possible to identify weak links between strategic, tactical and operational plans, imbalance, incompleteness of the planned indicators contained in them. Indicators used in these plans are not always responsible for each other’s morphological features, that is, some indicators used in strategic plans in the form of long-term objectives are absent in tactical financial plans and operational plans, respectively, in the form of medium and short-term objectives, in in turn, not all financial plan indicators are in plan plans, and financial plans do not have some plan plans indicators. However, in essence, the nomenclature of indicators of these planning documents should, for the most part, be consistent with each other, since the logic behind the construction of these indicators implies that
literature
- I. Ansoff. Strategic management. / Igor Ansoff — M .: Economics, 1989 .— 304 p.
- R.Ackoff. Planning for the future of a corporation. / Ackoff Ronald — M .: Progress, 1985 .— 328 s.
- G. Benveniste. Mastering the planning policy. [Trans. from English / under. ed. Kalantarova] / Guy Benveniste — M: “Progress” “Univers” — 1994 — 304 p.
- Bad E.B. Development of methodological approaches to the formation of the planning system at the enterprise / Elena Borisovna Bad // Economy: problems and theory of practice. — Dnipropetrovsk: DNU, 2001. — VIP. 117.- S. 132 — 134.
- Bad EB Analysis and Evaluation of the Effectiveness of the Functioning of the Planning System / Elena Pooraya // Economics: Problems of Theory and Practice. — Dnepropetrovsk: DNU, 2002. — Vyp. 139. — P. 78 — 82.
- Bad E.B. The sequence of the implementation of the planning process / Elena Borisovna Bad // // Economic development. — 2002 — No. 4 (24). — S. 91 — 93.
- Dyulle P. Marketing management and strategy. 3rd edition [Transl. From English / edited by Yu.N. Kapturevsky] / Peter Dyul — St. Petersburg: Peter, 2002. — 544 p.
- Order of the Ministry of Economy of Ukraine No. 67 dated 08.09.00 «On approval of the Procedure for providing conclusions on the calculations of economically justified planned expenditures for services of centralized water supply and drainage, production, transportation, supply of heat, services for centralized heating and hot water supply» [Electronic resource] / Site access mode: http://www.rada.gov.ua/zakon/new/karta.htm
- Order of the State Committee for Construction, Architecture and Housing Policy of Ukraine No. 47 of 06.03.2002 «On approval of Methodological recommendations for planning, accounting and costing of enterprises and organizations of housing and communal services» [Electronic resource] / Access mode to the site: http://www.rada.gov.ua/zakon/new/karta.htm
- Order of the State Committee for Construction, Architecture and Housing Policy of Ukraine No. 191 of 08.09.00, “On approval of the Rules of calculation of the two-part tariff for thermal energy and hot water”: [Electronic resource] / Site access mode: http: //www.rada .gov.ua / law / new / map.htm
- Resolution of the Cabinet of Ministers of Ukraine No. 955 of July 10, 2006 “On approving the Procedure for setting tariffs for production, transportation, supply of heat energy and services for district heating and hot water supply” [Electronic resource] / Site access mode: www.radagov.ua .
- Order of the State Committee of Ukraine for Energy Supply No. 46 of May 7, 01, “On Approval of Inter-sectoral Standards of Costs for Heating Boilers Operated in Ukraine”: [Electronic resource] / Site Access Mode: http://www.rada.gov .ua / law / new / map.htm
- Order of the State Committee of Ukraine for Energy Supply 112 of 10/22/02 «On approval of the Main provisions for the standardization of specific costs of fuel and energy resources in public production» [Electronic resource] / Site access mode: http://www.rada.gov. ua / law / new / map.htm
- Order of the State Committee for Public Utility Services of Ukraine No. 118 of June 24, 2004 “On Approval of the Instruction on the Application of Resource Elemental Estimates for Works on Repair of Equipment and Equipment Performed at Housing and Communal Services” [Electronic resource] / Site access mode: http://www.rada.gov.ua/zakon/new/karta.htm
- KTM 204 Ukraine 244-94 [Electronic resource] / Site access mode: http://www.rada.gov.ua/zakon/new/karta.htm
- KTM 204 Ukraine 246-99 [Electronic resource] / Site access mode: http://www.rada.gov.ua/zakon/new/karta.htm
- DKN 02.07.2004 [Electronic resource] / Site access mode: / http://www.rada.gov.ua/zakon/new/karta.htm
- GKN 04.07.027-2006 [Electronic resource] / Site access mode: http://www.rada.gov.ua/zakon/new/karta.htm
- Resolution of the Gosstroy of Russia dated December 4, 2002 “Methodology for planning, accounting and calculating the cost of housing and communal services” [Electronic resource] / Access mode to the website: http://www.lawrussia.ru/bigtexts/law_1861/index.htm
- Decree of the Ministry of Economy of the Republic of Belarus of 10.09.2003 No. 183 “On approval of the procedure for the formation and application of prices and tariffs” [Electronic resource] / Access mode to the website: http://www.pravo.by/
- Order of the Ministry of Housing and Communal Services of the Republic of Belarus dated November 12, 1999 No. 160 “On approval of guidelines for accounting for production costs and costing at housing and communal services” [Electronic resource] / Access mode to the site: http: // www. pravo.by/
- Decree of the Council of Ministers of the Republic of Belarus dated January 18, 2006 No. 54. “On approval of the provisions on the procedure for the formation of planned and estimated prices for housing and communal services and on the procedure for bringing the relevant financial and economic indicators to the housing and utilities sector and monitoring their implementation” [Electronic resource] / Access mode to the site: http://www.pravo.by/
- Appendix to the Decree of the Ministry of Economy of the Republic of Belarus dated 10.09.2008 No. 183 “Instruction on the Procedure for the Formation and Application of Prices and Tariffs”. [Electronic resource] / Access mode to the site: http://www.pravo.by/
- Decree of the Council of Ministers of the Republic of Belarus of July 20, 2005 No. 799 “On the Concept of Pricing in the Republic of Belarus” [Electronic resource] / Access mode to the website: http://www.pravo.by/
MAIN CHARACTERISTICS OF ECONOMIC ACTIVITY OF MUNICIPAL UTILITIES IN UKRAINE’S HEAT SUPPLY
The MAIN CHARACTERISTICS OF ECONOMIC ACTIVITIES OF THE MUNICIPAL HEAT SUPPLY ENTERPRISES IN UKRAINE was
published in 2013 — X: Energy Saving. Energy. Energy audit. — 2013 — P. 61 — 72. © Nemtsov OV
Abstract. The types of economic activity that carry out the enterprise heat supply are considered, the main results of the work of the enterprises and the problems arising during the activity have explored, the ways of their solution have been determined.
The main economic activity of municipal utilities is the supply of heat for heating and hot water supply for domestic and industrial needs of economic entities, budget organizations, other institutions and organizations and the population. Moreover, the scope of this activity also includes the production and transportation of these services. We can say that these companies operate in the same scheme as 20, 30, 50 years ago, that is, the scheme of economic relations formed in the time of the USSR. In general, such separation of activities — production, transportation, sales — was introduced at similar enterprises recently — about 10 years ago. This was a consequence of the ongoing reform aimed at creating a market for housing and utilities, including heating. Within the framework of this process it was envisaged that enterprises would be formed that would specialize only in the production of these services, or only in their transportation, or only in their implementation, as a result of which the consumer would be able to choose the provider of the above services. However, the technical complications of the implementation of this measure, as well as the considerable uncertainty of the consequences of this, slowed him down. It should also take into account Russia’s negative experience in this matter, which resulted in a simple tariff increase and the transfer of monopoly status from the state and local territorial communities to affiliated private entities. For the most part, district heating utilities have the right to engage in a large number of additional economic activities, including the provision of financial services. Although, all is one thing, most often they perform network maintenance, emergency management, meter installation and calibration services. Investigation of the main results of the activity of the utility companies of heat supply will give an opportunity to identify «bottlenecks» of their functioning, to identify the sources that created them and to take appropriate measures for their elimination.
Many works of foreign and even more scientific achievements of domestic scientists, researchers, experts in this field are devoted to the research of various aspects of activity of public utilities, in particular heat supply enterprises: B. Ved, S. Werner, D. Kannolli, H. Land, B. Moller, S. Nilesen, D. Nilsson, M. Paul, D. Trayer, L.N. Amjadin, V.M. Amitan, A.I. Anfertyeva, V.M. Babayev, L.P. Belykh, P.P. Bezrukiv, VV Buzeryev, V.V. Virchenko, VB Veselovsky, V.S. Vinichenko, O.G. Voronin, I.M. Gurchikova, AS Goncharuk, V.H. Far away. However, this issue requires constant updating and increased attention from all stakeholders, many of them: the state, municipalities, ecologists, public organizations, international environmental, social and social organizations, economic entities, other institutions, households, etc.
The purpose of this article is to provide up-to-date information on the main problems of activity of heat supply companies for today, to identify the sources that have formed them and to provide appropriate recommendations for their elimination.
The share of heat supply enterprises of Kharkiv, Donetsk, Dnipropetrovsk, Odessa, Lviv oblasts and the city of Kyiv in the country by main production and financial indicators is presented in Table 1.
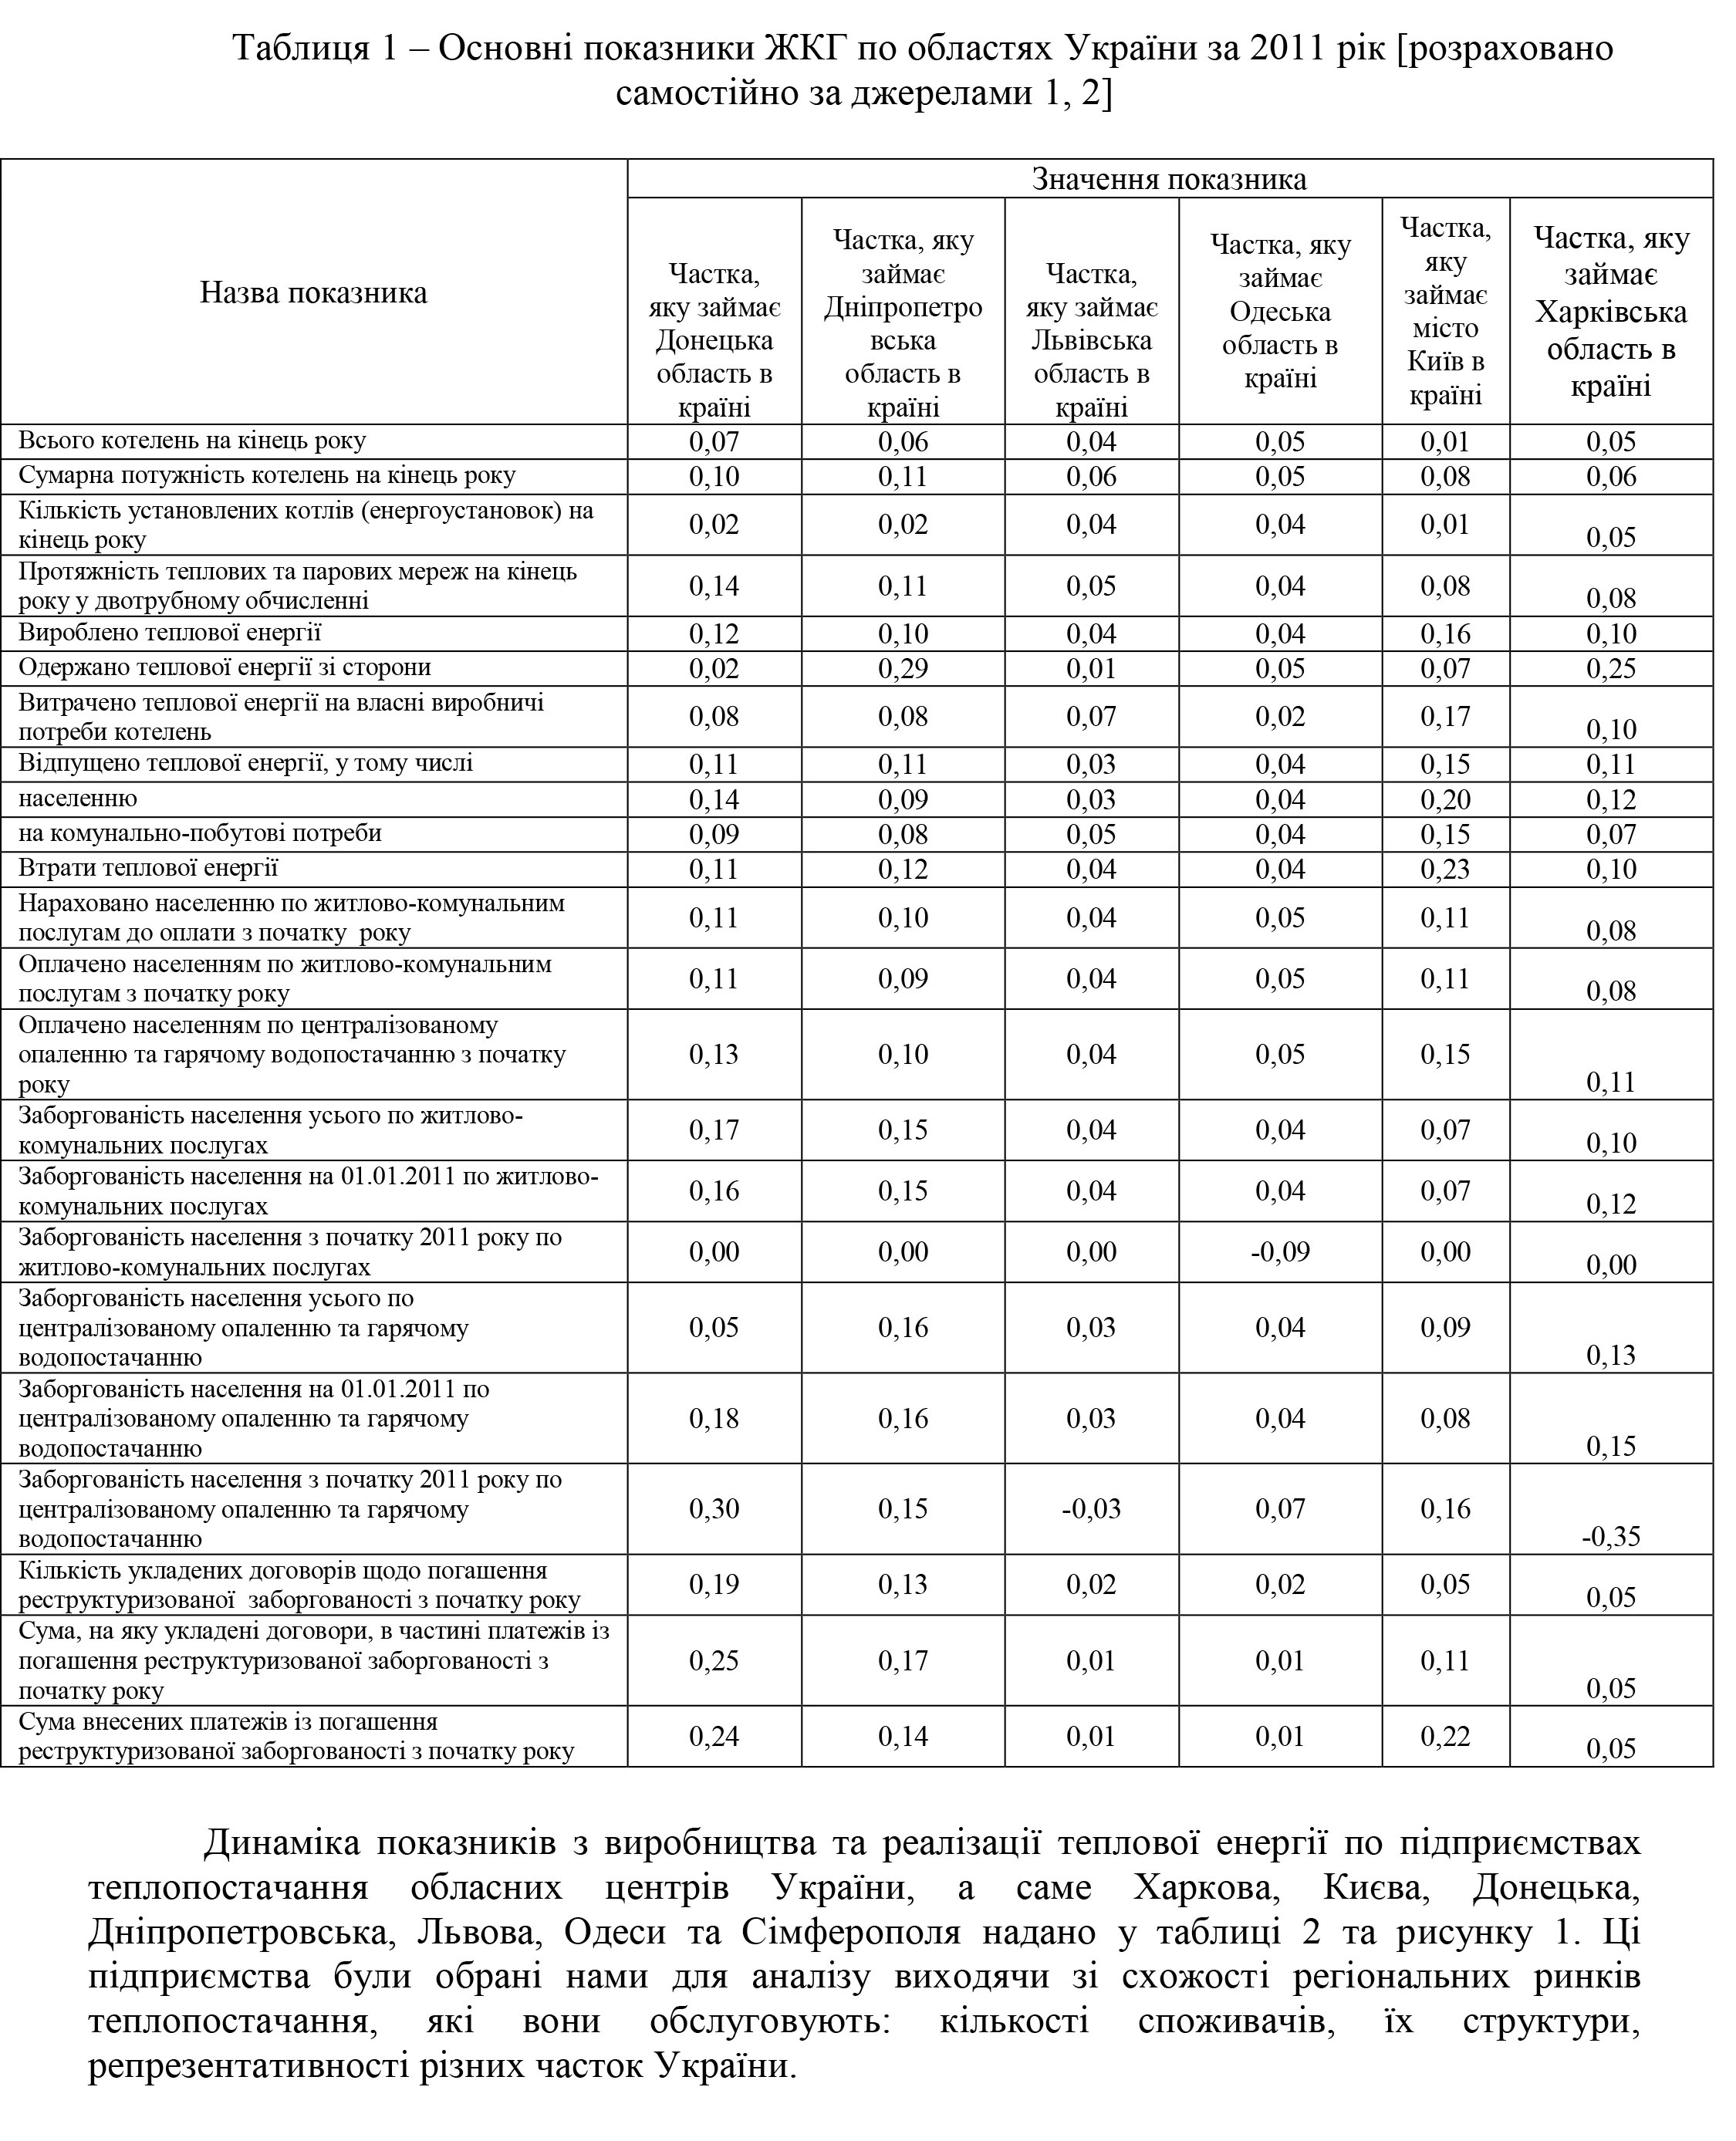
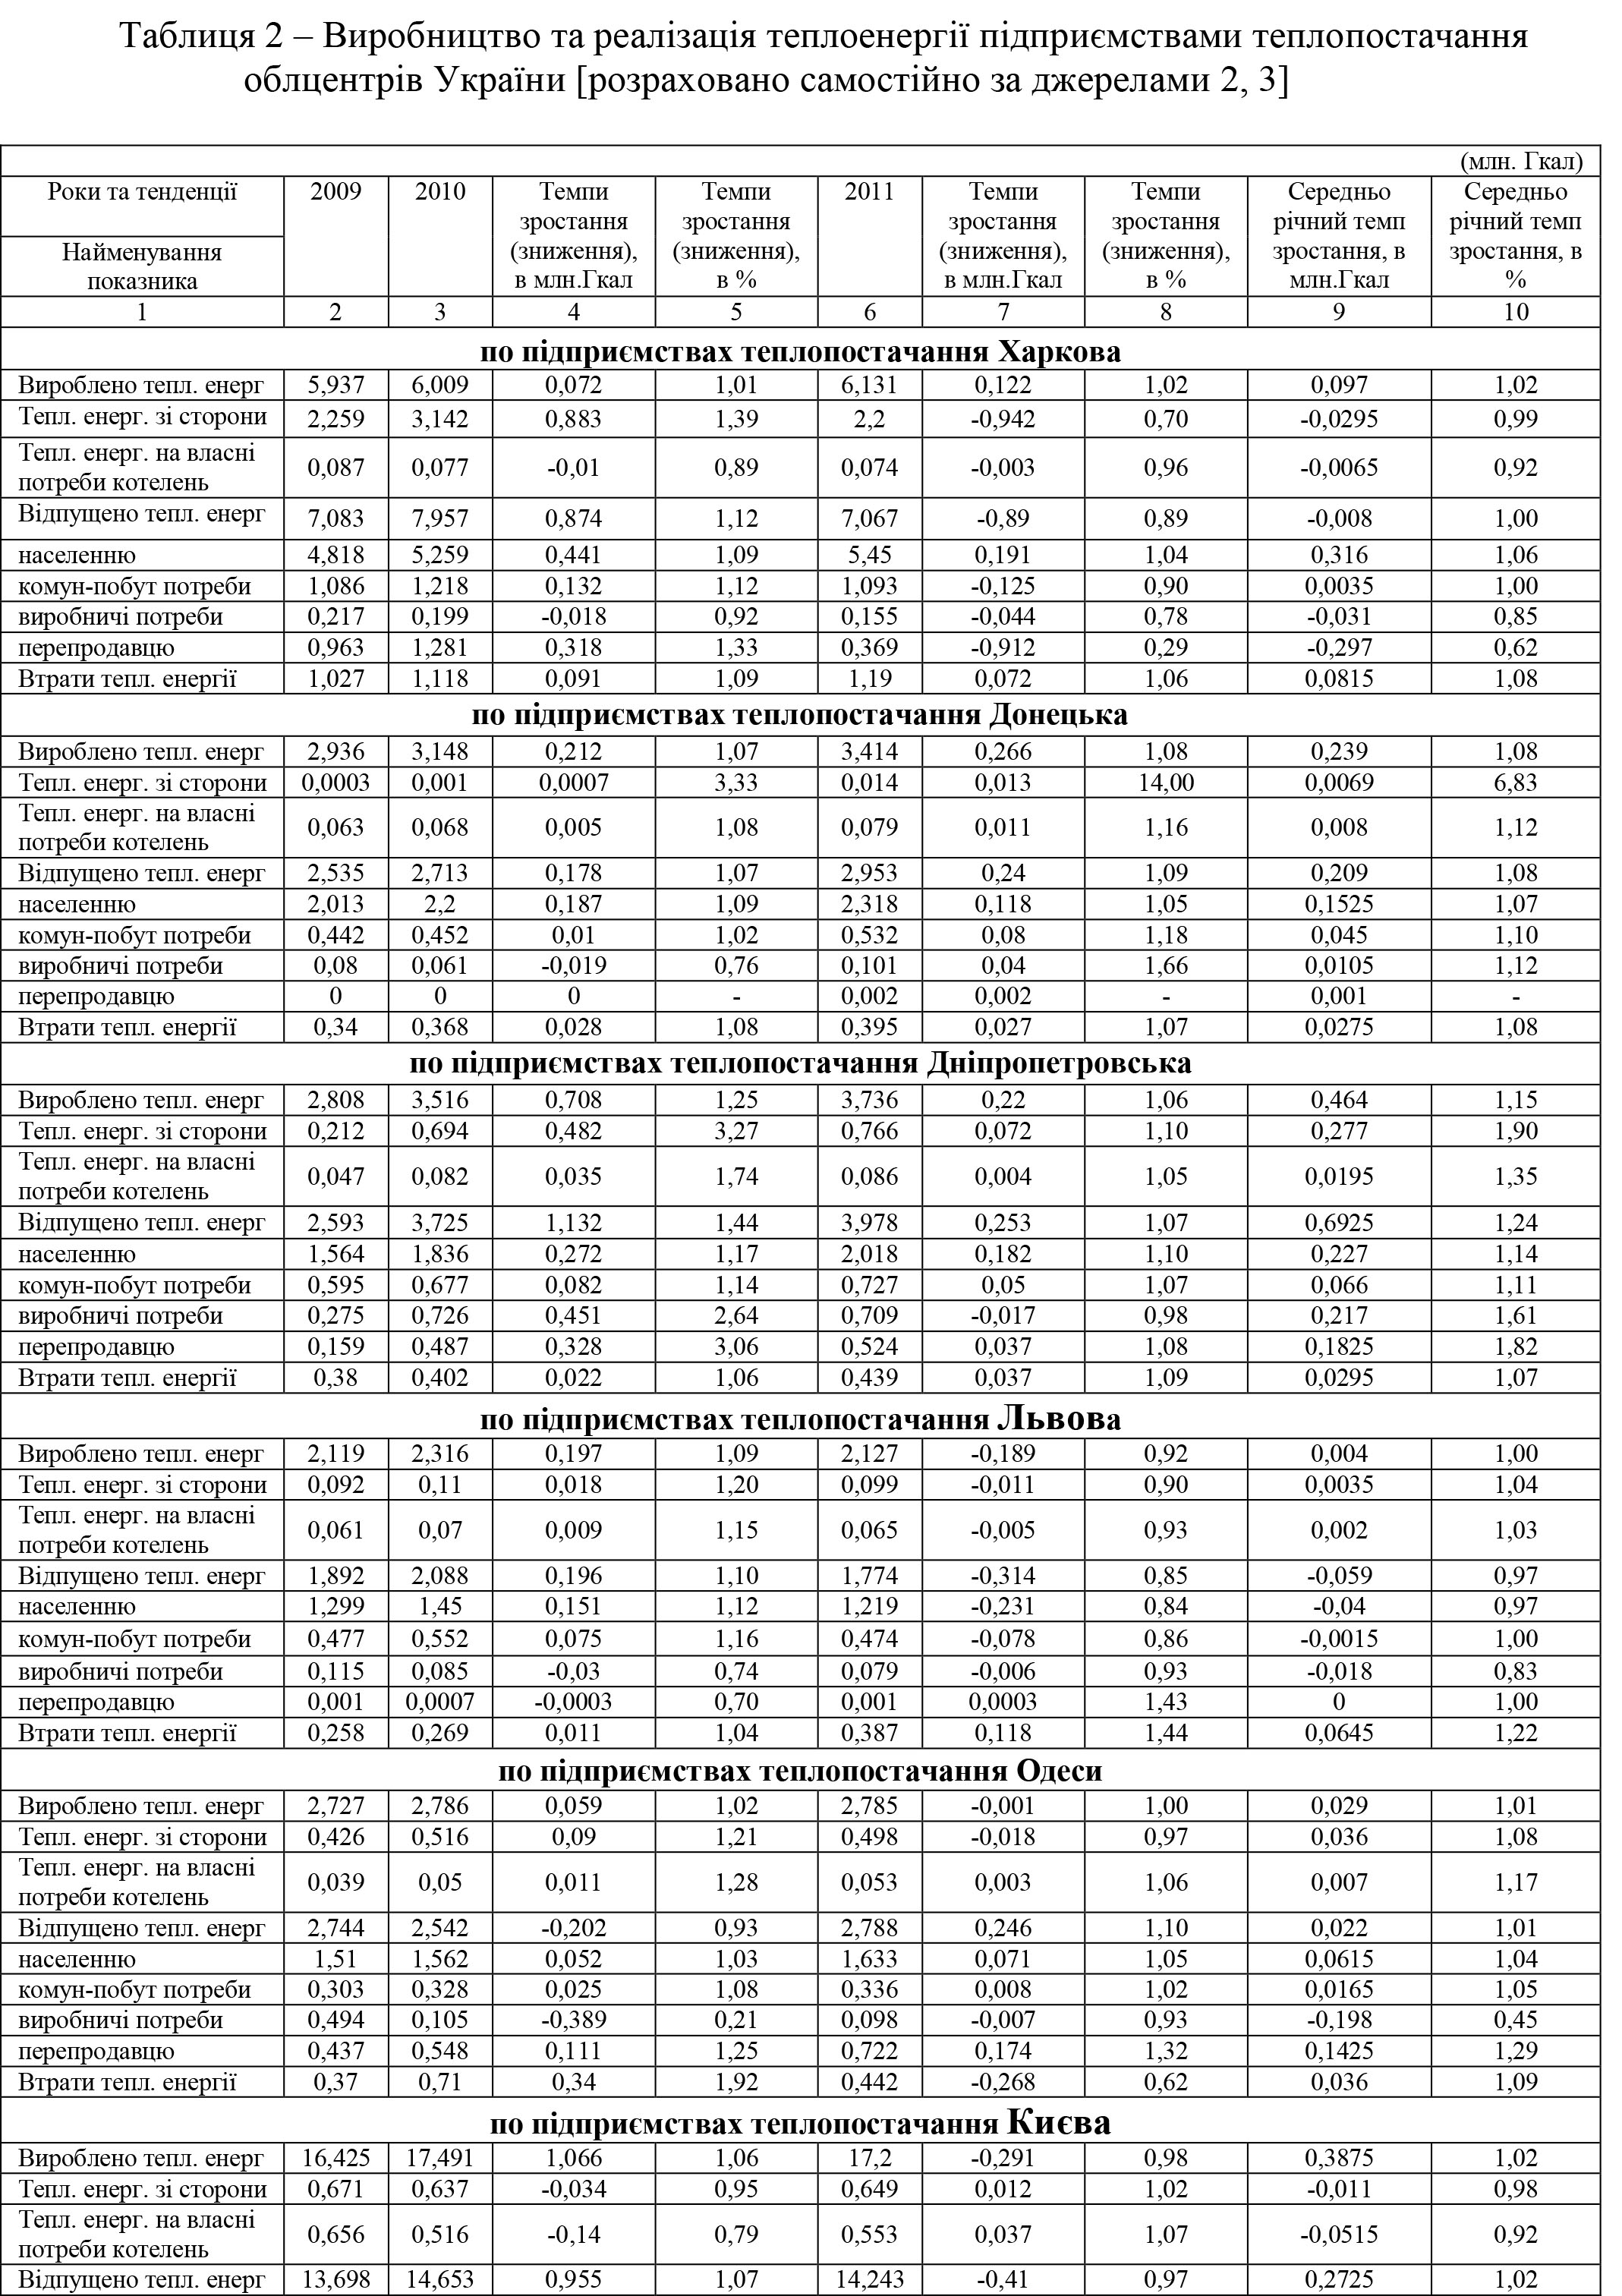
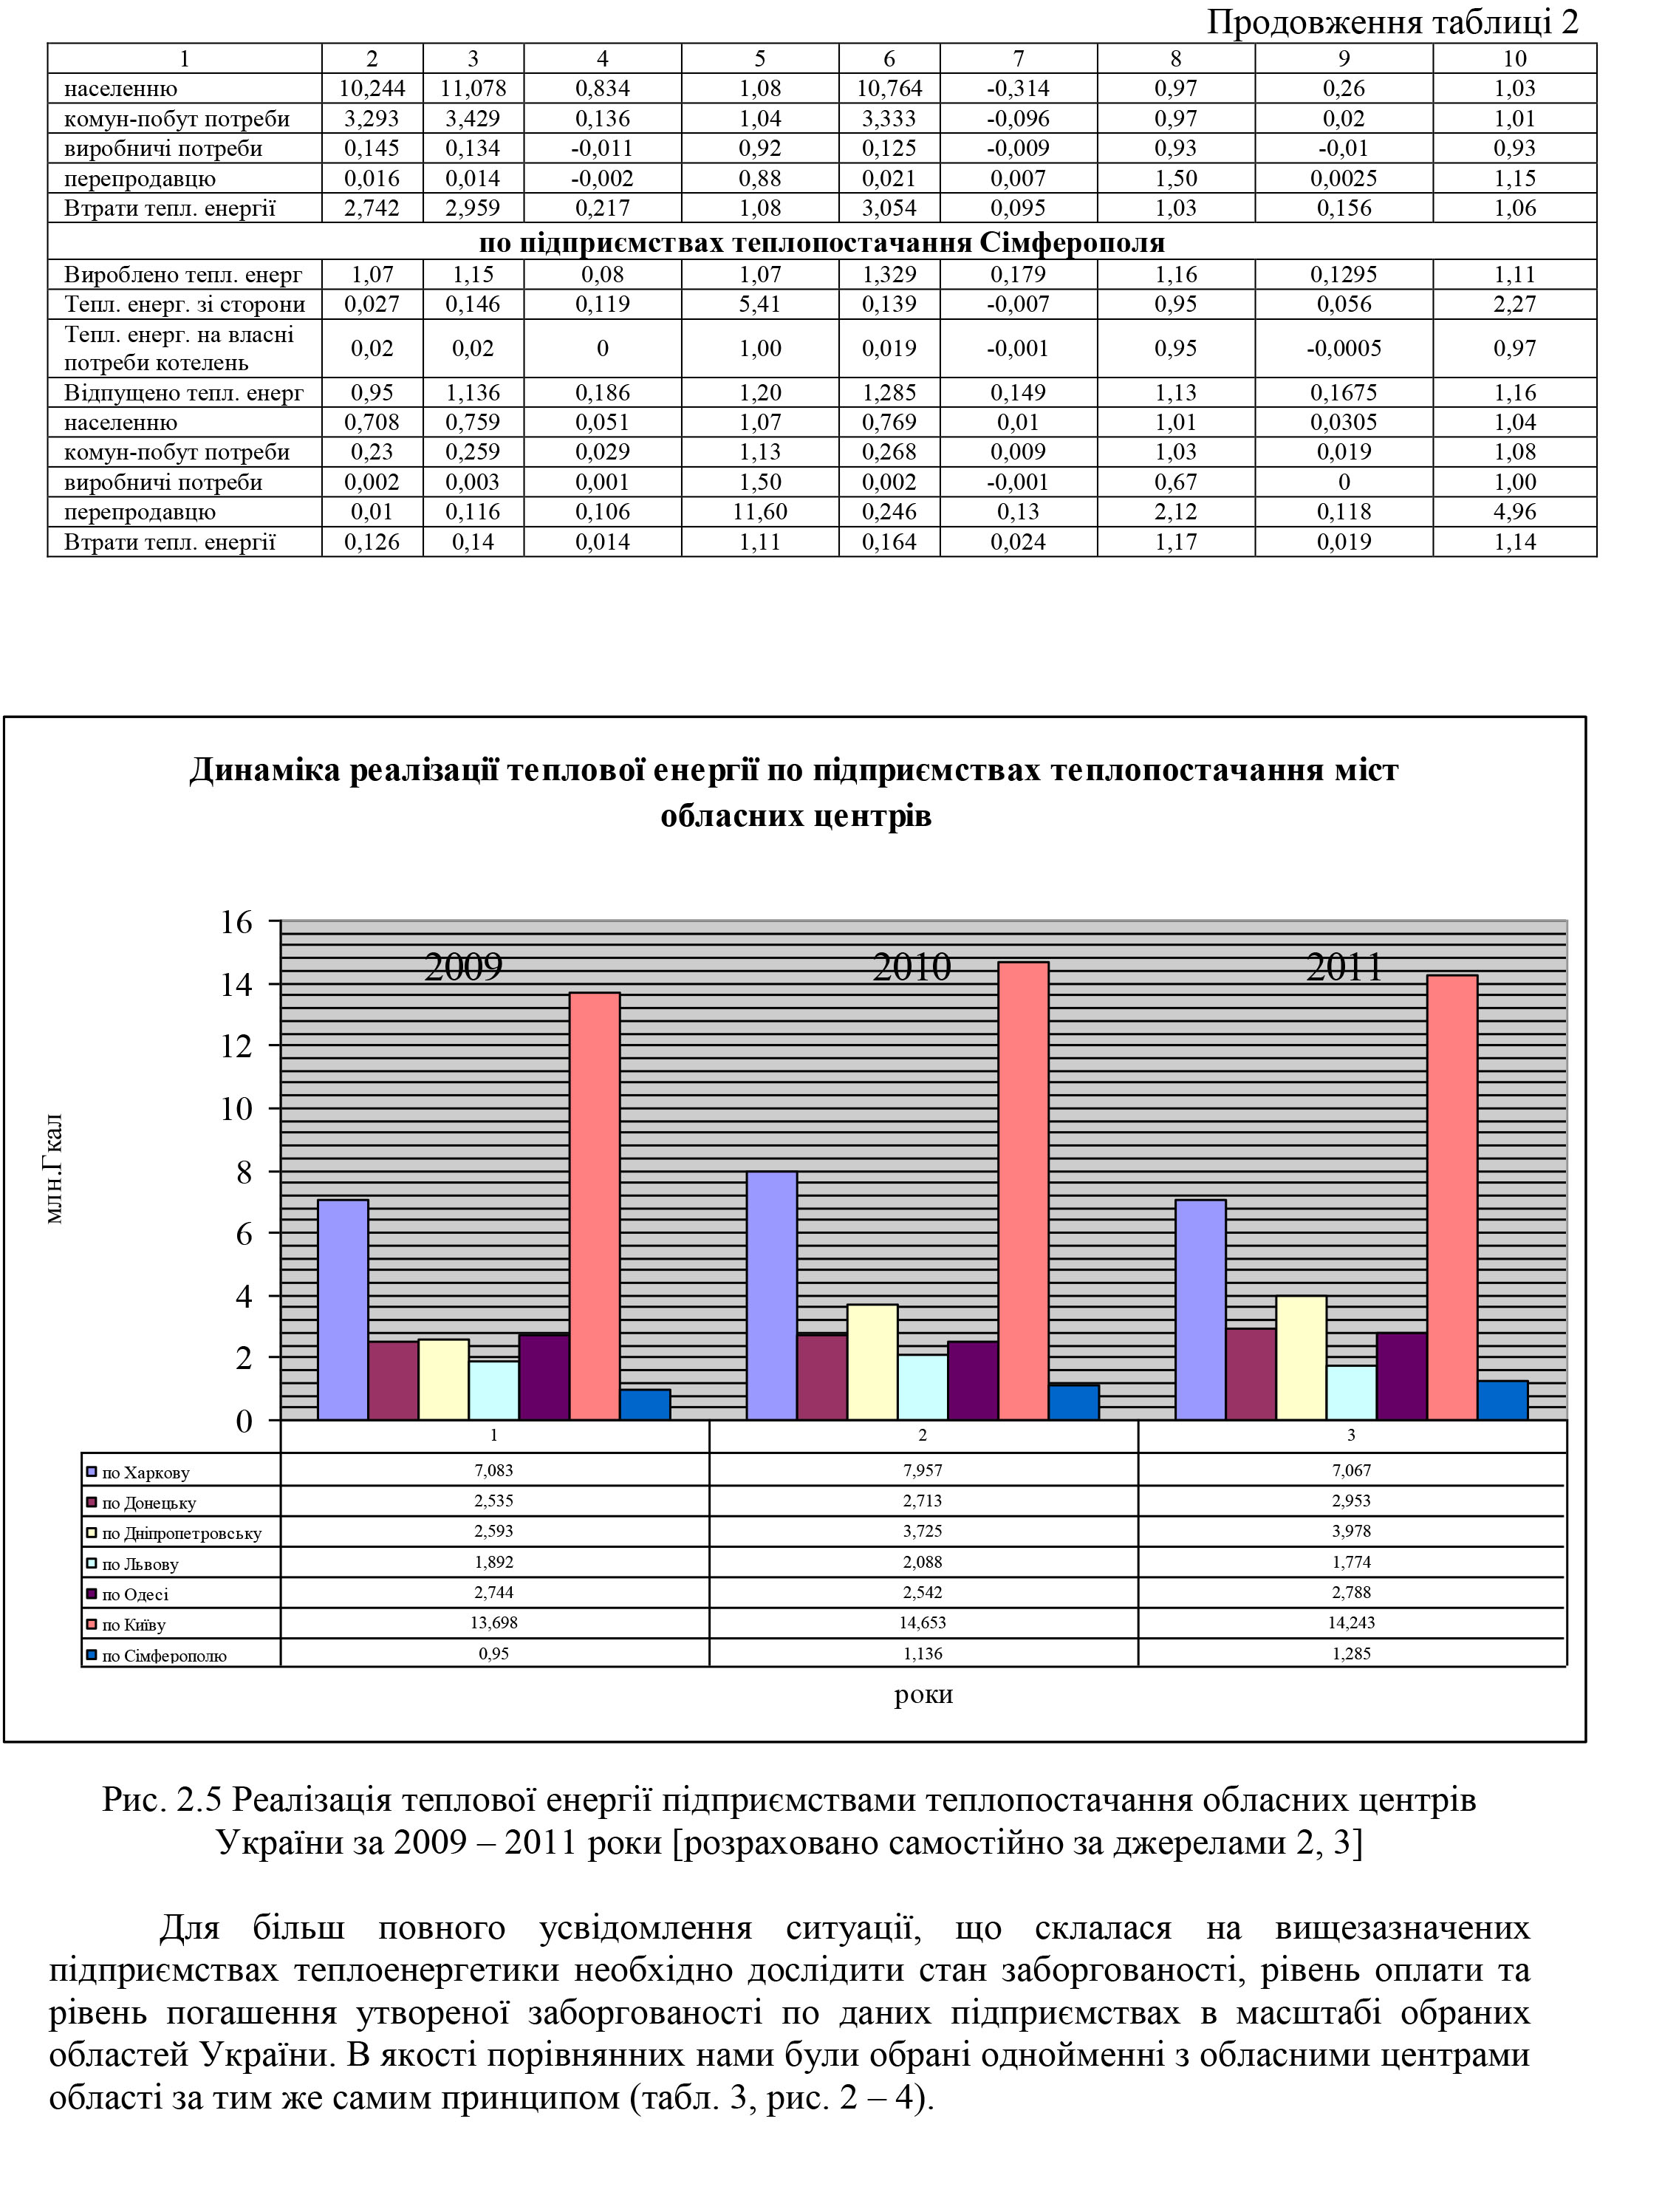
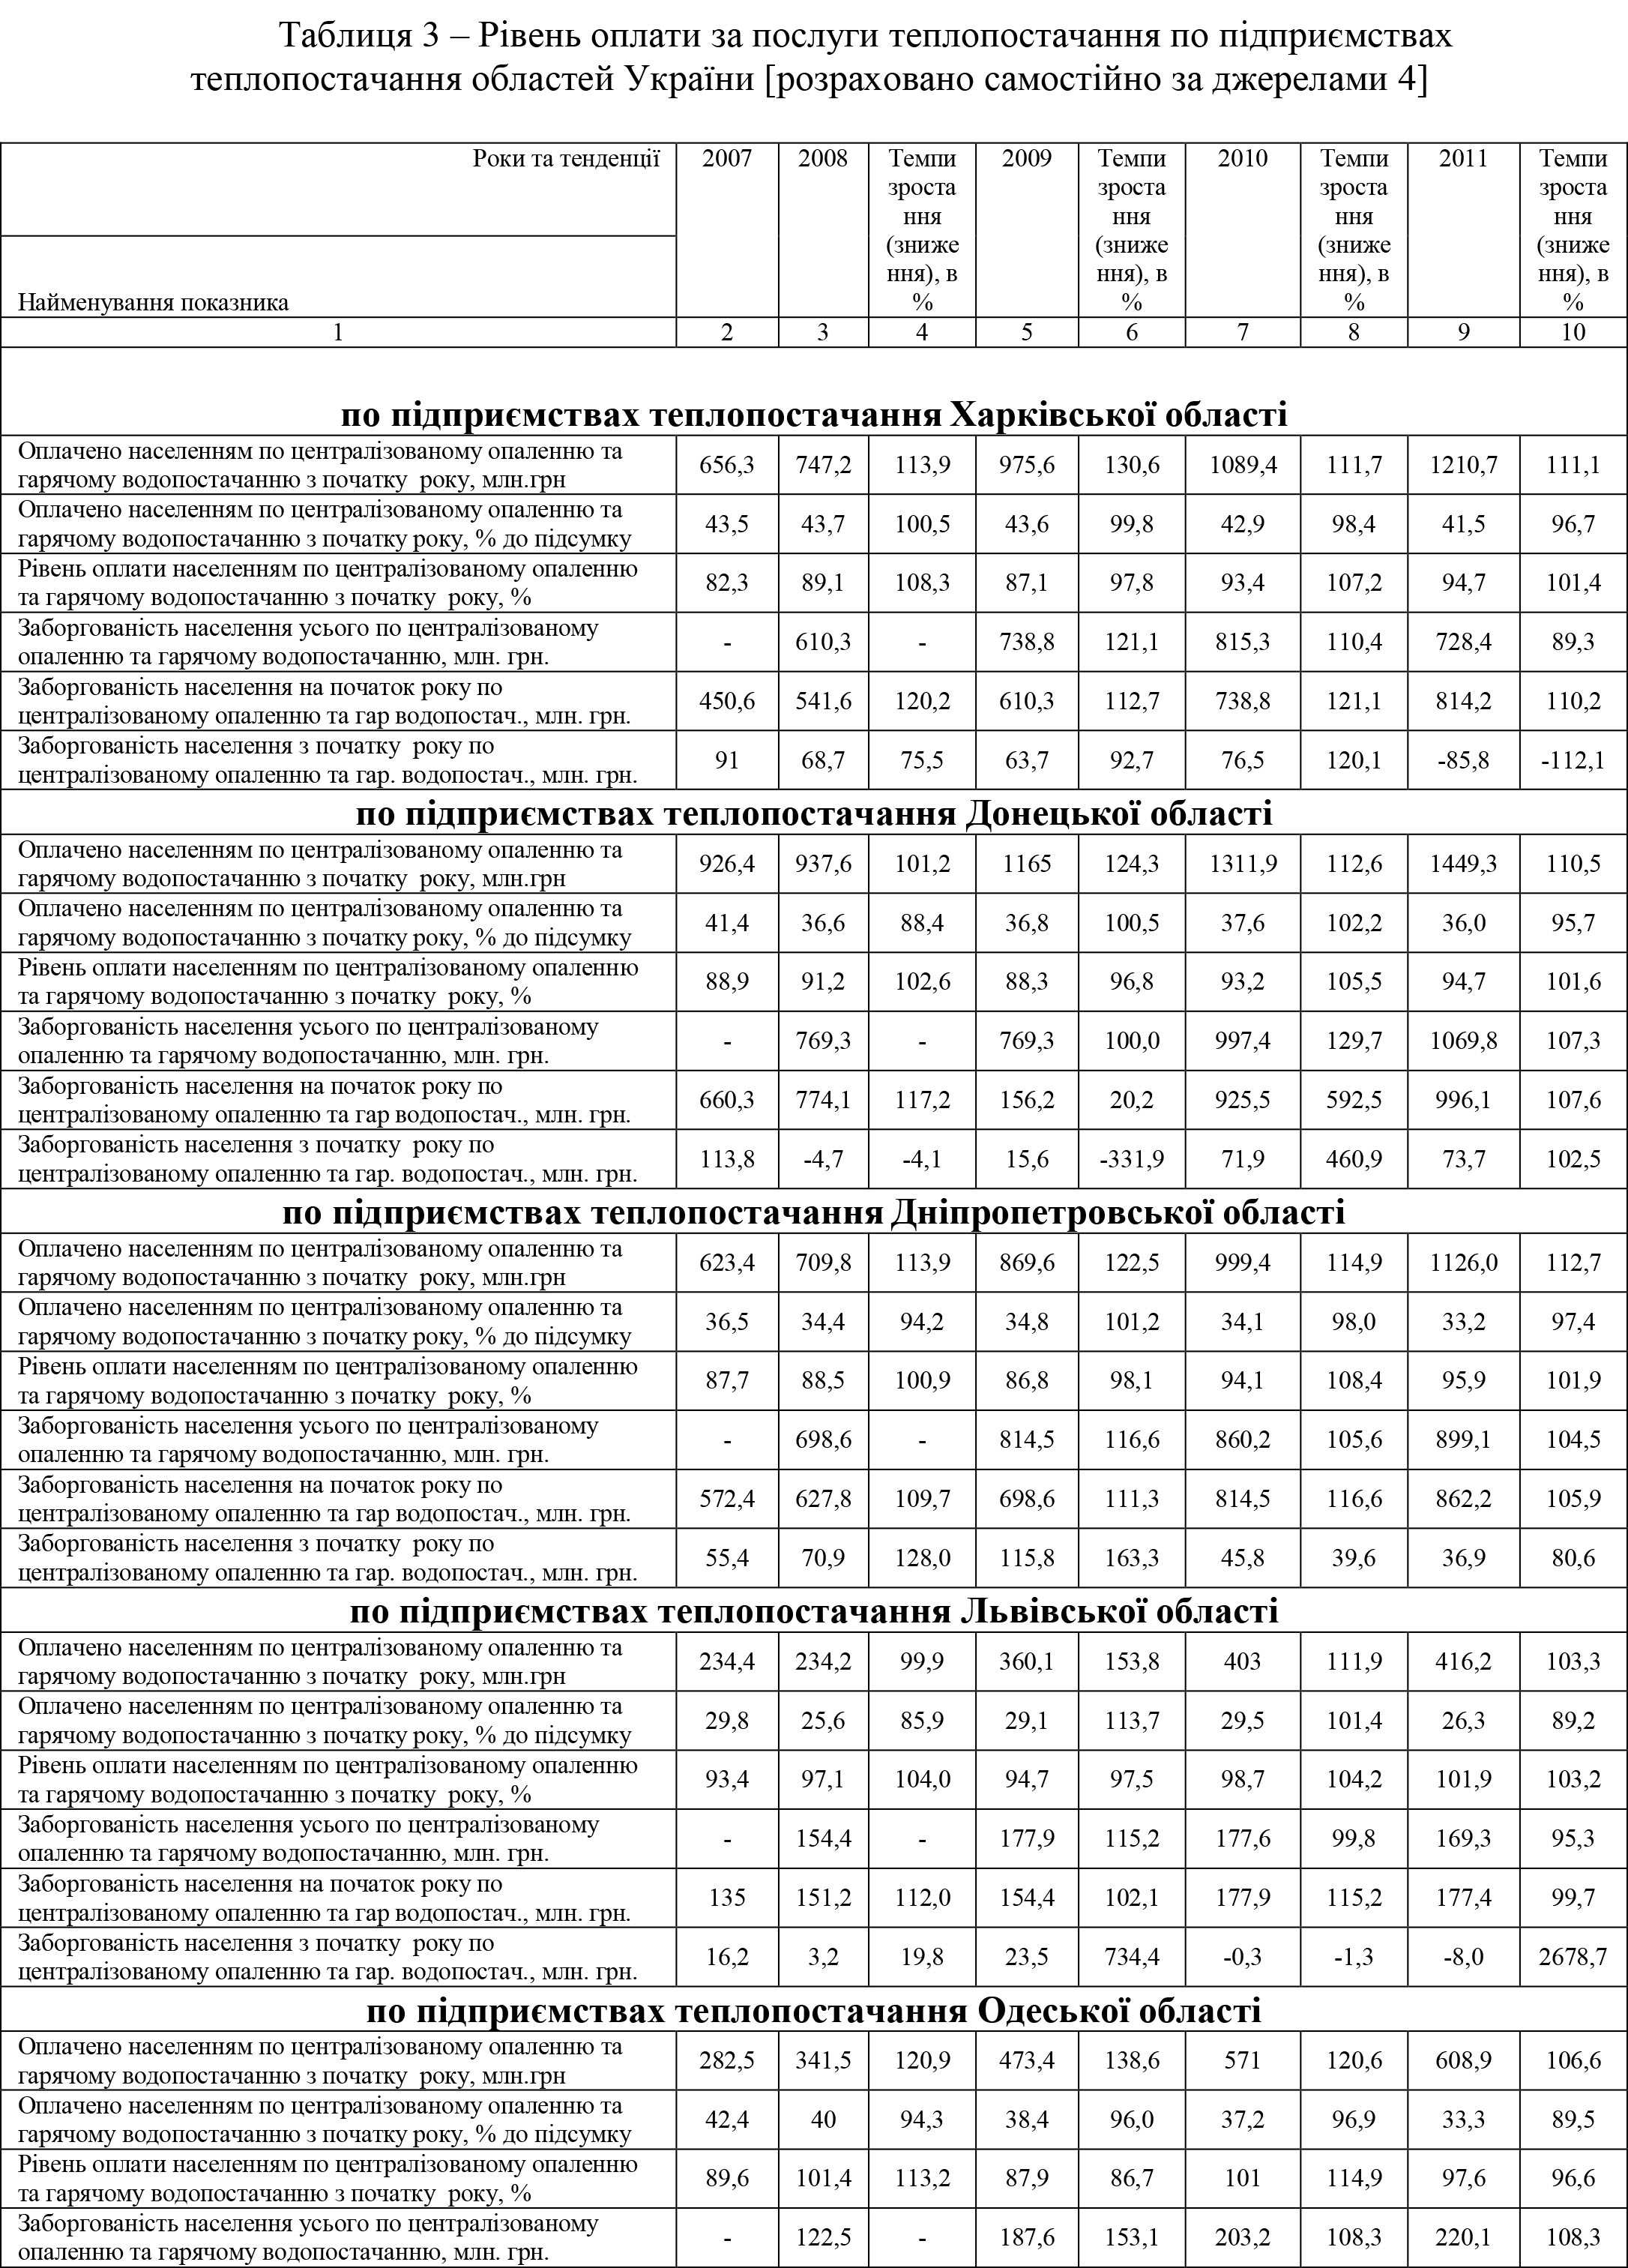
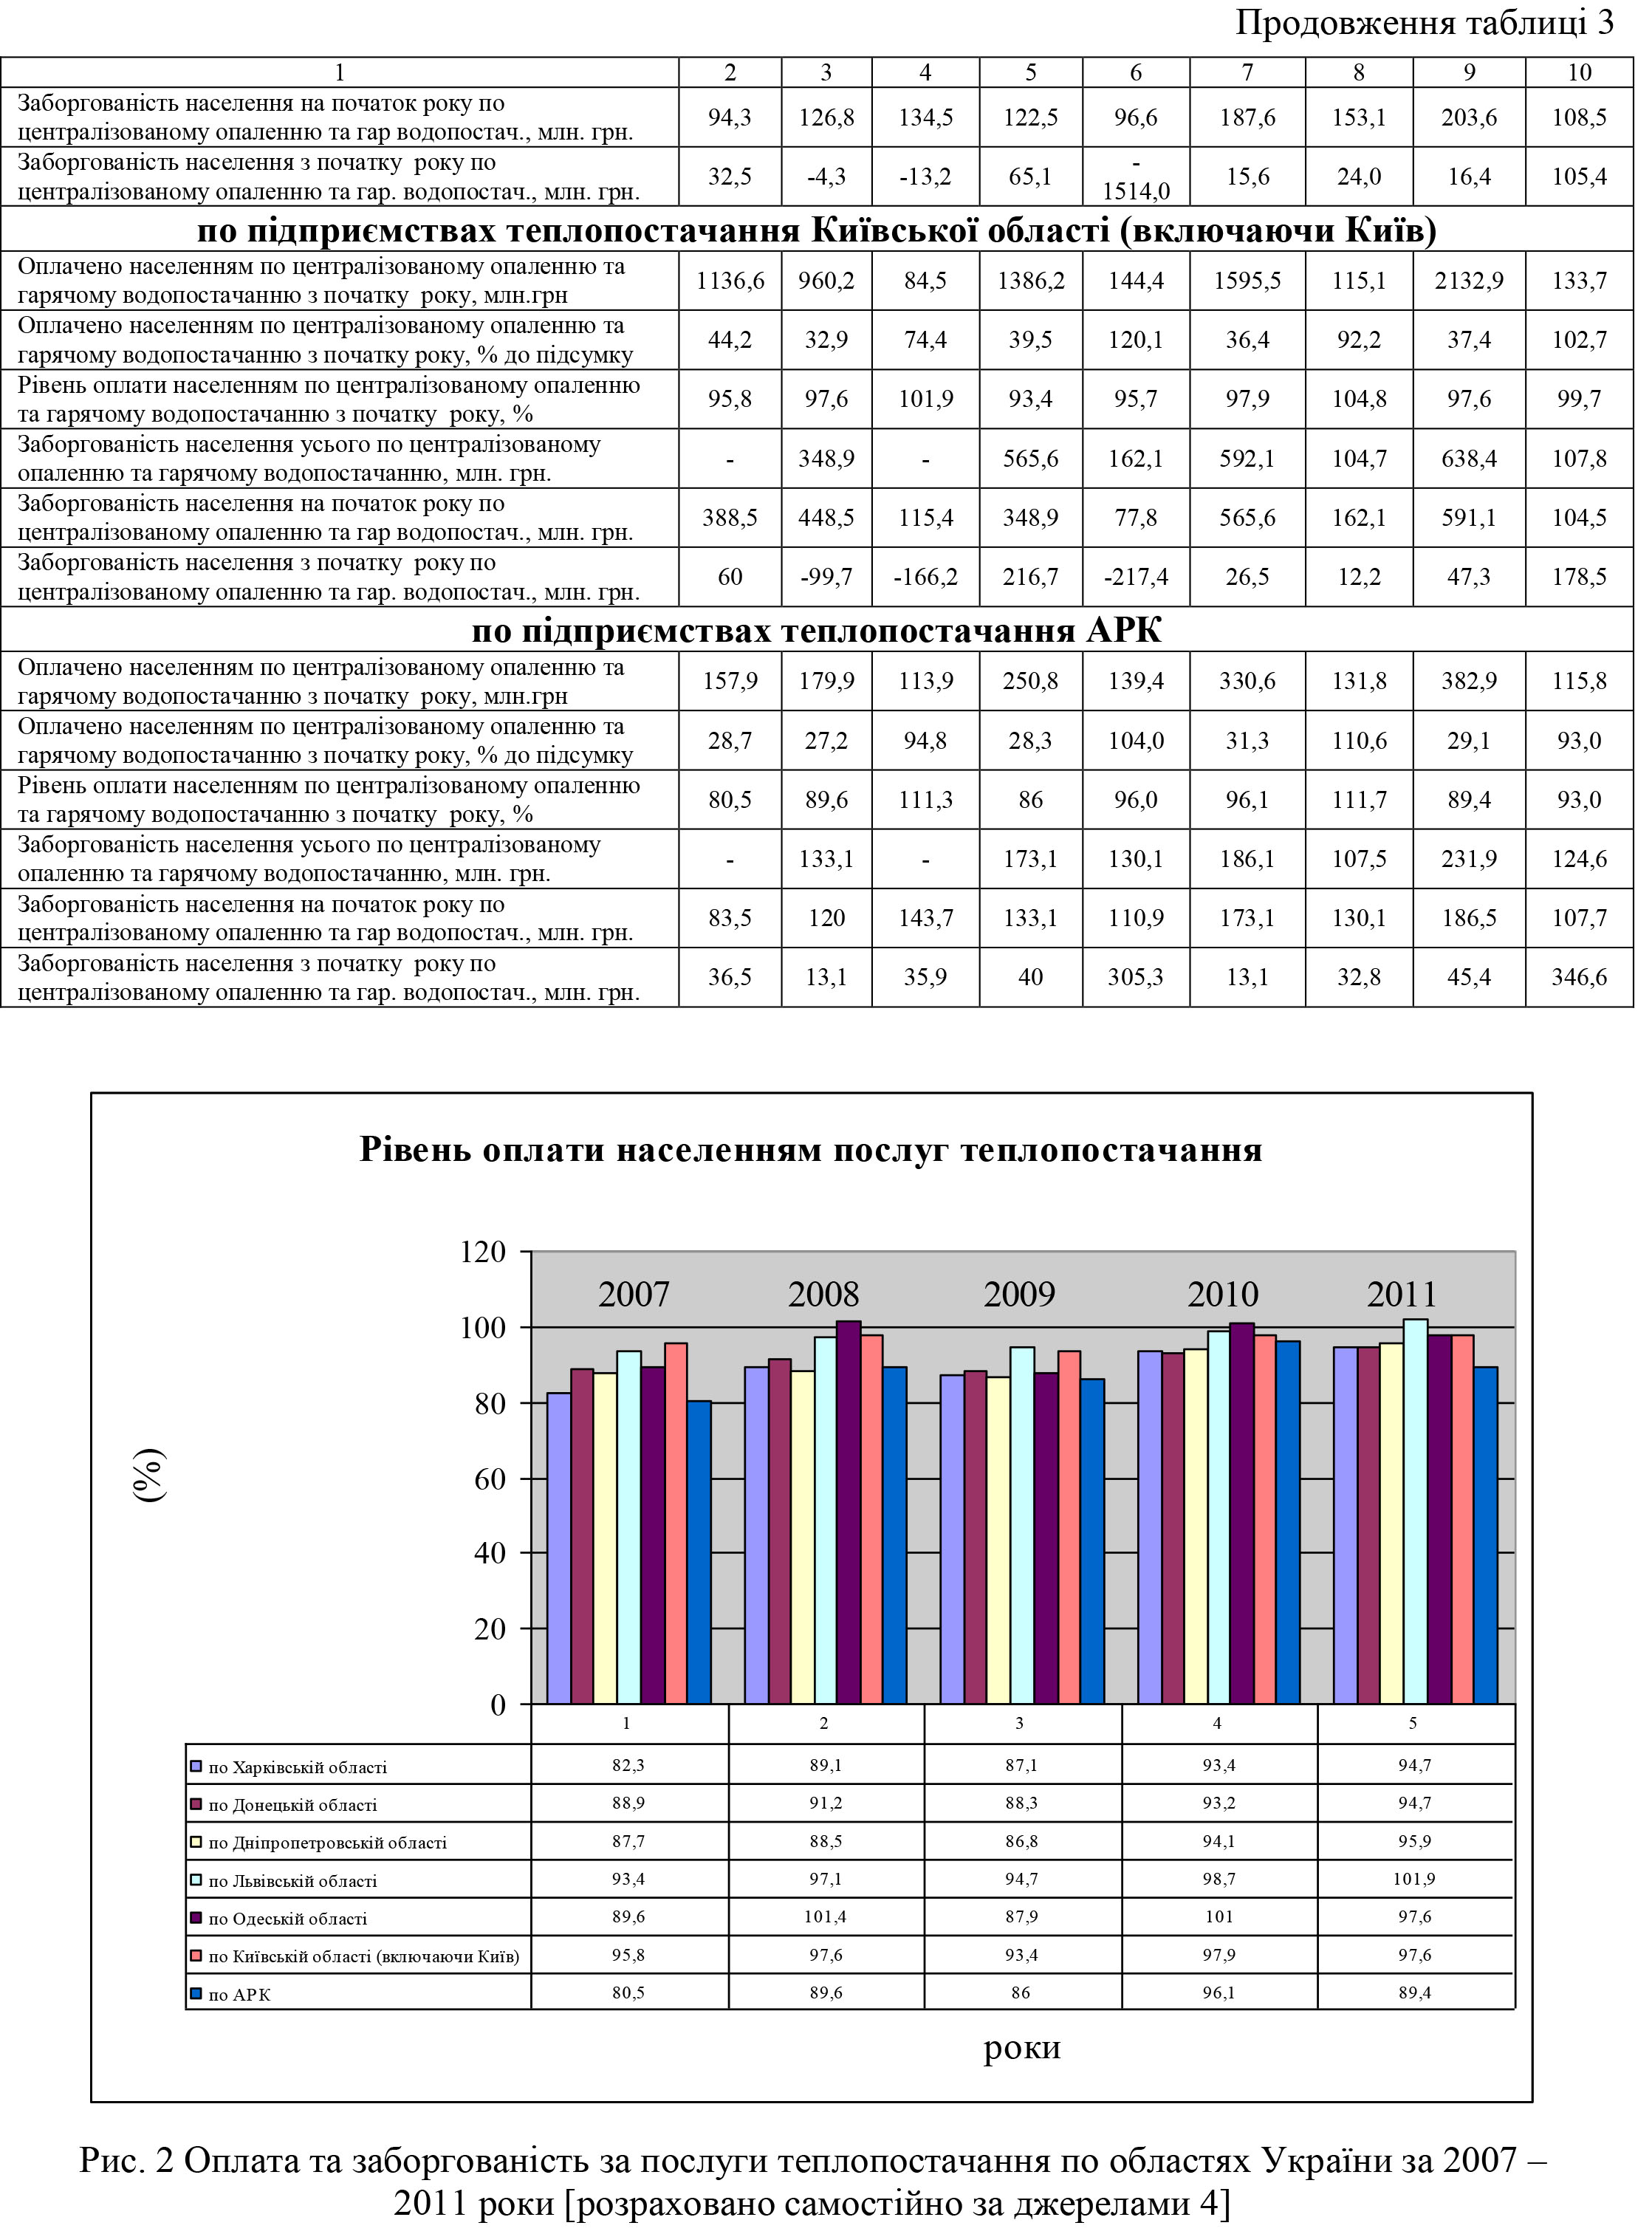
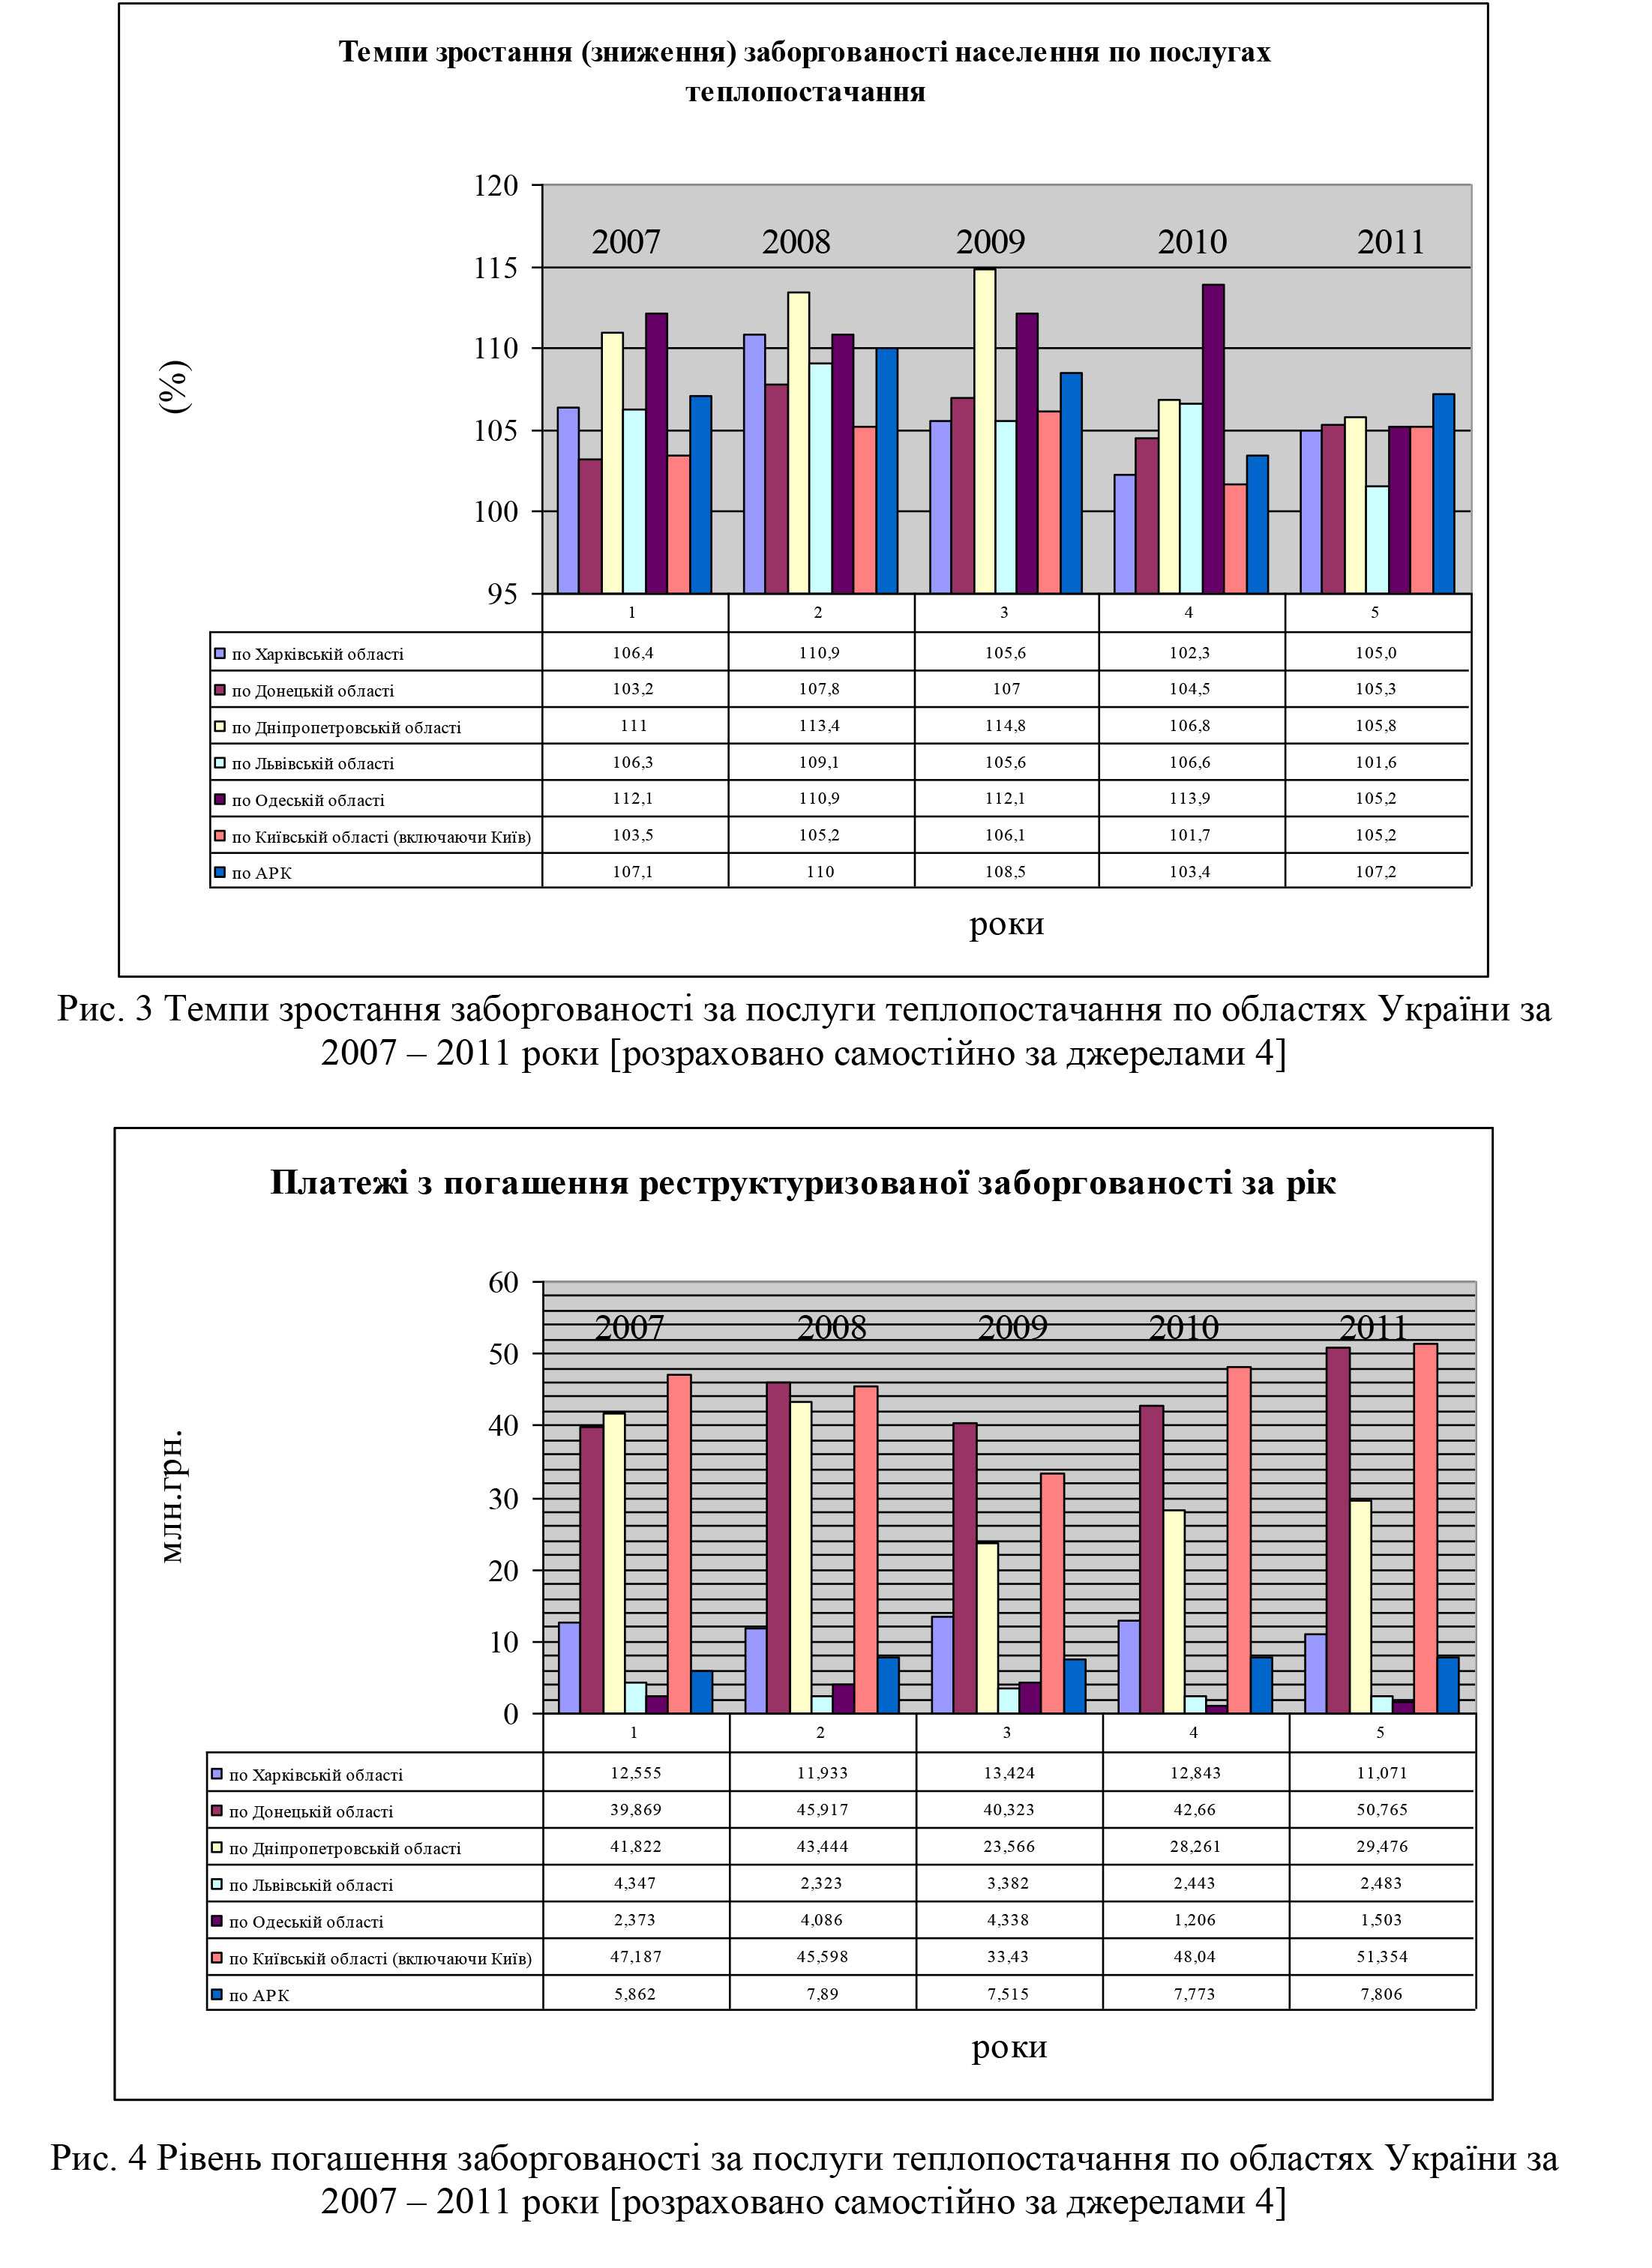
As can be seen from Tables 1 — 3 and Charts 1 — 4, district heating companies in Kharkiv, Donetsk, Dnipropetrovsk, Odessa, Lviv oblasts and the city of Kyiv occupy a significant share in the country’s industry — 28%. They are also characterized by a very extensive system of thermal networks, which is a significant factor of infrastructure, which has a positive impact on the socio-economic development of the regions. The production capacities of the boiler-houses of these regions are characterized by a considerable reserve, which is a consequence of the reduction of production in comparison with the Soviet times, and the introduction of resource-saving technologies at some enterprises. The heat losses associated with its production and transportation processes are still at a high enough level, due to the obsolescence of the equipment on which it is produced, the moral and physical wear and tear of the heat networks it supplies to consumers, the obsolescence of these process technologies. The debt for housing and communal services, in particular heat supply services, is still considerable, but in 2011 there was a tendency to reduce it by paying off debts of the previous periods and maintaining payment discipline in the given period. On a positive note, in 2011, debt is not observed at all for the payment of services of the above-mentioned enterprises. however, in 2011, there was a tendency to reduce it by repaying past debts and maintaining payment discipline in that period. On a positive note, in 2011, debt is not observed at all for the payment of services of the above-mentioned enterprises. however, in 2011, there was a tendency to reduce it by repaying past debts and maintaining payment discipline in that period. On a positive note, in 2011, debt is not observed at all for the payment of services of the above-mentioned enterprises.
It is not possible to solve such problems by means of point non-systematic actions aimed only at “patching holes” and maintaining in a state of permanent crisis of a given branch of the country. It is necessary to introduce a set of continuous actions, strategic in nature, aiming at structural restructuring of socio-economic relations arising between heat supply companies and all other interested parties. Thus, it is necessary to tightly control the costs and use of resources by utilities, to create and put into effect a transparent, clear, easy-to-read information system, to establish an honest dialogue between utilities and other interested parties, to insulate heating facilities, to undertake a set of activities with thermal insulation of thermal networks, replacement of obsolete burners,
references
- DGUSHO. Express Issue 01.03.2012 № 218. Main Performance Indicators of Heating Boilers and Thermal Networks in Kharkiv Region for 2011 / State Statistics Committee Main Department of Statistics in Kharkiv Oblast [Electronic resource] / Resource access mode: http: //uprstat.kharkov.ukrtel .net / ua / express / 2012_eng.html .
- SSSU. Separate technical and economic indicators of the operation of heating boilers and heat networks for 2011 / State Statistics Service of Ukraine [Electronic resource] / Mode of access to the resource: http://www.ukrstat.gov.ua/ .
- SSSU Separate technical and economic indicators of the operation of heating boilers and heat networks for 2005-2010 / State Statistics Service of Ukraine [Electronic resource] / Mode of access to the resource: http://www.ukrstat.gov.ua/ .
SSSU. Express issues for 2008 — 2012. On payment of housing and communal services by population in December 2007 — 2011 / State Statistics Service of Ukraine [Electronic resources] / Access to resources: http://www.ukrstat.gov.ua/
TECHNOLOGY OF ORGANIZATION OF EXPERT POLLS OF NON- comparative CHARACTER IN THE ESTIMATION OF THE ENTERPRISE PLANNING SYSTEM
published in 2012. — Kh .: KhIBM — 2012. — P. 85 — 96., © Nemtsov OV.
Annotation.In article key parameters technology’s of the organisation expert’s interrogations of not comparative character can be applied. This technology are investigated for any processes, objects, subjects or the phenomena, for which do not exist analogues, and also research of questions on which there are no alternatives. By means of the created technology the basic criteria complex’s system of indicators of system effectiveness’s planning are confirmed.
Keywords: experts, expert approach, expert methods, expert survey, peer review of non-comparative nature, monodic approach, statistics of averages, statistical hypotheses, one-dimensional statistical analysis, Z-statistics, Z-test, t-Student.
Formulation of the problem in general.
Today, many objects, entities, processes and phenomena of the socio-economic sphere, in particular planning and planning, cannot be measured by natural or value indicators, that is, by means of a proportional scale, but nevertheless require evaluation. This is especially true of the evaluation of the quality, derived from its properties — efficiency, management decisions of different levels and synergistic effect, which also occur when planning. Moreover, in this case, creating an alternative planning mechanism or alternative planning system is quite complicated, so there is a need to evaluate the quality, effectiveness, success of management decisions and synergetic effect resulting from the clear execution of plans, the above process and the system separately, ie without comparison with analogues or alternative.
Analysis of recent research and publications.The use of expert methods to study many processes, objects, subjects, or phenomena, especially those that are new or unknown, has been going on for a long time. However, formalization of these methods in the form of scientific knowledge occurred recently in terms of history — approximately in the 60s of the 20th century. Therefore, the fundamental work of the scientists of the time, who can rightly be called classics in this field of scientific knowledge — EP, deserve great attention. Reichman., G.G. Azgaldov, L.N. Bolshev, NV Smirnov. However, problems that arise in today’s economy, as well as in other fields of knowledge, require the improvement and updating of some provisions of fundamental works by expert methods. The works of such scientists as V.N. Aitingon, M.A. Kravets, NP Pankratova, R. Churchill, S.I. Kosenkov, D.N. Hamkhanova, I.Yu. Kondrat, VI Kurbatov, GA Ugolnytsky,
The purpose and purpose of the article. To analyze the existing technologies of conducting expert polls and further processing of their results, as well as to develop author’s technology of organization of expert polls of a non-comparative character by means of a comparative approach on the example of confirmation of the criteria of evaluation of the enterprise planning system.
Outline of the main research material.Since it does not have a single methodology for conducting the expert survey, there is only a well-known mechanism, which consists of the following stages: development of criteria for joining the expert group and its further formation, development of regulations and organizational support of the expert examination, obtaining expert data and choice of methods for their further processing. , choice of methods of verification of expert opinions for consistency, obtaining of results of examination and their analysis [1, P. 3]; and based on the goals of our expert survey, for each of the above steps, we will define our methods, procedures and indicators.
Thus, the expert survey is incomparable in nature, that is, we suggest that the experts do not select an object or rank the objects presented in the questionnaire, but express their vision about the correctness of the declared hypotheses for each of the presented objects regarding the possibility of their use in assessing the effectiveness of the system planning. Therefore, the well-known methods, procedures and indicators used in comparative peer review cannot be applied. As this expert survey is incomparable in nature when conducting market research to identify respondents’ opinions on a particular issue, we propose to apply by analogy those methods, procedures, and indicators used in conducting these research.
The stages of marketing research are: problem definition, choice of research project, choice of data collection method, development of forms to be filled in the research process, design of sample and data collection, analysis and interpretation of data, preparation of report on the results of the conducted research [2, P. 59 ]. So, by compiling the traditional expert survey and marketing research stages, we will determine the mechanism by which we will conduct peer review of an incomparable nature: identifying the problem and main goals of the expert research, developing regulations and organizational support for conducting the examination, developing the questionnaire and determining the scale of measuring each question , development of criteria for joining the expert group and its further formation,
Instead, the author is faced with the problem of the correctness of his hypotheses:
1) the proposed indicators of the effectiveness of the planning system, their distribution into direct and indirect, and their ability to evaluate the effectiveness of the planning system;
2) to determine the corridor of the optimal values of the performance indicators corresponding to their effective state;
3) the degree of deviation from the optimal values of the performance indicators by the author, which form corridors of the values of the performance indicators that correspond to their moderately effective, inefficient and inefficient condition.
According to the identified problems, the objectives of the expert survey are:
1) evaluate the feasibility of using the author’s performance indicators to comprehensively evaluate the effectiveness of the planning system;
2) to assess the correctness of the corridor of values of these performance indicators, which corresponds to the optimal (effective) status;
3) evaluate the correctness of the percentages of deviation, expressed as a percentage, from the optimal values of these performance indicators and the resulting corridors of values corresponding to their moderately effective, inefficient and inefficient condition.
A contactless form was chosen as the form of interaction with the expert group on the basis of their complete anonymity. This was due to the fact that under these conditions, the expert does not feel any pressure — neither from other experts participating in the expert survey, nor from the professional and governmental community, since the data about him in no way can be disclosed, and therefore the expert can not hesitate to express his impartial thinking. All this increases the percentage that the results of such a survey will be true. The correctness of the use of such a contact form in our case is confirmed by the experimental data and theoretical generalizations about them contained in the monograph [4, P. 84].
The expert survey is supposed to be conducted in two rounds, the first of which is a survey and the second is a descriptive one. As the question we are examining is relatively new to the field of management, every expert of these problems may have his / her own vision, so we decided to ask an open-ended question on each problem during the first round of questioning. If after the first survey round we receive any alternative data from experts, then our survey may take the traditional comparative character, and accordingly there will be a need to conduct the second round with the development of an already modified questionnaire, which would include alternative answers to the investigated problems. If, after the first round, no alternative opinions emerge and the representativeness of the expert sample is maintained, then there will be no need for a second round of expert polling.
In developing the expert survey questionnaire on the recommendations of G.A. Churchill should follow the following steps: determine the necessary information, determine the type of questionnaire and method of conducting the survey, determine the content of specific questions, determine the form of the answer to each question, determine the formulation of each question, determine the sequence of questions, determine the physical characteristics of the questionnaire, check the previous stages and review them if necessary, carry out preliminary testing of the questionnaire and change it if necessary [2, P. 309]. In view of these requirements, the following questionnaire form was developed, which is presented in Table 1.
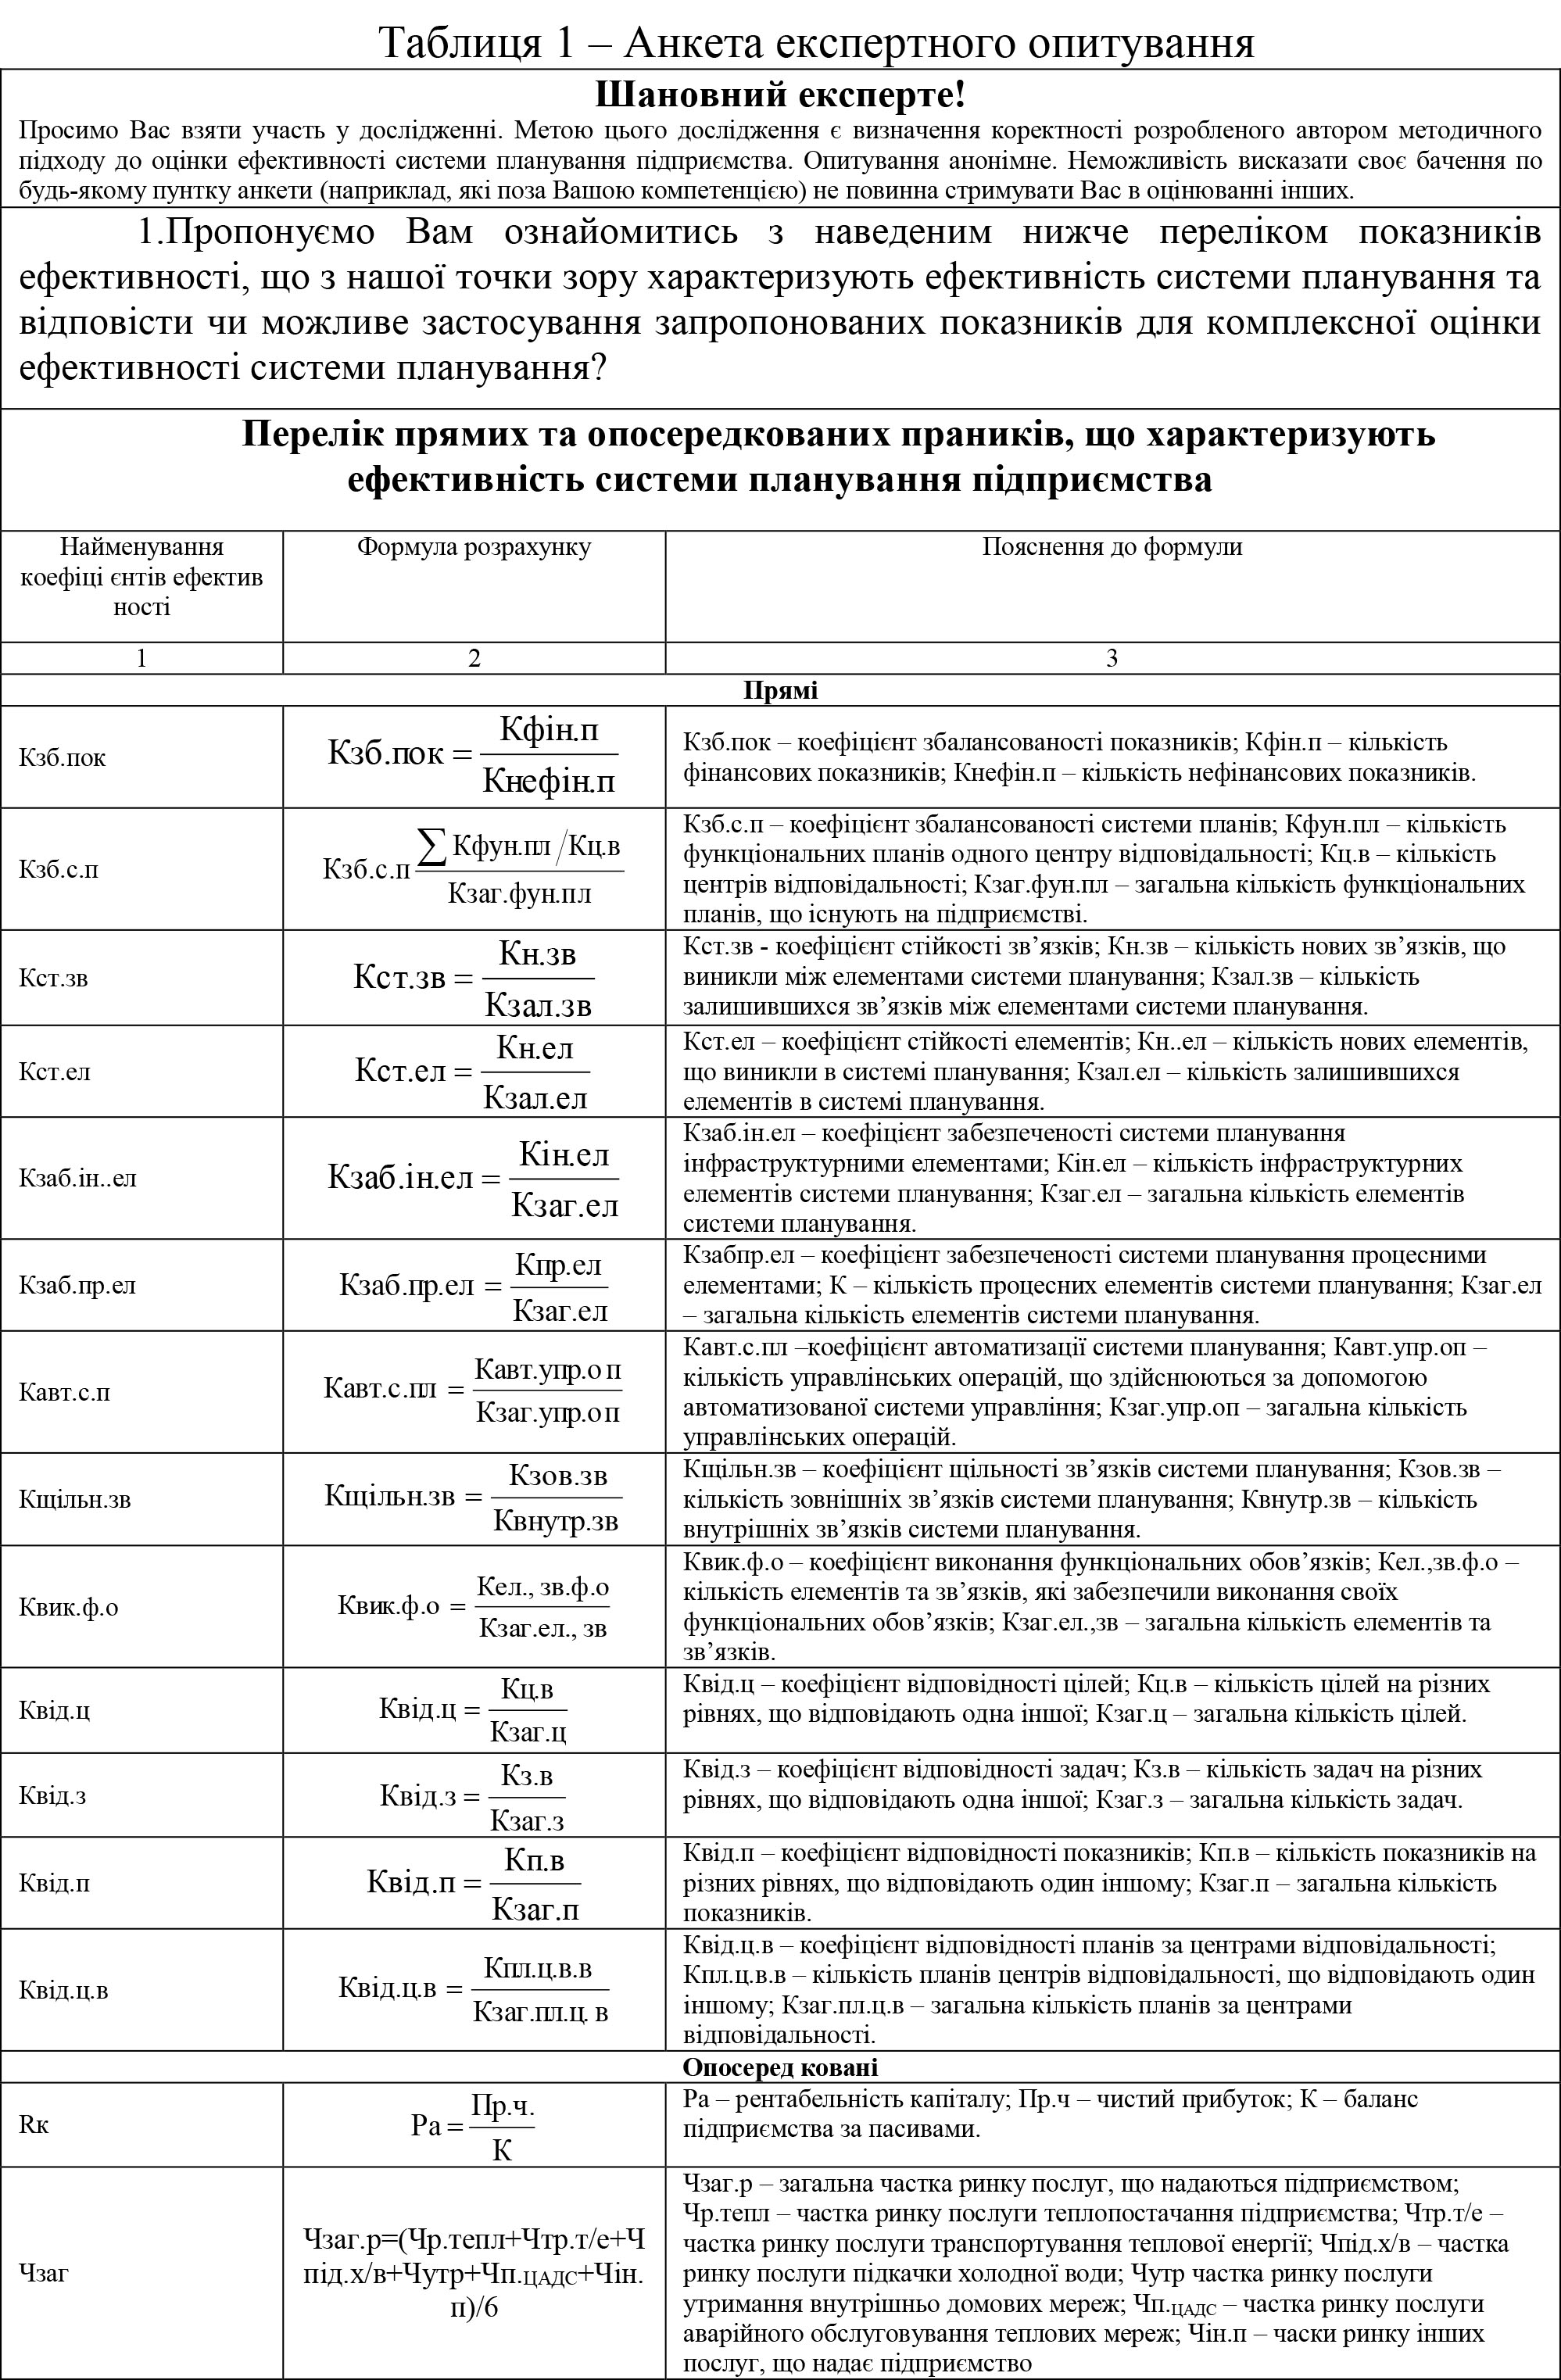
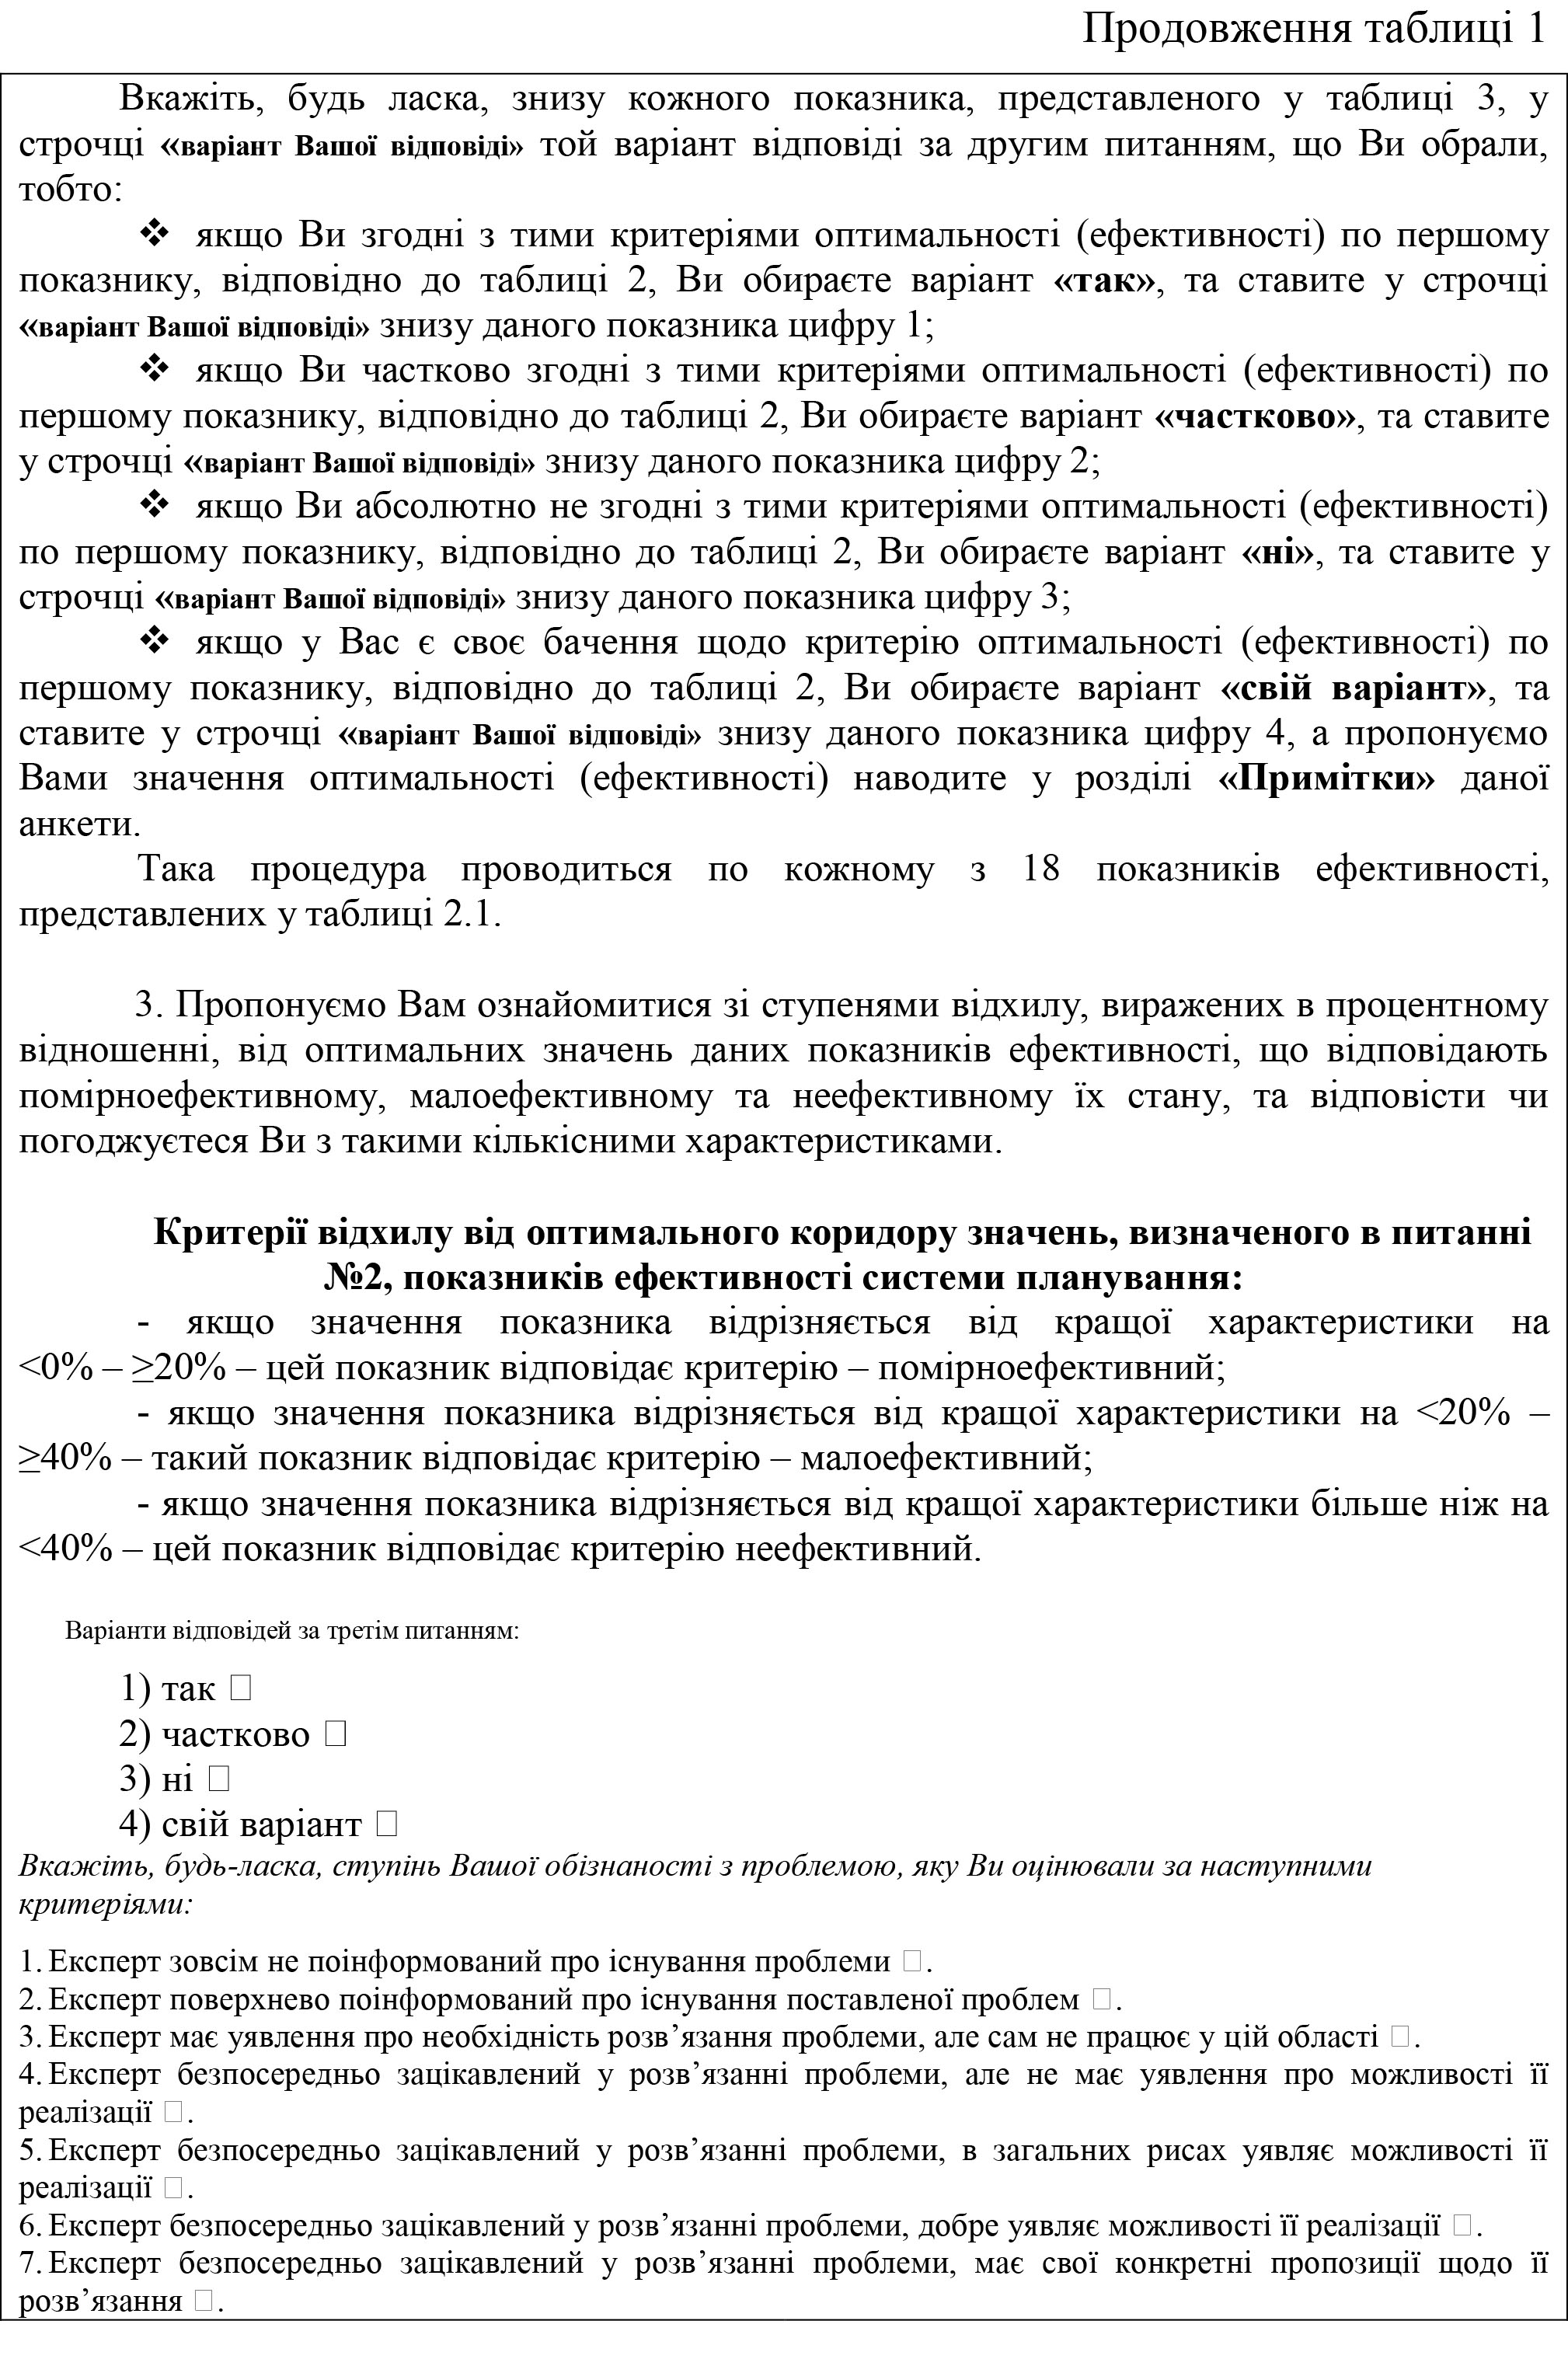

In conducting this research and further processing of the questionnaire, it is envisaged to use three types of scales: simple nominal, ordinary and interval. The proportional scale of the variants provided in the questionnaires, and in general for those purposes which are put before expert research, can not be used, since it is not supposed to measure absolute values. In the first stage, it is envisaged to use a monadic approach, which «consists in assessing the object of the object in isolation from other objects» [3, P. 48].
In our case, the ordinary scale will be used, since the numerical values assigned to objects and answers are not only designed to identify them, but are constructed in an order that reflects equivalence and orderliness between them. In the second stage, it is envisaged to use a comparative approach in the case of alternative expert opinions or to continue to apply the monadic approach, and in both cases go to the interval scale, because either the comparison or the processing of the answers presented in the first version will use points. When alternatives are presented to the problems presented, the experts will use a ten-point preference scale. If the closed questions are handled,
Such transformation of the ordinary type of scale into intervals completely corresponds to the logic of psychological identification of objects by experts, because when an expert answers the question we ask, he essentially identifies them in his mind with the criteria: «well-constructed» or «well-chosen interval of the indicator» , or a «well-selected rejection criterion» (in our questionnaire it matches the answer «yes»); «Satisfactorily constructed, that is, in principle, not bad, but in order to be able to be categorized well, some adjustments» or «a satisfactory interval of an indicator that does not fully reflect its condition», or «a satisfactory deviation criterion that does not fully reflect one or another type of his condition «in our questionnaire corresponds to the answer» in part «); «Poorly constructed» or «poorly matched interval», or «poorly selected rejection criterion» (in our questionnaire corresponds to the answer «no»). The same psychological coloring and corresponding identification correlates well with the scales used in non-comparable scaling, namely continuous and detailed rating scales (Likert scale, semantic differential, Stepel scale, etc.) [5].
That is, by its very nature, the scale we have developed is an optimization variant of the Likert scale, which is more clearly seen when compared with the variants of the Likert scale presented in Kosenko’s work [3, pp. 49 — 50]. It should be said that their difference, which is to reduce positions from five to three, is quite valid in our case, since the extreme two positions with emotional coloring are «very» («very bad», «very good») for the purposes of our study are of no particular importance, since we are all the same in the case when, by the results of processing, the scales weighing either to the position of «bad» or to the position of «good», we will conclude accordingly the impossibility or possibility of applying our hypotheses. Moreover, the use of a 3-point scale, which is identified as relatively narrow, reduces the relative error of peer review [4, P. 91]. It is in connection with the similarity of the scale developed by us with the Likert scale that we can justify the legitimacy of its transformation into intervals and the formation between its points (answers) of quantitatively equal intervals, which allows us to assign the answers «yes», «partially», «no» to the corresponding points 3, 2,1. It should also be noted that its shape as a bipolar asymmetric scale allows us to analyze the degree of application and possible refinement of the hypotheses, which is due to the neutral position, which indicates that the hypothesis is generally correct, but needs some changes. No, corresponding points 3, 2,1. It should also be noted that its shape as a bipolar asymmetric scale allows us to analyze the degree of application and possible refinement of the hypotheses, which is due to the neutral position, which indicates that the hypothesis is generally correct, but needs some changes. No, corresponding points 3, 2,1. It should also be noted that its shape as a bipolar asymmetric scale allows us to analyze the degree of application and possible refinement of the hypotheses, which is due to the neutral position, which indicates that the hypothesis is generally correct, but needs some changes.
For the stage of forming a representative sample of experts, it is necessary to determine the following points: criteria and methods of forming an expert group, its quantitative and qualitative composition, the order of interaction between experts [1,2, 3, 4, 5, 6]. As indicated by sources [1, 4, 6], the expert group should consist of highly qualified, well-informed, impartial experts.
So, when forming our expert group, we came to the conclusion that it should consist of managers who are well-versed in their business, preferably have scientific degrees and titles, are published in scientific and journalistic press, professional publications, participate in various trainings, discussions symposia, seminars, etc. In our opinion, this type of managers is, first of all, the heads of large enterprises and employees of economic departments of universities of Ukraine, which respectively have a large practical and theoretical experience, and in most cases combine them. Managers of medium and small enterprises are also people who are involved in management activities and can express their original vision. So the general population whose vision we will study is the set of these categories of managers.
However, we do not exclude such a course of events that the executives themselves will not be able to participate in this survey for various reasons, so we provided in our questionnaire points according to which any employee of the administrative sphere can participate in the survey, but the significance of such answer may be lower, which will be taken into account in the further processing of questionnaire data. In addition, the general population that we are going to study is heterogeneous, and consists of different homogeneous groups, which according to the source [3, P. 124] corresponds to the definition of the stratified sample.
As the data of the expert group in the field of management in the formed general population occupy unequal place, this sample bears all the signs of disproportionate. This means that some executions are more strategic than others [3, P. 128]. Based on the data from the above source, in our case, we think that the opinion of the managers of large enterprises or its employees will be of the greatest interest to us, since the enterprise on the example of which the results of this survey are studied and implemented will also be large, so its weight in the sample will be 50%. Since the proposed questions are also largely theorized generalizations and hypotheses, the second place in importance is the death penalty, consisting of employees of economic departments. It will be 25% of the sample structure. The third is the penalty, which includes executives and employees of medium-sized enterprises, will account for 15% of the sample. But the last one will be the executions — executives and employees of small businesses, which will make up 10% of the representative sample.
There are many methods of forming an expert group [1, 4, 6], but all of them are more subjective in nature than the method used to form a representative sample in marketing research and is probabilistic in constructing the sample [3, S. 110 — 113]. The possibility of applying this method to the expert survey is confirmed by the statements of the monograph [4, pp. 10 — 11] that the expert is also a kind of representative of a certain group that consumes the goods being offered to evaluate: in our case, the product is intellectual thinking, and consumer groups scientific community and businesses.
The quantitative and qualitative composition of the expert group are quantities that are interdependent: the greater the quality of the expert, the less, all things being equal, the experts are needed — thus there is no generally accepted number of experts in the group, and their quality is also measured relatively arbitrarily and subjectively.
For example, the source [4, pp. 64 — 65] provides such variants of the quantitative composition of the expert group — 5, 7, 10, 12, 13, 32, 40 and even 545, 700; the manual [1, P. 8] indicates the number of 7 people with a further breakdown of this number by each activity; work [6, P. 143] advises to form a group of 7 — 12 people, and if necessary to improve the accuracy of estimates from 15 — 20 people. The source [3, pp. 110 — 140] indicates that, depending on the mean square deviation of the studied trait and the level of significance, the representative sample is calculated separately on each case. Since there is no preliminary data on the root mean square deviation, it is not possible to immediately calculate the number of experts who will represent the representative sample, but after receiving the questionnaire data, statistical analysis on stratified representative samples will be mandatory. In the absence of preliminary data, in the monograph [4, pp. 64 — 65], it is advisable to use an already calculated table on the number of experts and the relative probability of a relative expert error. So, with 95% reliability and a relative expert rating of 0.3, which is the best option, the number of experts is 43. This number was checked after receiving the completed questionnaires according to the formula presented in [3, C128]: the number of experts is 43 people. This number was checked after receiving the completed questionnaires according to the formula presented in [3, C128]: the number of experts is 43 people. This number was checked after receiving the completed questionnaires according to the formula presented in [3, C128]:
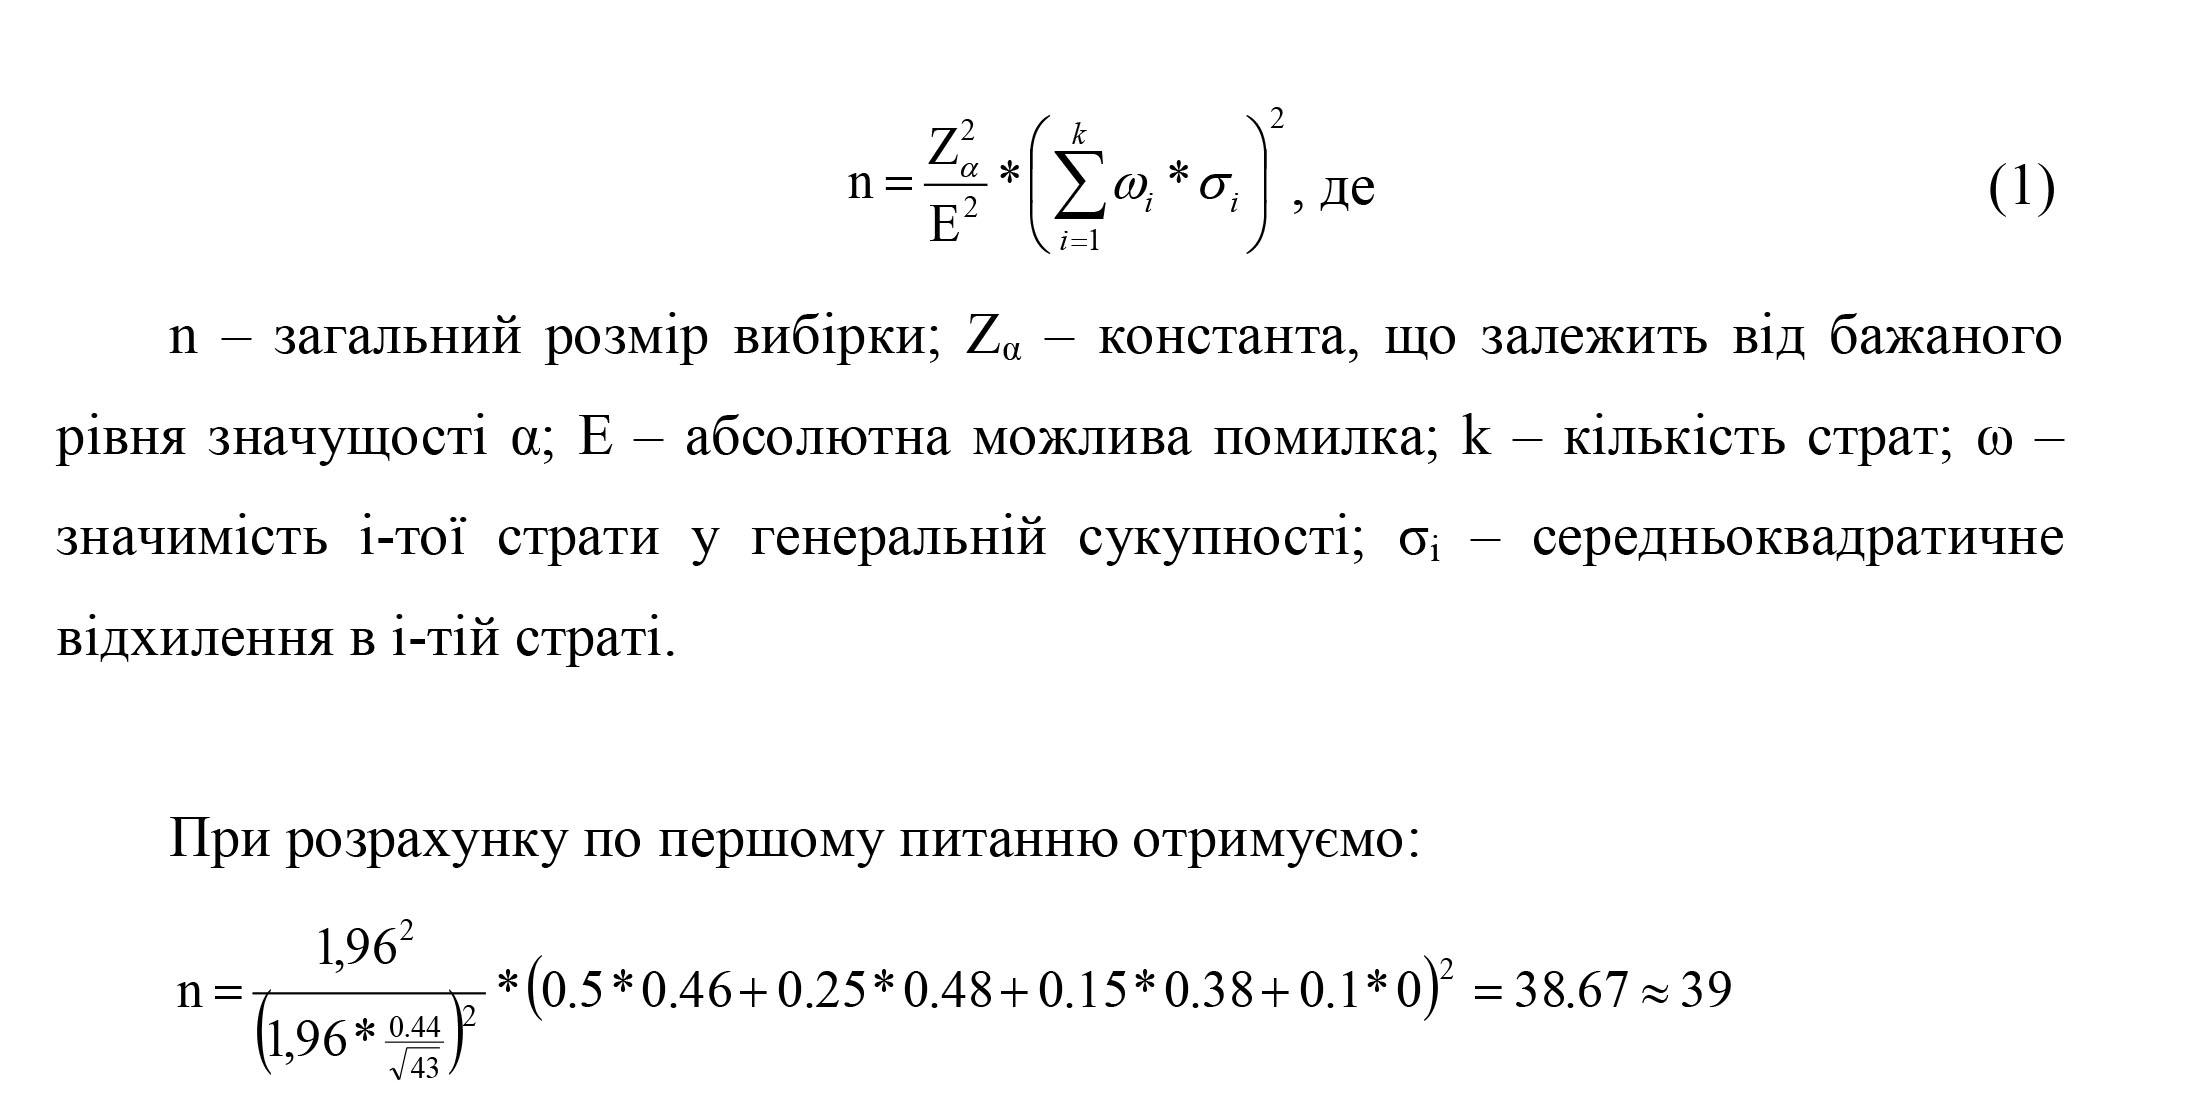
We also calculate the number of experts on all issues, and then we find the arithmetic mean of the results. So, according to the calculations, we received 43 (42.82) people, which is the same as the number of experts we interviewed, which means that our group was formed correctly and correctly.
There are a number of methods for measuring the quality of experts, including the most common method of self-evaluation [1, 4, 6]. This method is also suitable in our case, since the number of experts and their composition are such that the situation is possible when the experts are not familiar with each other, and, as already noted, the conditions of the questionnaire were such that they do not disclose any information to the expert. However, the procedure for assessing the quality of the expert is the same for all methods: a certain scale is declared, at which the evaluation is performed, mostly this scale is interval character and has points from 0 to 1 in step 0,1 or its modification from 0 to 10 in step 1, or from 0 to 100 in steps of 10, etc. [1, 4, 6, 7].
Different sources on different issues cover the possibility of including a quality expert in the group created: the authors of the manual [1, p. 10] propose to include in the group of experts whose score was 0.5 and above points; the author of the study [7, pp. 128 — 130] sets for an expert a given value of acceptable deviation of competence j-th expert from the maximum level of 0.3, that is, only those experts who are rated at least 0.7 points can enter the group; in the monograph [4, P. 45] the authors advise to determine the coefficient of competence for the whole expert group, and it should not be less than 0.6. Therefore, based on the monograph [4, P. 45], we will determine the competence of the whole expert group, because we believe that the indicator of the whole group rather than the individual expert is more significant, and it may be underestimation or overestimation of self-esteem, which in the group as a whole evens out. Having determined using the formula of arithmetic mean competence in the group of experts, we conclude that it is more than 0.6, namely 0.77, and therefore its judgments are significant. This way, we can use the data to test our hypotheses,
The data obtained also indicate that no expert suggested his / her vision of the issues mentioned in the questionnaire, so it is possible to act in accordance with the scenario described earlier, namely not to conduct the second round, but to study the available data, and how following the previous paragraph, the expert team is representative and of high quality.
For the stage of analysis of the received data, as indicated in sources [1 — 7], it is necessary to determine the normality of the distribution of the sample, to determine its randomness. Sources [1, P. 27; 4 pp. 14-15, 126; 6, pp. 140-143; 7, pp. 130 — 150] for the preliminary estimation propose to use averages, namely fashion, median, arithmetic mean, variance, root mean square deviation, coefficient of variation. In Proceedings [2 P. 554 — 604; 3 pp. 142-151; 5] are advised to use all the aforementioned averages, but in [3 P.145], depending on the measurement scale used, there are tips for more correct use of similar averages; — 151]. In the textbook [3, S. 151 — 155] to determine the randomness of the sample, depending on the normality of distribution, suggest the use of the criterion series, the criterion of «ascending» and «descending» series, the criterion of Abbe. Thus, for the preliminary analysis of the obtained data, we will use the following indicators: fashion, median, arithmetic mean, variance, root mean square deviation, coefficient of variation, selective asymmetry coefficient, selective excess factor and, depending on the normality of the sampling distribution. For all three hypotheses, using the Excel software package, the above indicators were calculated, the results of which are presented in Table 2. for preliminary analysis of the obtained data we will use the following indicators: fashion, median, arithmetic mean, variance, root mean square deviation, coefficient of variation, selective asymmetry coefficient, selective excess factor and, depending on the normality of distribution, randomness indicators. For all three hypotheses, using the Excel software package, the above indicators were calculated, the results of which are presented in Table 2. for preliminary analysis of the obtained data we will use the following indicators: fashion, median, arithmetic mean, variance, root mean square deviation, coefficient of variation, selective asymmetry coefficient, selective excess factor and, depending on the normality of distribution, randomness indicators. For all three hypotheses, using the Excel software package, the above indicators were calculated, the results of which are presented in Table 2.
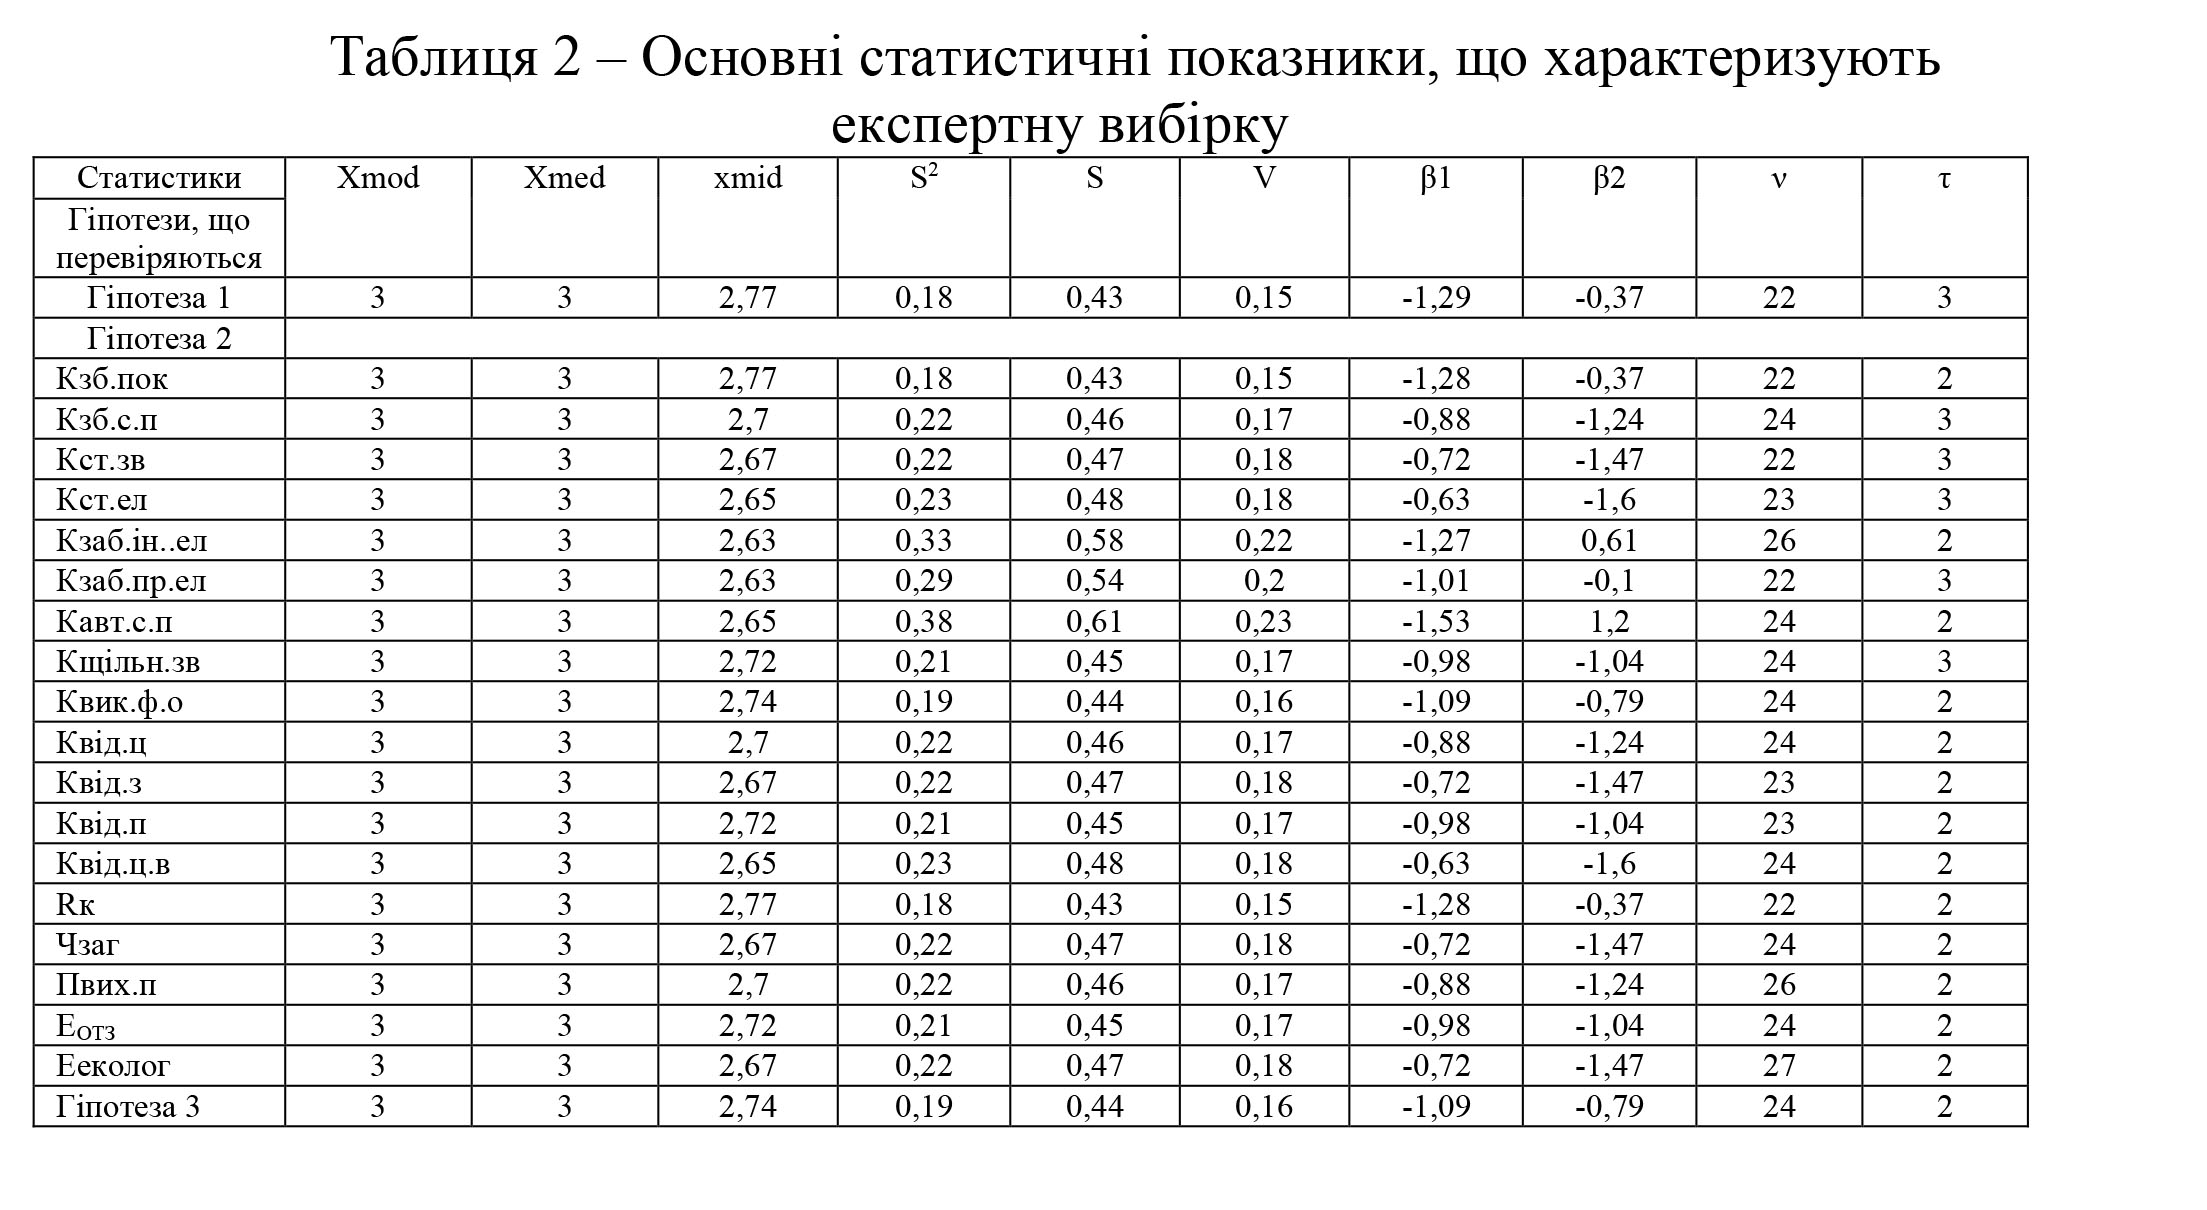
There are also several methods, or rather, indicators, to test the consistency of expert opinions. However, one way or another, all authors state that the degree of coherence of the opinions of experts or ordinary respondents is very much related to the study of the central tendency, that is, how private the opinions of experts are scattered around from the real or theoretical center of a given variational series [1, S. 26; 4 pp. 14-15; 6, S. 144; 7, pp. 134-135]. While it should also be emphasized that in the case of experts’ surveys, some scientists point to caution when applying the central trend, since the vision of some experts, although not dominant and may differ not only from the private opinions of other experts, but also the central trend of this sample, can be true or more correct, or more creative, interesting, etc. [8].
The analyzed sample of experts’ opinions regarding the hypotheses showed that there are no specific opinions, which are very different from others, so it is possible to use traditional statistical indicators to check their consistency.
Various authors propose to use the following statistics: the coefficient of concordance ( variance and entropy[6, pp. 144-146; 7, pp. 136 — 138], Spearman’s rank correlation coefficient [7, pp. 139 — 140], Kemeni’s median [1, pp. 25 — 29], coefficient of variation [4 pp. 126 — 128], null and alternative hypotheses on the subject of «harmonization of the investigated frequencies of the distribution of the hypothetical general population», [2, pp. 608 — 614; 3, P.156-160]. However, the same coefficient of concordance and Spearman’s rank correlation coefficient are a test of the null and alternative hypothesis of «independence and uniform distribution of expert opinions across the plurality of all rankings» [1, P. 27; 8, P.140]; and the authors of the aforementioned sources express their doubts about the possibility of verifying the consistency of opinions with these criteria.
In [1], it is explicitly stated that the coefficient of concordance can only be applied when «the consistency of the experts’ opinions on several alternatives affecting one end result is revealed». Based on the content of the coefficient of concordance and the Spearman’s rank correlation coefficient, we can conclude that their use in checking the consistency of thoughts in our case is not possible, since we, first, do not study alternatives, and the study is incomparable, second, it does not have one end result, but there are independent hypotheses, third, the ranking on the studied issues should be somewhat independent, because each question is not directly related to the other, fourth, even distribution in the given this case does not indicate that the answers are random,
The Kemeni median, as evidenced by the source data [1, P. 26], is also used in the presence of alternative data, that is, in the comparative nature of the expert survey, and we have it incomparable, so this indicator can also not be used to check the consistency of opinions.
In the monograph [4, pp. 126 — 128], the authors propose to apply a coefficient of variation, which is then compared with its allowable value for a given sample, calculated on the basis of the Student’s t test and confidence interval. However, the same source lists the recommended values of the coefficient of variation, which characterize the degree of consistency of the experts’ opinions, and which have been calculated on the basis of practical experience with the experts. Therefore, this indicator can be used to check the opinions of experts for consistency.
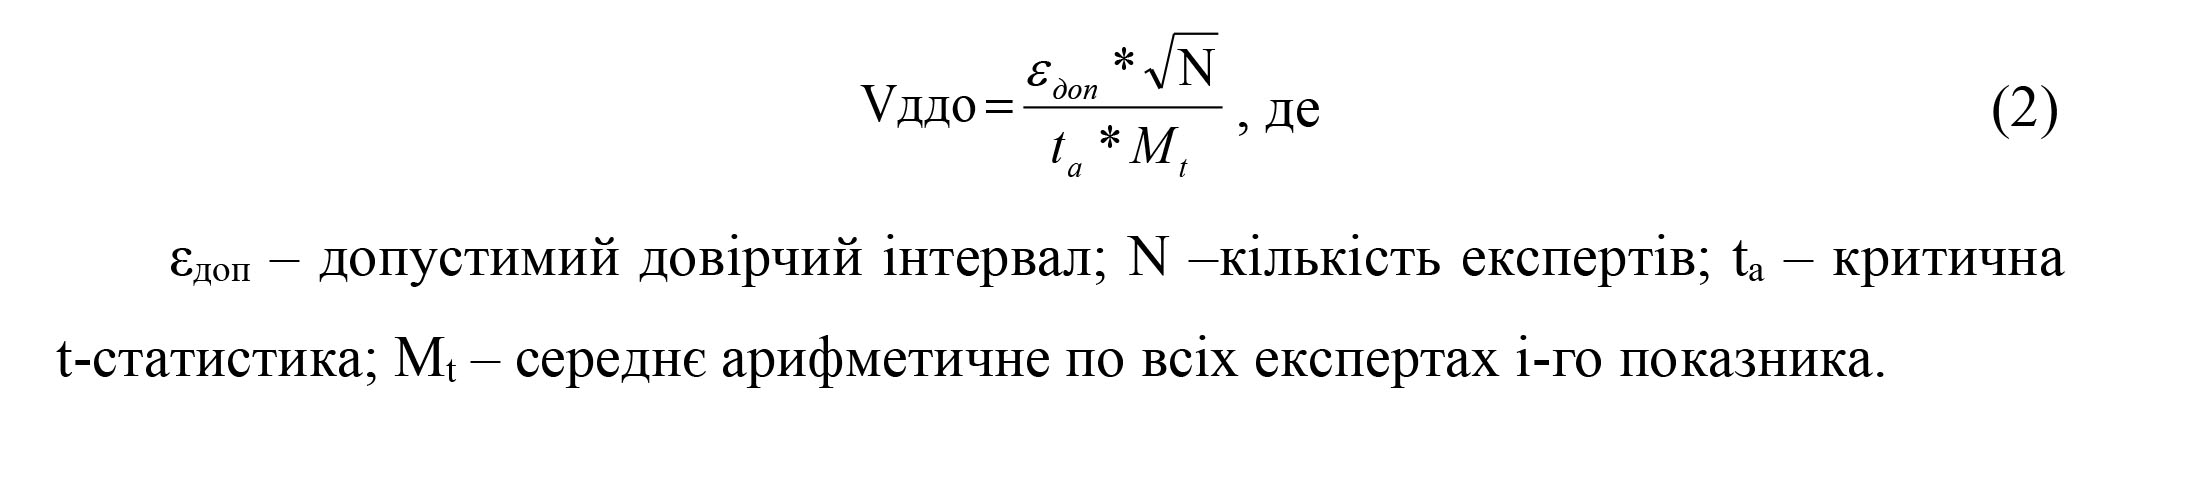
In sources [2, pp. 608 — 611; 3, pp. 156 — 158] state that with the help of the null and alternative hypothesis it is possible to carry out the so-called statistical test, which results in finding out whether «the obtained data reflect real processes, or whether they are caused by random factors». In our case, the coherence of the experts’ opinions can be interpreted as a hypothesis that the average of the general population, that is, the opinion of all managers, specialists and scientists, will be close to the average of our sample (expert group), that is, the opinions expressed by our experts. The use of the average is related to the type of measurement scale and according to it the data obtained by us: since the scale is interval and numerical data in the form of points, and, given the incomparable, monodic nature of the examination, we are on the recommendation of the manual [3 P. 163 — 168] we use one-dimensional statistical analysis in the form of the average test, namely, conduct a Z-test or t-Student. Since our statistics are of the metric type, this enables them to carry out with them all operations required by mathematical science, including rounding. Thus, we can predict that if the arithmetic mean of the experts exhibited is higher than 2.45, then by mathematical law it will weigh up to 3 points, and thus the answer is «yes» and, conversely, if the arithmetic mean is below 2, 45 — will weigh up to 2 points, which means that the answer is «partially», which will not allow us to introduce our hypotheses to life. Therefore, the theoretical average that must be tested cannot be lower than 2.45. Since our statistics are of the metric type, this enables them to carry out with them all operations required by mathematical science, including rounding. Thus, we can predict that if the arithmetic mean of the experts exhibited is higher than 2.45, then by mathematical law it will weigh up to 3 points, and thus the answer is «yes» and, conversely, if the arithmetic mean is below 2, 45 — will weigh up to 2 points, which means that the answer is «partially», which will not allow us to introduce our hypotheses to life. Therefore, the theoretical average that must be tested cannot be lower than 2.45. Since our statistics are of the metric type, this enables them to carry out with them all operations required by mathematical science, including rounding. Thus, we can predict that if the arithmetic mean of the experts exhibited is higher than 2.45, then by mathematical law it will weigh up to 3 points, and thus the answer is «yes» and, conversely, if the arithmetic mean is below 2, 45 — will weigh up to 2 points, which means that the answer is «partially», which will not allow us to introduce our hypotheses to life. Therefore, the theoretical average that must be tested cannot be lower than 2.45. according to mathematical laws it will weigh up to 3 points, which means that the answer is «yes», and, conversely, if the arithmetic mean is below 2.45 — it will weigh up to 2 points, which means that it will not be possible to introduce the advanced we hypothesize to life. Therefore, the theoretical average that must be tested cannot be lower than 2.45. according to mathematical laws it will weigh up to 3 points, which means that the answer is «yes», and, conversely, if the arithmetic mean is below 2.45 — it will weigh up to 2 points, which means that it will not be possible to introduce the advanced we hypothesize to life. Therefore, the theoretical average that must be tested cannot be lower than 2.45.
The data of our sample, according to the values of the coefficients of excess and asymmetry, are not normally distributed, and this imposes some restrictions on the statistical procedures that can be used in their analysis. However, according to these sources [2, P. 611; 3, p. 184], since we have a large sample (<30), we fall under the central limit theorem and can use Z-statistics to test the statistical hypothesis.
Therefore, for all 20 questions tested by us, the null hypothesis (H 0 ) will be the statement that the mean theoretical will be less than or equal to 2.44, ie H 0 : µ≤2.44, respectively, the alternative hypothesis states that the mean theoretical will be no less than or greater than 2.45, ie H a : µ> 2.44.
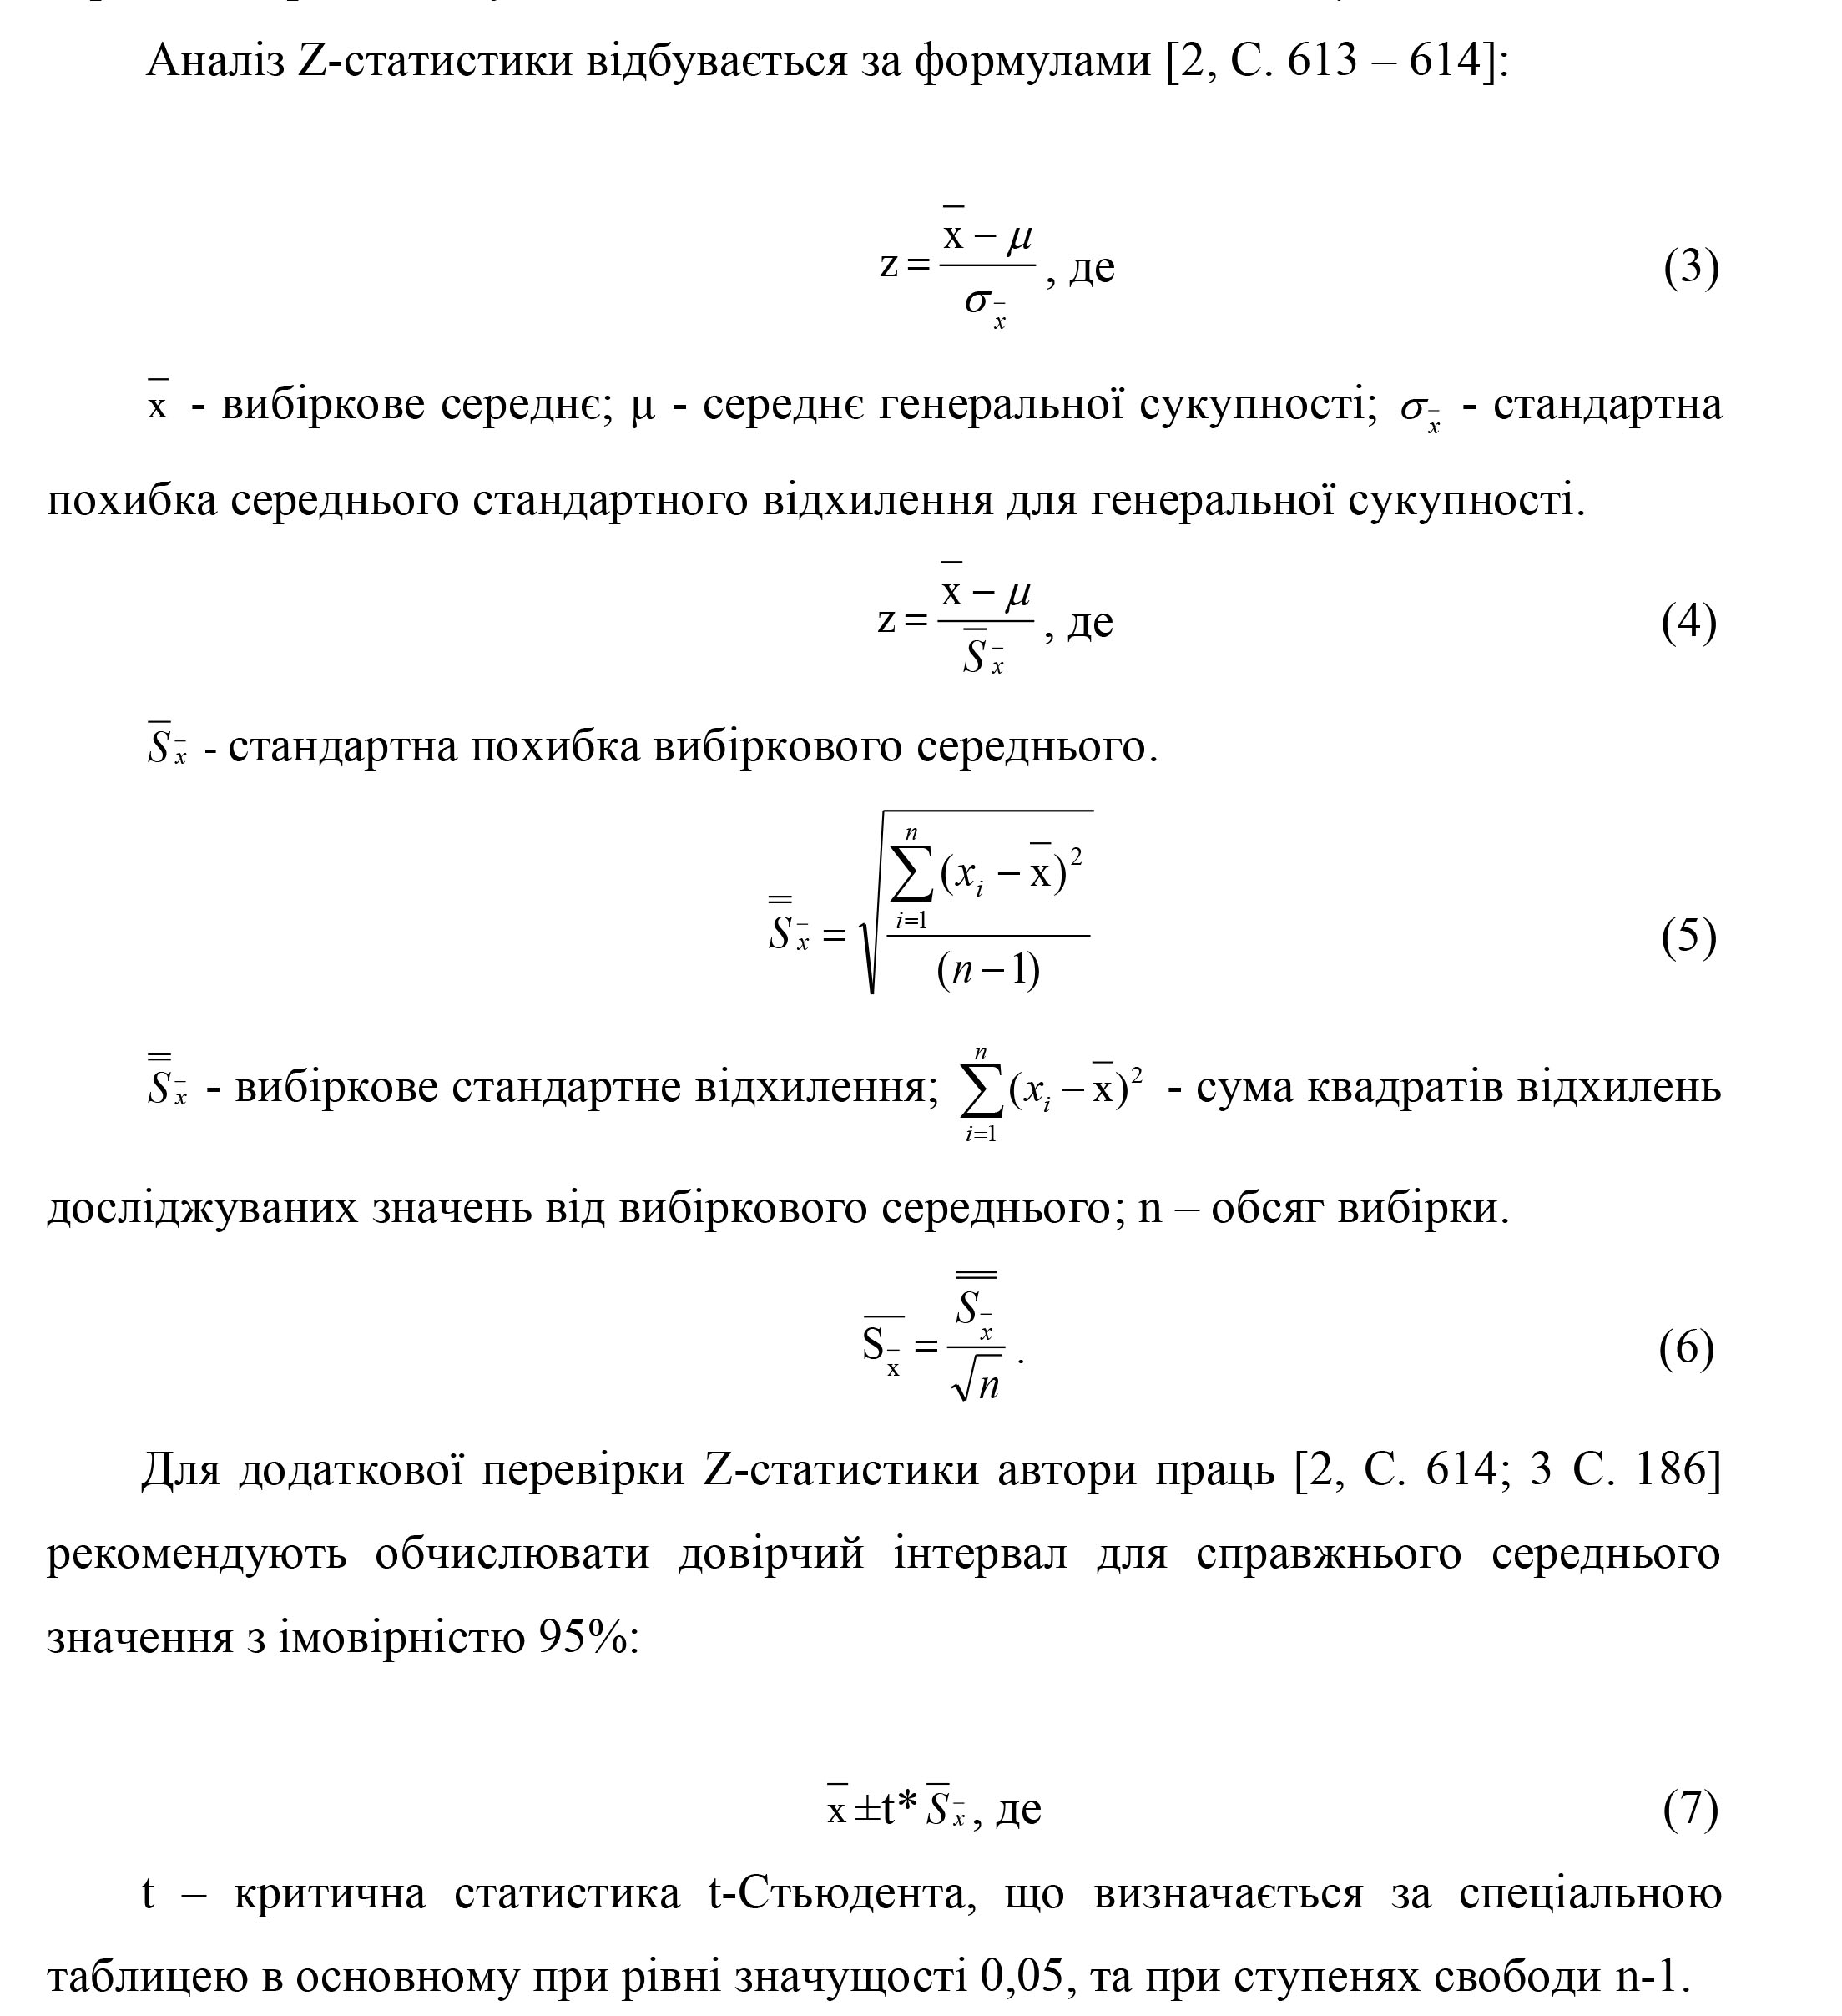
To check the Z-statistic data and confidence interval, the special features of the Excel application were used: Z-test, which shows the probability of an event, in our case exceeding the theoretical average of 2.45 and gravity up to 3 points; confidence interval that shows the range of the confidence interval from the arithmetic mean to one side and the other.
In calculating the confidence interval, a two-tailed test was used as the critical t- statistic, because it yields more accurate and correct results [3 P. 161], namely, at 42 degrees of freedom t crit = 2.02 (according to the table “Student critical points of distribution” »).
Table 3 presents the estimated data for verifying the consistency of expert opinions.
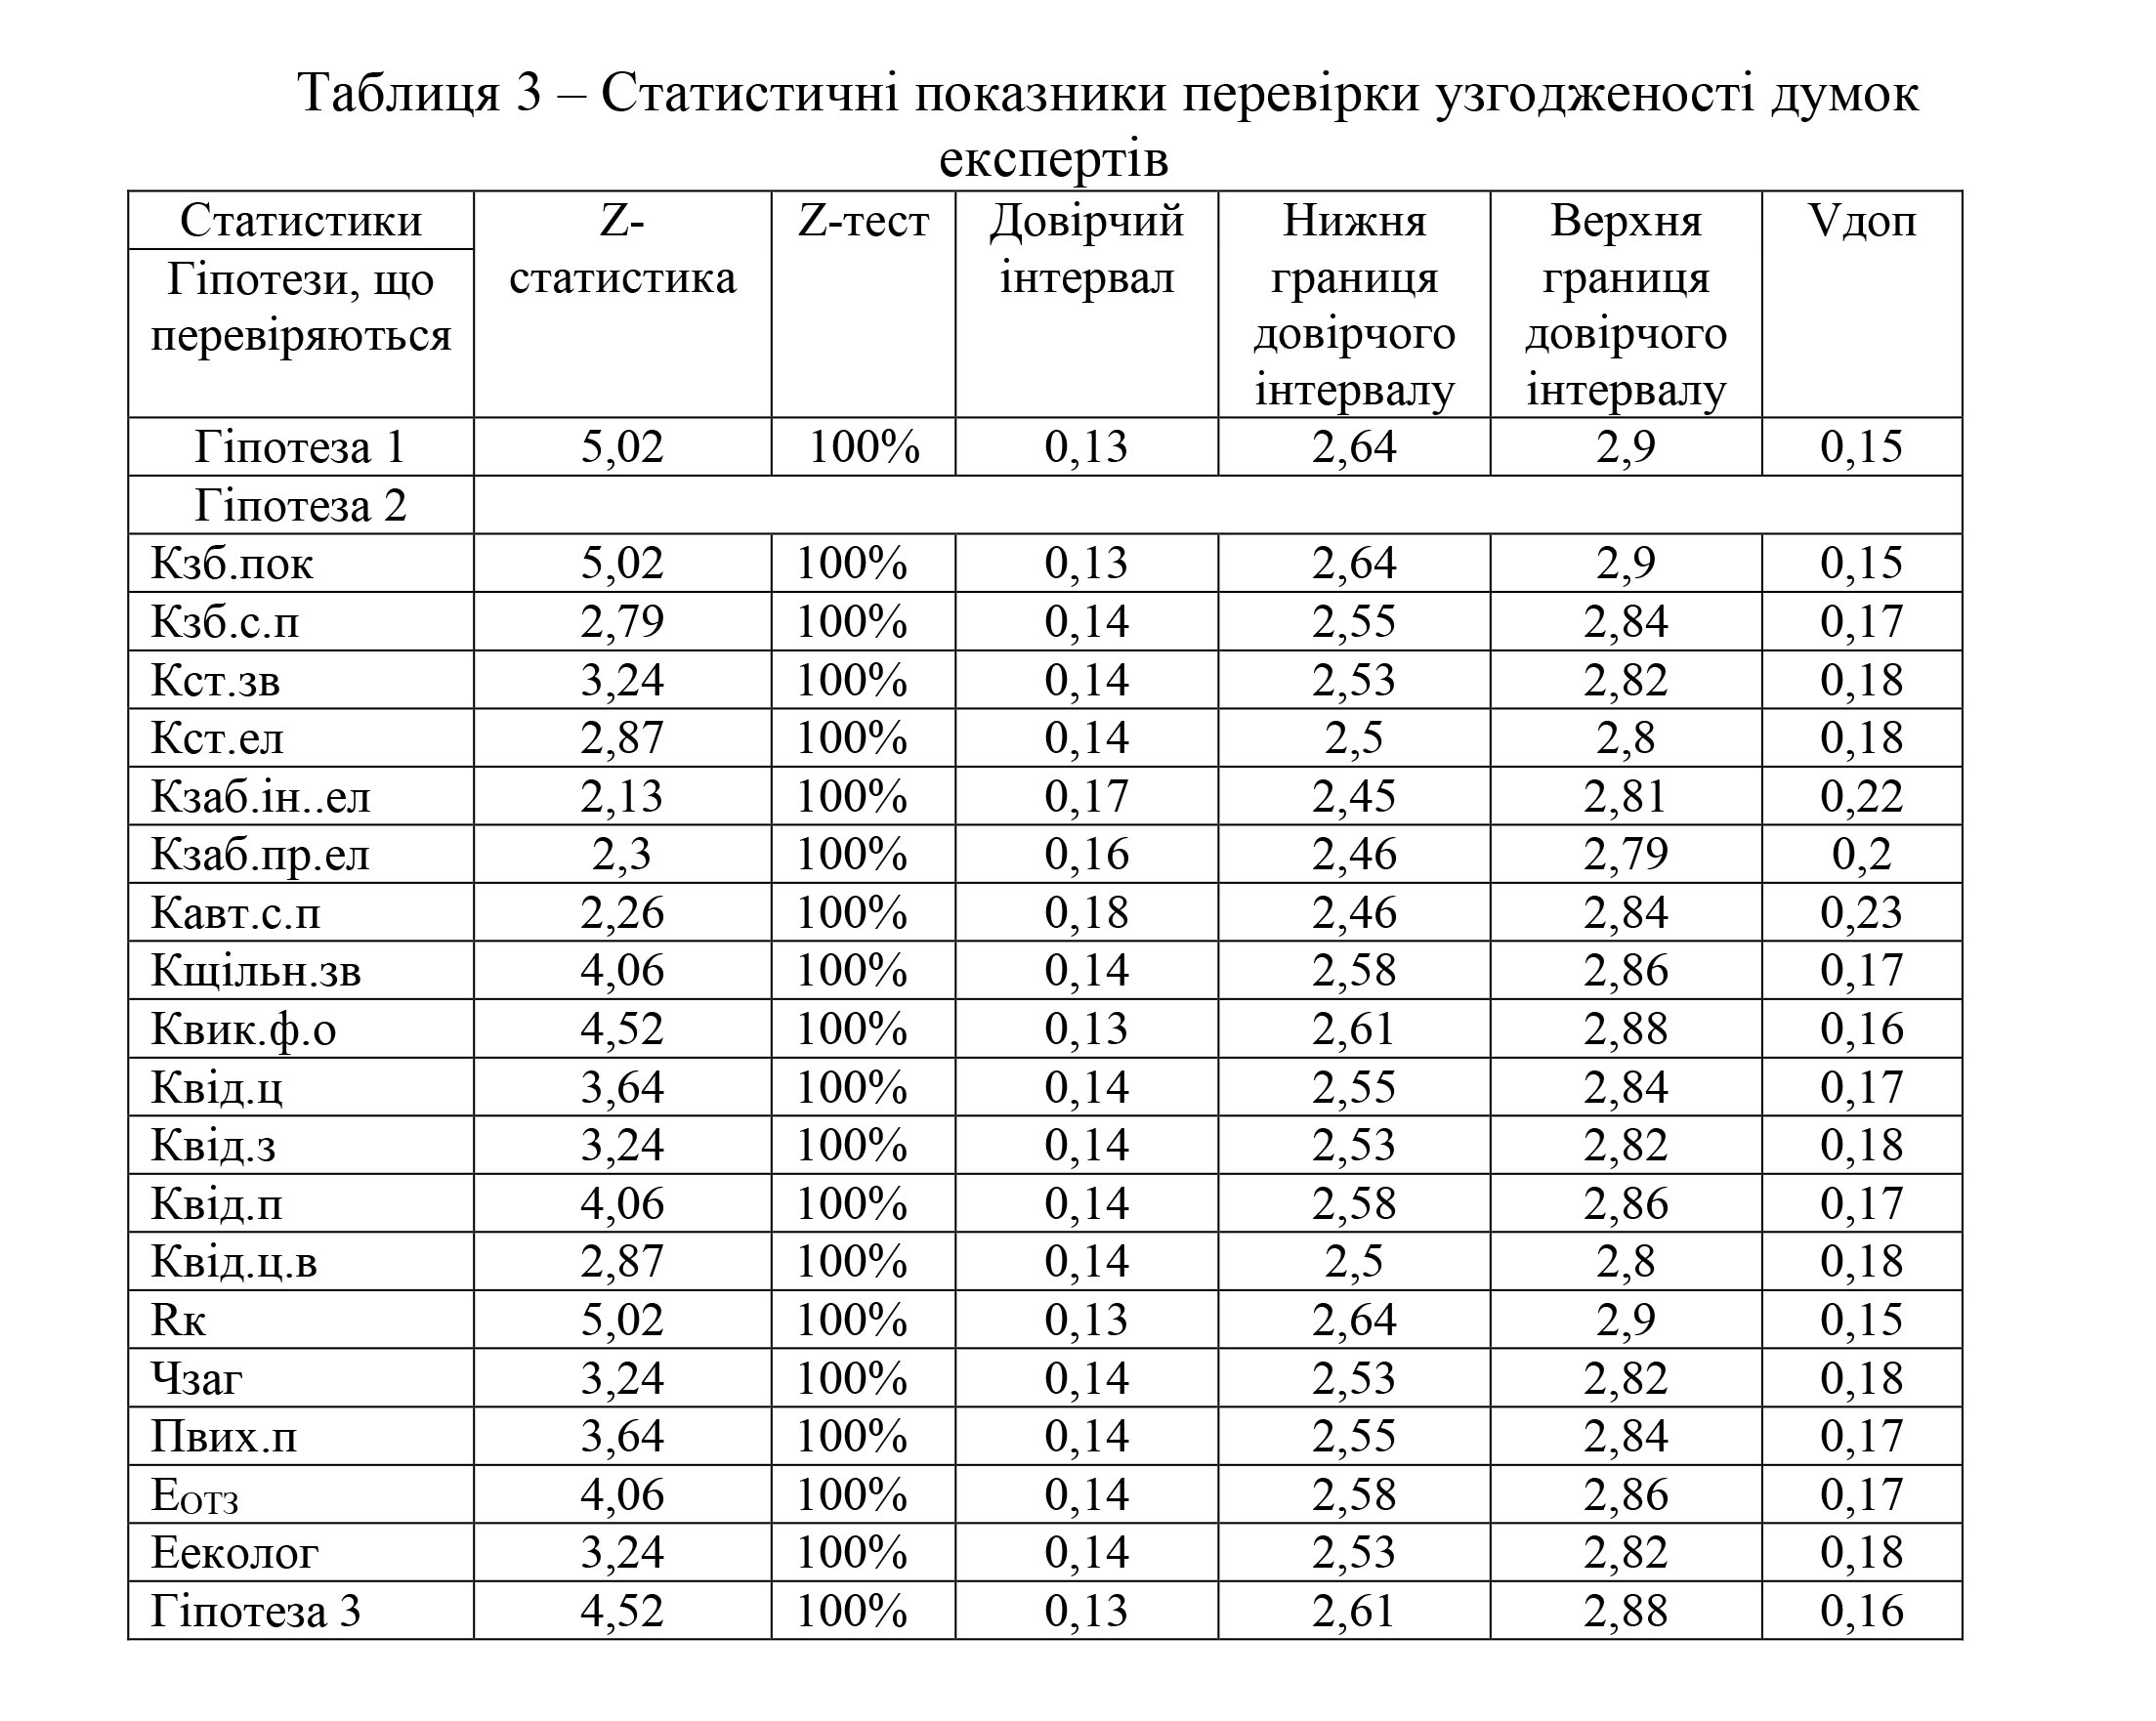
Obtained indicators of basic statistics and indicators characterizing the consistency of opinions of experts, allow us to draw the following conclusions:
1. Fashion indicators on all test questions correspond to the position of the highest score, that is, show that the most common answer of experts is 3 points, that is, indicates the correctness of the hypotheses put forward.
2. The median scores for all the questions being tested also correspond to the highest score of 3 and indicate that at least half + 1 vote from the experts give a positive answer to the hypotheses.
3. The arithmetic indicators of all the questions being tested are close to the highest score and, when rounded, correspond to it, ie they also indicate the gravity of the experts’ answers to the positive response to the hypotheses.
4. The scattering of experts’ answers around their mean, as evidenced by the variance and mean-squared deviations, is not significant, indicating a considerable frequency of identical (and in-depth analysis) positive answers provided by the experts.
5. The coefficients of variation on all the studied issues correspond to their admissible value, and also, considering the intervals of values recommended by the monograph [4, P. 126 — 128], indicate that the consistency of experts’ opinions is above average ( V = 0.11 — 0 , 15 ) and the mean ( V = 0.16 — 0.25).
6. The data of the Z-statistics and the Z-test on all questions indicate that the null hypothesis must be rejected and an alternative accepted, since the calculated data are above the critical t–Statistics equal to 2.02, which means that they are in the zone of failure.
7. The calculated confidence intervals on all questions confirm the fact that, if we interviewed all the experts we have assigned to the general population, the arithmetic mean of the hypotheses under study will not be lower than the allowable value of 2.45, and thus indicates a tendency of up to 3 points. which allows us to conclude that the hypotheses we have made are accepted.
We can conclude that all of our hypotheses have received positive feedback from the expert team and their provisions can be used to evaluate the effectiveness of the enterprise planning system.
Conclusions. P.The presented technology of organization of expert polls provides an opportunity to clearly and correctly carry out the assessment of various objects, subjects, processes or phenomena, in particular the planning process and the enterprise planning system, in isolation, ie in a non-comparable, tax-free form, which is very useful, especially in the conditions when information about similar objects, entities, processes, or phenomena is unavailable or worthwhile.
literature
1. V.N. Eitingon. Methods of organizing the examination and processing of expert assessments in management: a training manual / V.N. Eitingon, M.A. Kravets, N.P. Pankratova. — Voronezh, 2004 — 44 p.
2. Churchill R. Marketing Research / P . Churchill — St. Petersburg: 2001 — 850 s.
3. Kosєnkov S.І . Marketing Doslezhennya / S.І. Kosєnkov — K: Scarbi .: 2004 — 464 p.
4. Reichman EP Expert methods in assessing the quality of goods / Raikhman E.P., Azgaldov G.G. — M .: Economics, 1974. — 151 p.
5. Marketing research. [Electronic resource] / Access mode to the site: www . mngt . ru
6. Khakhanova DN Basics of qualimetry: a textbook / Khhamkhanov DN — Ulan-Ude: VSSTU Publishing House, 2003 — 142 p.
7. Kondrat I.Yu. Predicting the Economic Development of Small Enterprises: a Dissertation for the Candidate’s Degree in Economics: 08.06.01 / Kondrat Irina. — L., 2002. — 182 p.
8. LN Bolshev Tables of mathematical statistics / LN Bolshev, NV Smirnov — M .: Nauka, 1983. — 416 p.
Problems of development of competitive marketing strategy as a determining component of the control system of SE «Electrotyazhmash»
published in 2014 — Kh .: KhNUBA, 2014. — P. 156 — 161, © Nemtsov OV
The enterprise marketing strategy is intended to solve three complex problems:
1) selection of distribution channels (sales) of products, works and services produced and provided at the enterprise and appropriate selection of distribution bodies;
2) coherence with higher hierarchical and other marketing strategies such as product, pricing and communication strategies;
3) physical distribution of technological products in various international markets.
The first two objectives are to take into account the strategic concept of the company and the goals of marketing policy to identify their own and third-party sales in the domestic and foreign markets, to create on this basis sales channels and to coordinate their activities. Thus, taking into account the conditions and priorities of national markets and the corresponding distribution budget, which is defined within the strategic concept, an international well-functioning and controlled distribution system should be established. Such a network, especially in the case of high-tech goods, should provide the necessary related consulting, staff training and technical support services. The distribution (sales) network thus organized ensures the implementation of strategic decisions on the coverage and specific processing of international markets. In addition, such an organization makes it possible to prevent cross-deliveries as much as possible (from one channel to another or cross-shipments between countries with different price levels) and to avoid competition between own products.
It is the solution of these three problems that creates the preconditions for the enterprise’s marketing strategy to be competitive, in other words, in the process of solving the above-mentioned tasks, a competitive marketing strategy is implemented.
Choosing distribution channels or forming new ones, the manufacturer proceeds from the fact that each of them has its economically justified scope, its own structure and specialization, a specific purpose. As a result, by analyzing the distribution channels and choosing the most appropriate ones, the manufacturer proceeds from the general goals of the goods movement (delivery of the right goods at the right place and at the right time, and at the lowest possible cost) and the specific tasks that he needs to solve.
The primary point of creation of a commodity circulation system is to study the needs of real and potential buyers and competitors’ offers. Consumers are primarily interested in the timely delivery of goods, as well as the willingness of the supplier to meet the urgent needs of the customer, ensure the delivery of quality goods, take back defective goods and quickly replace them, provide first-class service.
The manufacturer should study the relative importance of its services in representing customers to specific products. Any variants of customer service policies must be consistent with competitors’ standards. Hence the criteria for choosing a distribution channel, based primarily on the comparison of cost analysis, as well as on the set of qualitative properties of such a channel, which allows a comprehensive assessment of the effectiveness of the existing sales channel (Fig. 1).
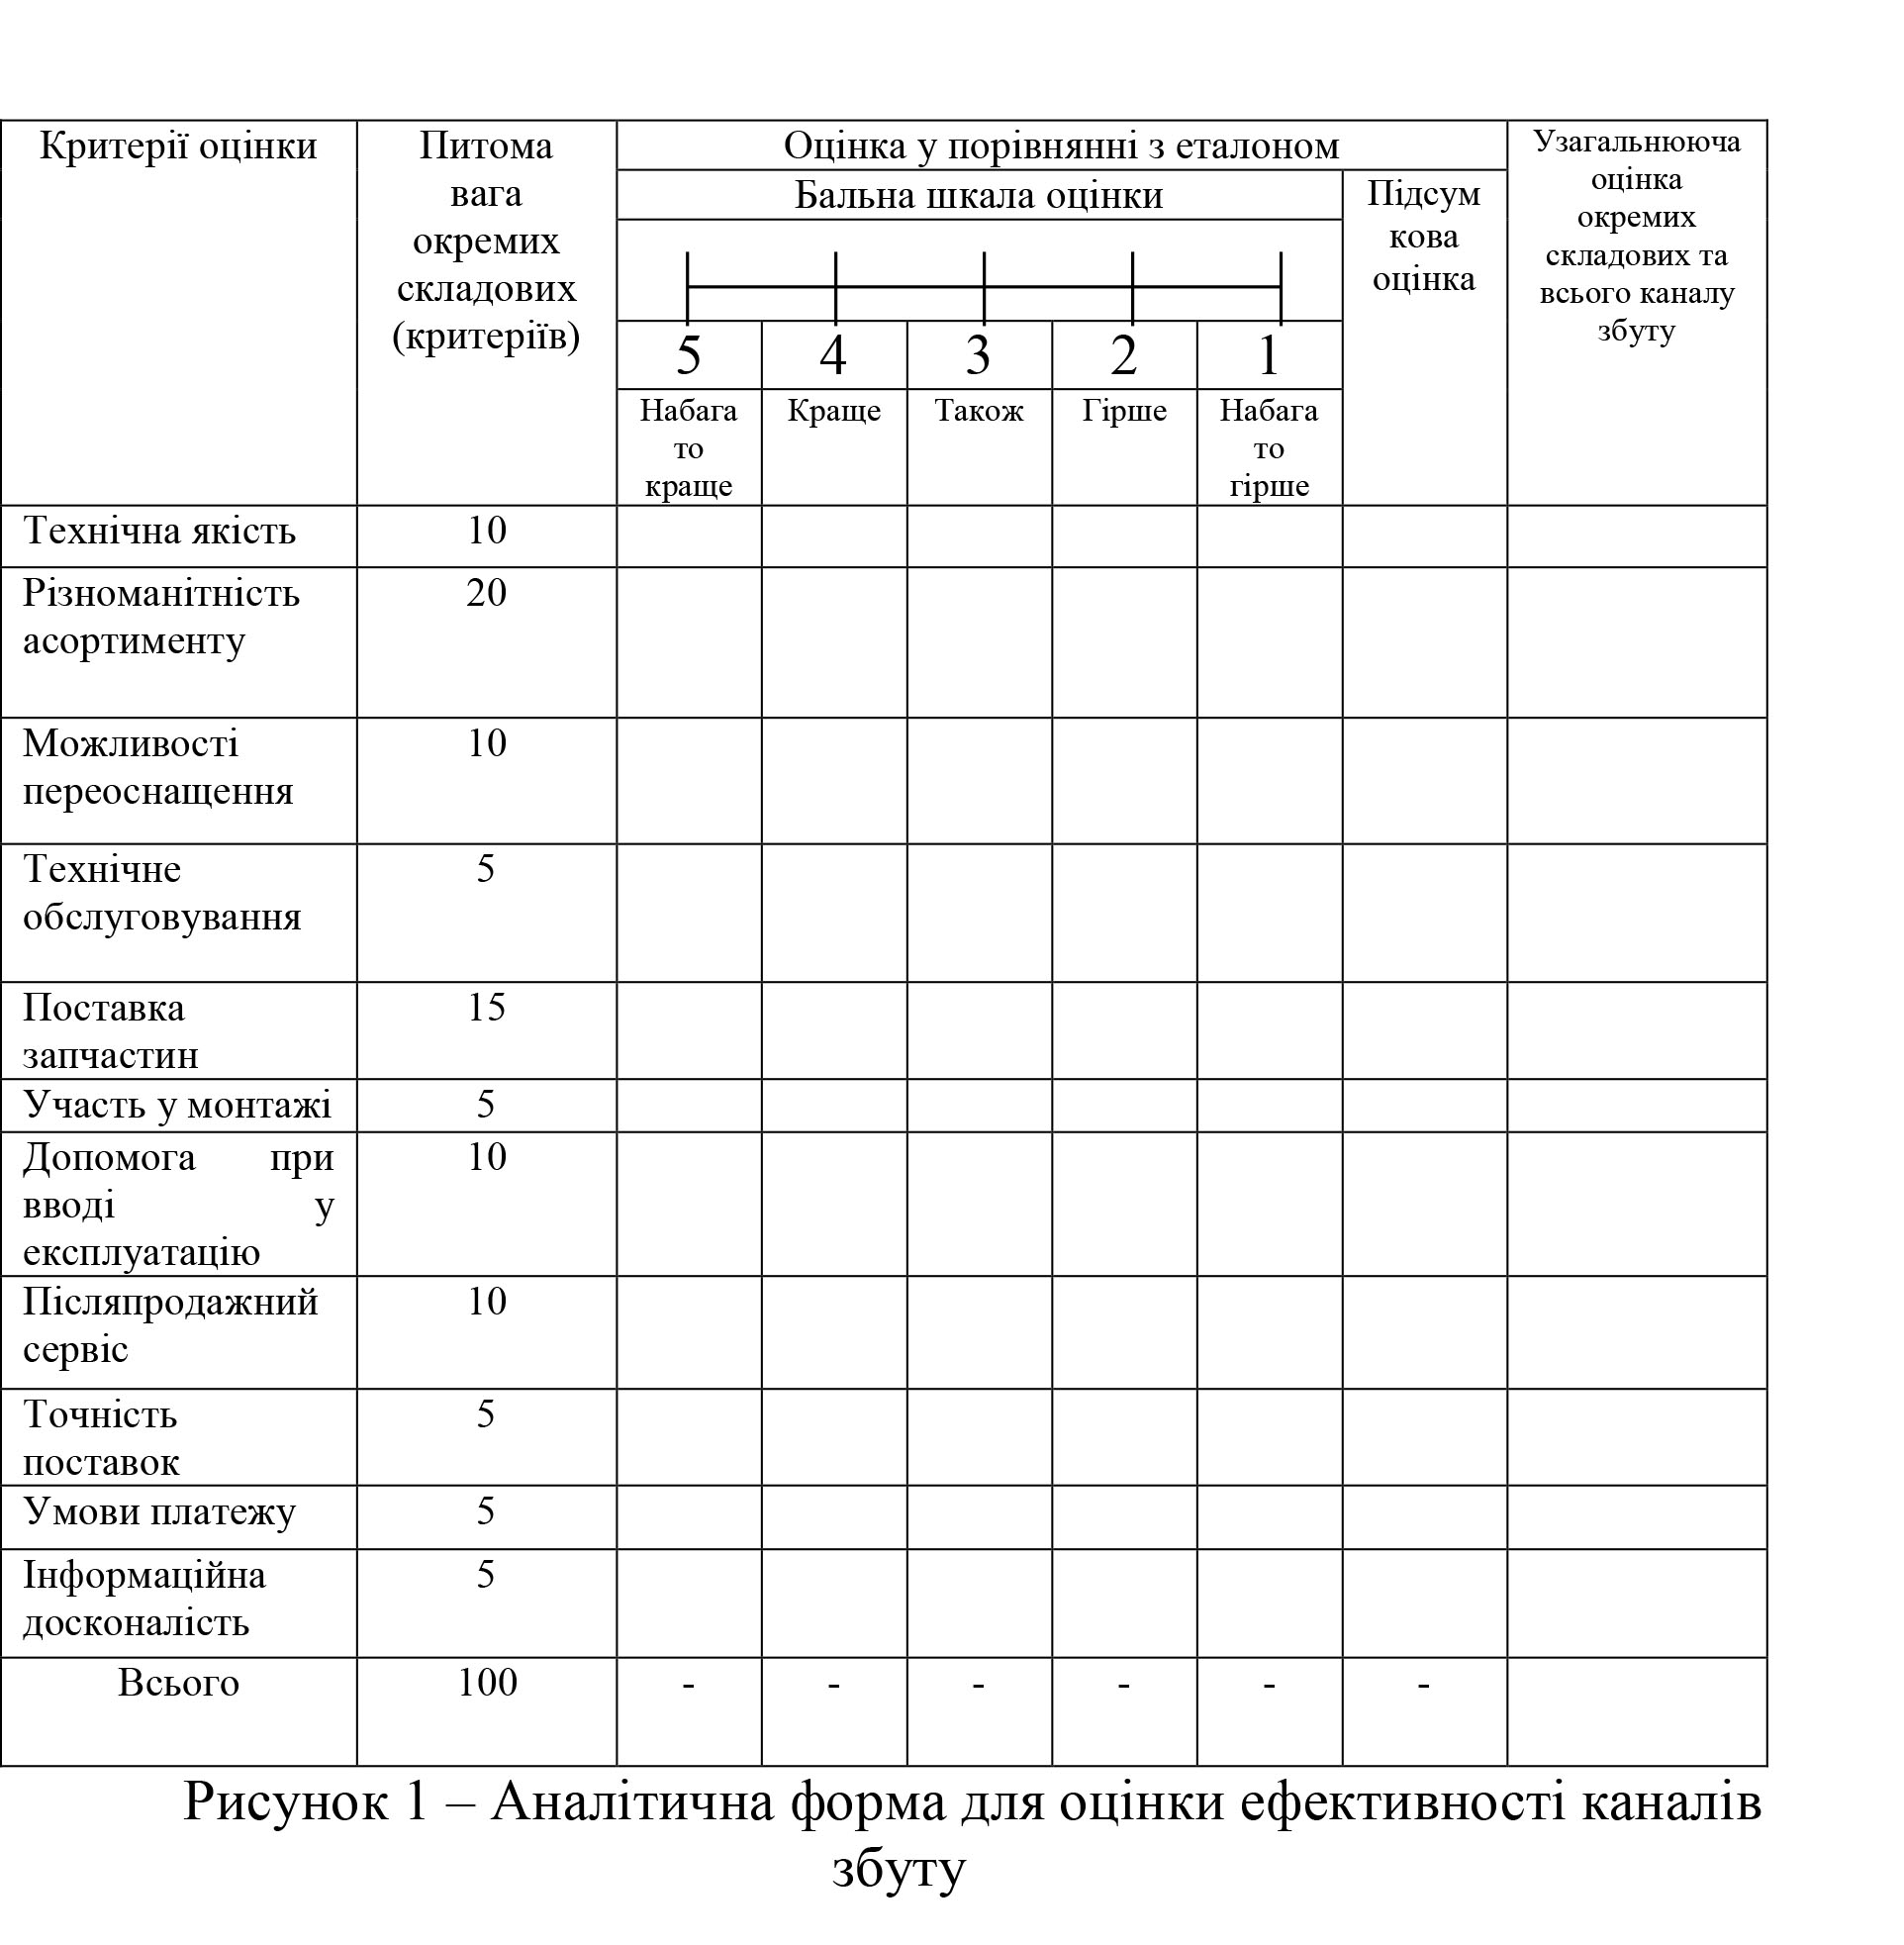
Sales of high-tech products are carried out, as a rule, not only in the domestic but also overseas markets. This is due to the fact that the research and development of such products requires considerable costs, which cannot be returned within the planned timeframe, most often in very narrow segments of the internal market. To this should be added the tendency of shortening product life cycles, which also forces the company to explore or consolidate foreign markets in order to ensure timely return on investments that went to develop such products. On the other hand, the international diversification of technology development, as well as the increasing internationalization of competition, is forcing the company to intensify its foreign economic activity. Therefore, most of the high-tech product sales have an international focus,
Therefore, the main issue of competition policy analysis is the analysis of distribution channels, which consists of an analysis of their architecture or system construction and a comprehensive analysis of their effectiveness. Figure 2 (3 — 9) shows the general scheme of the distribution channel architecture of SE «Electrotyazhmash».
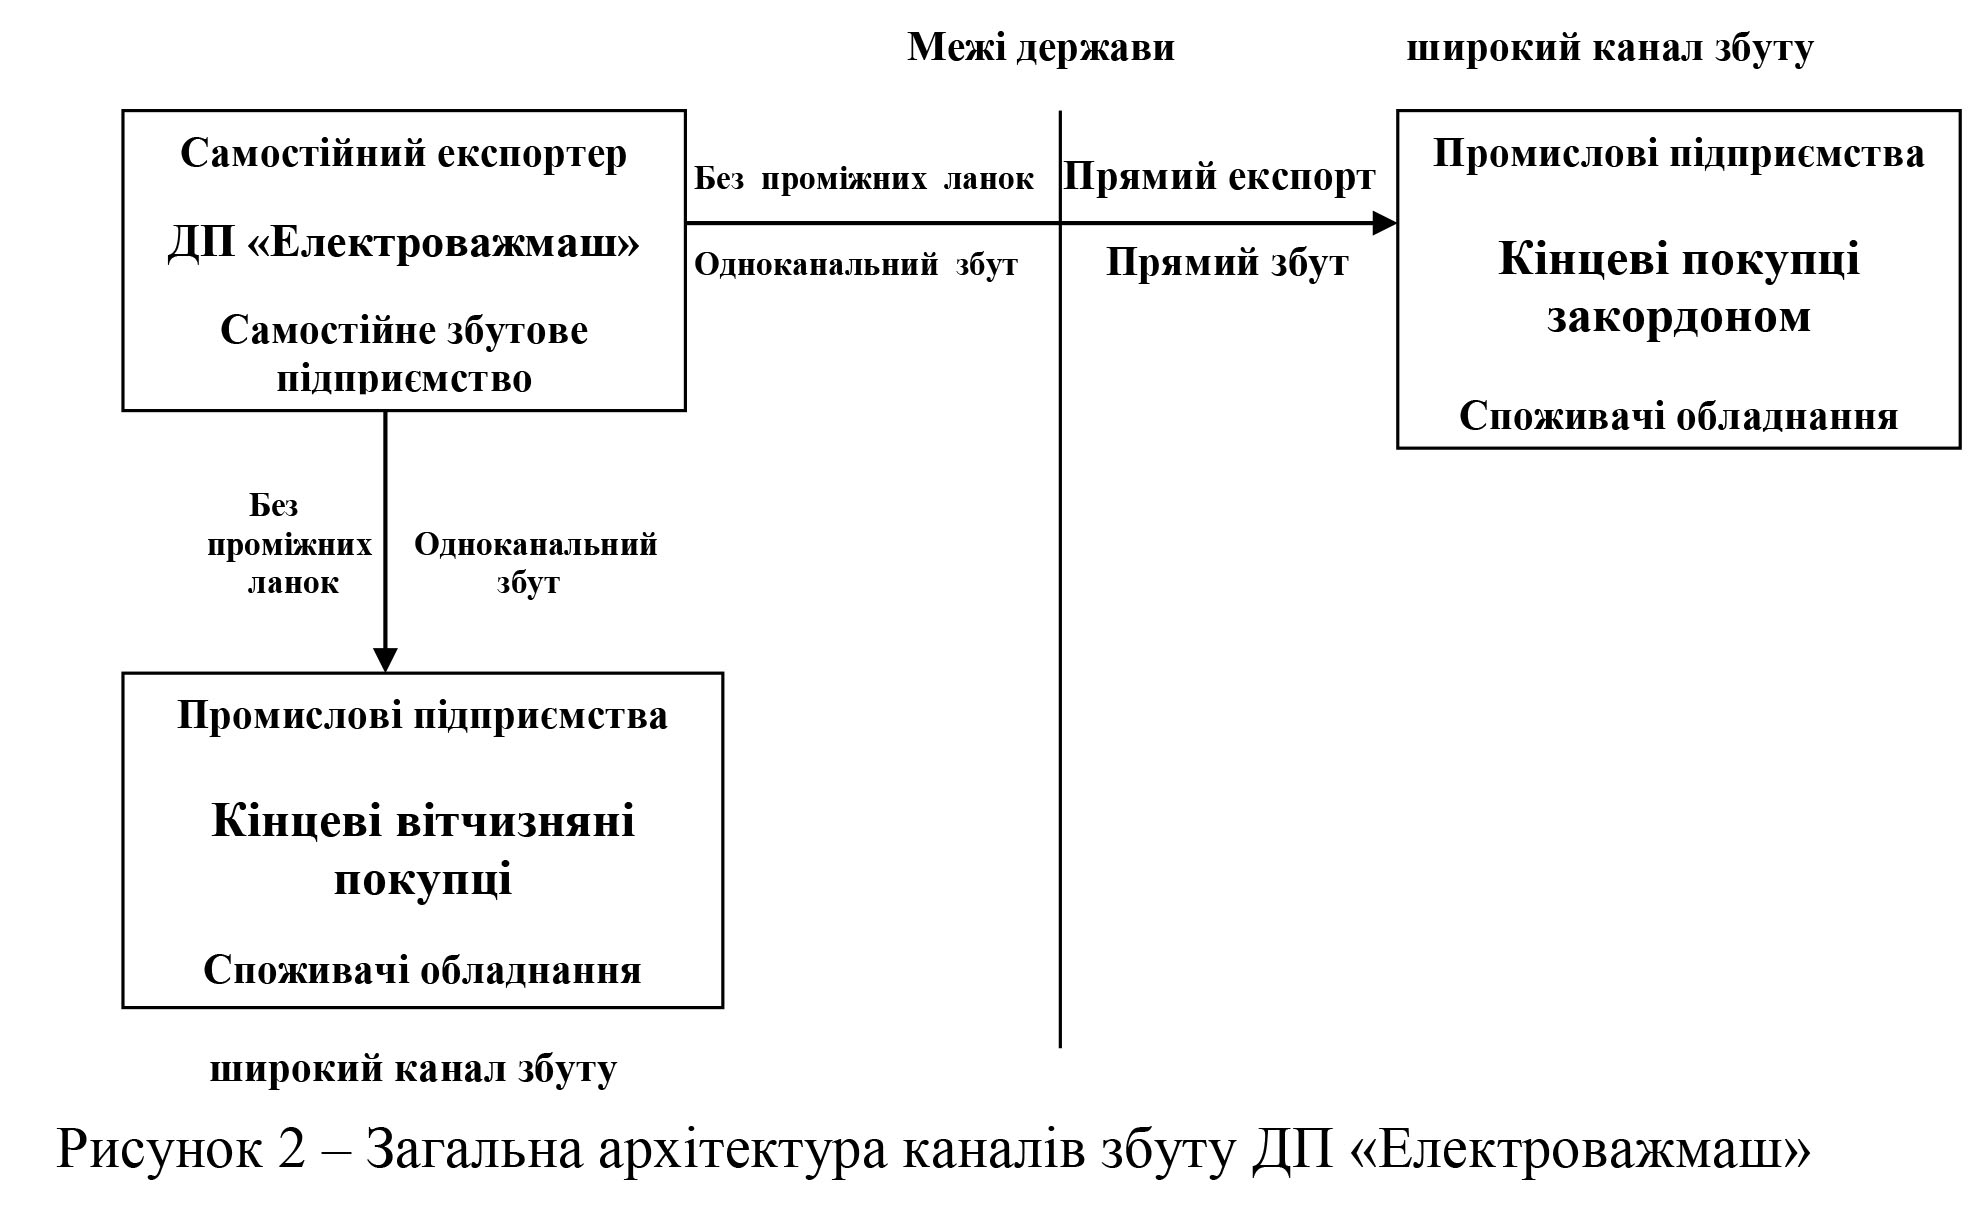
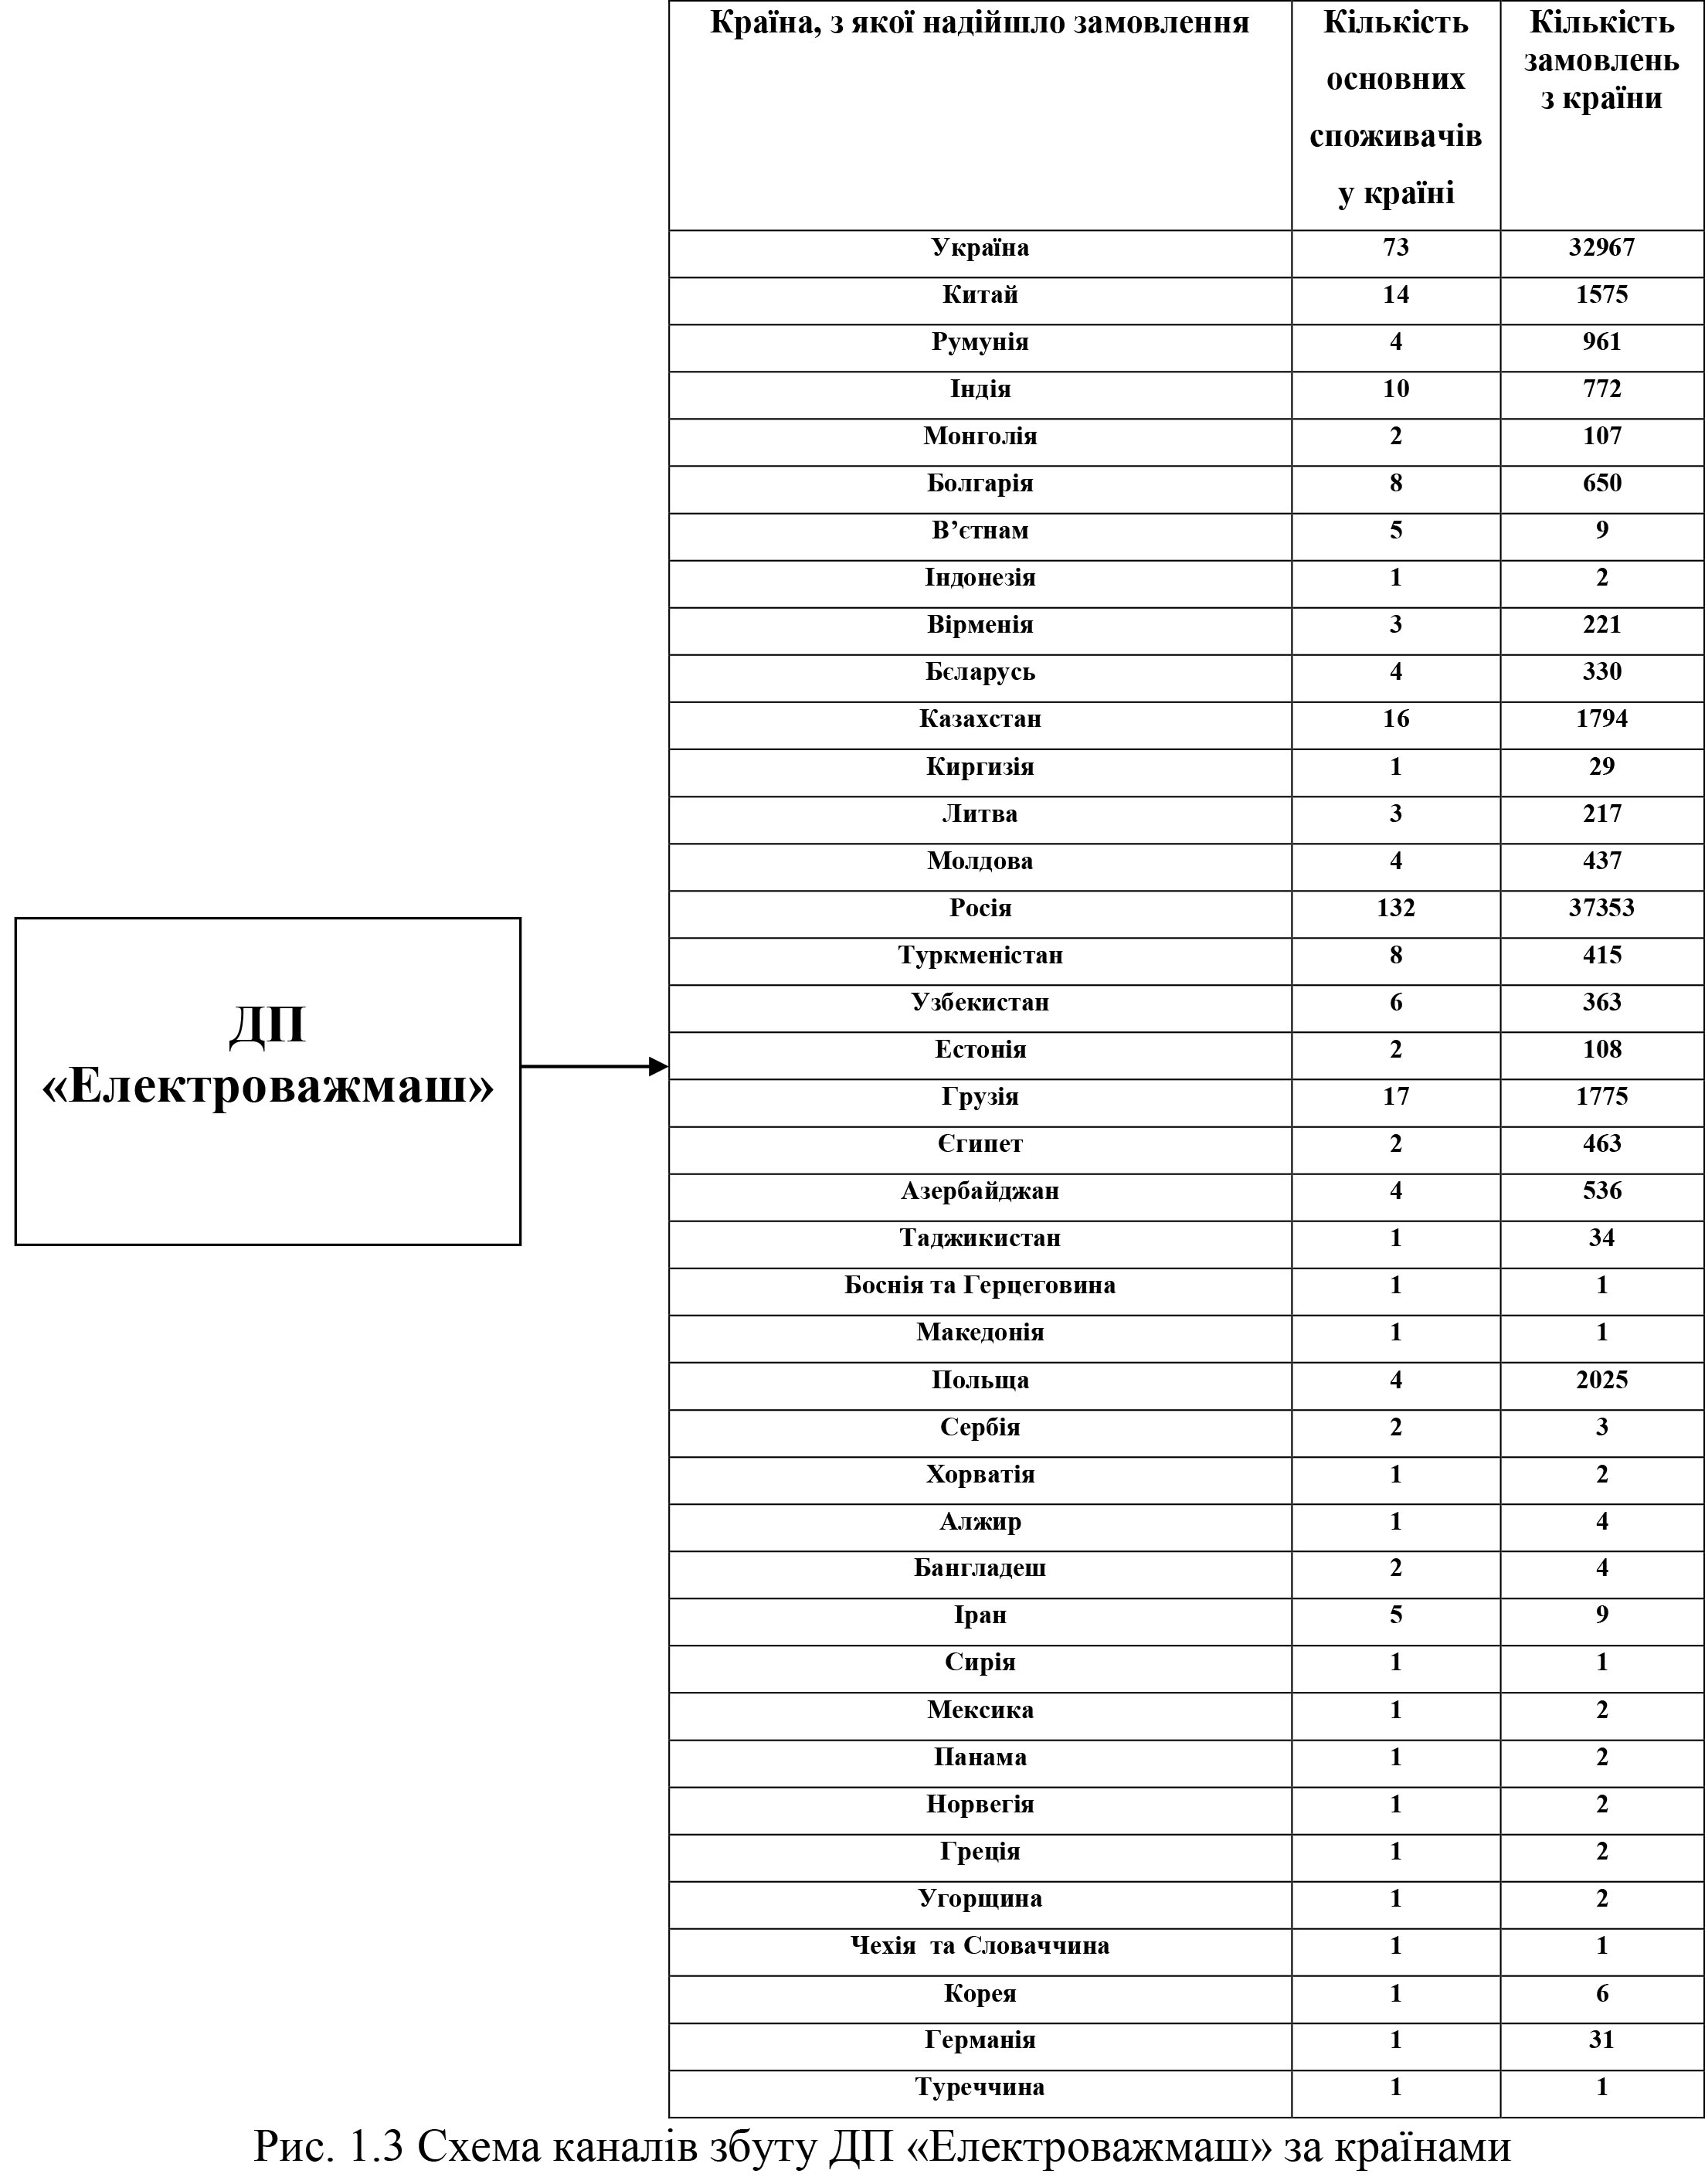
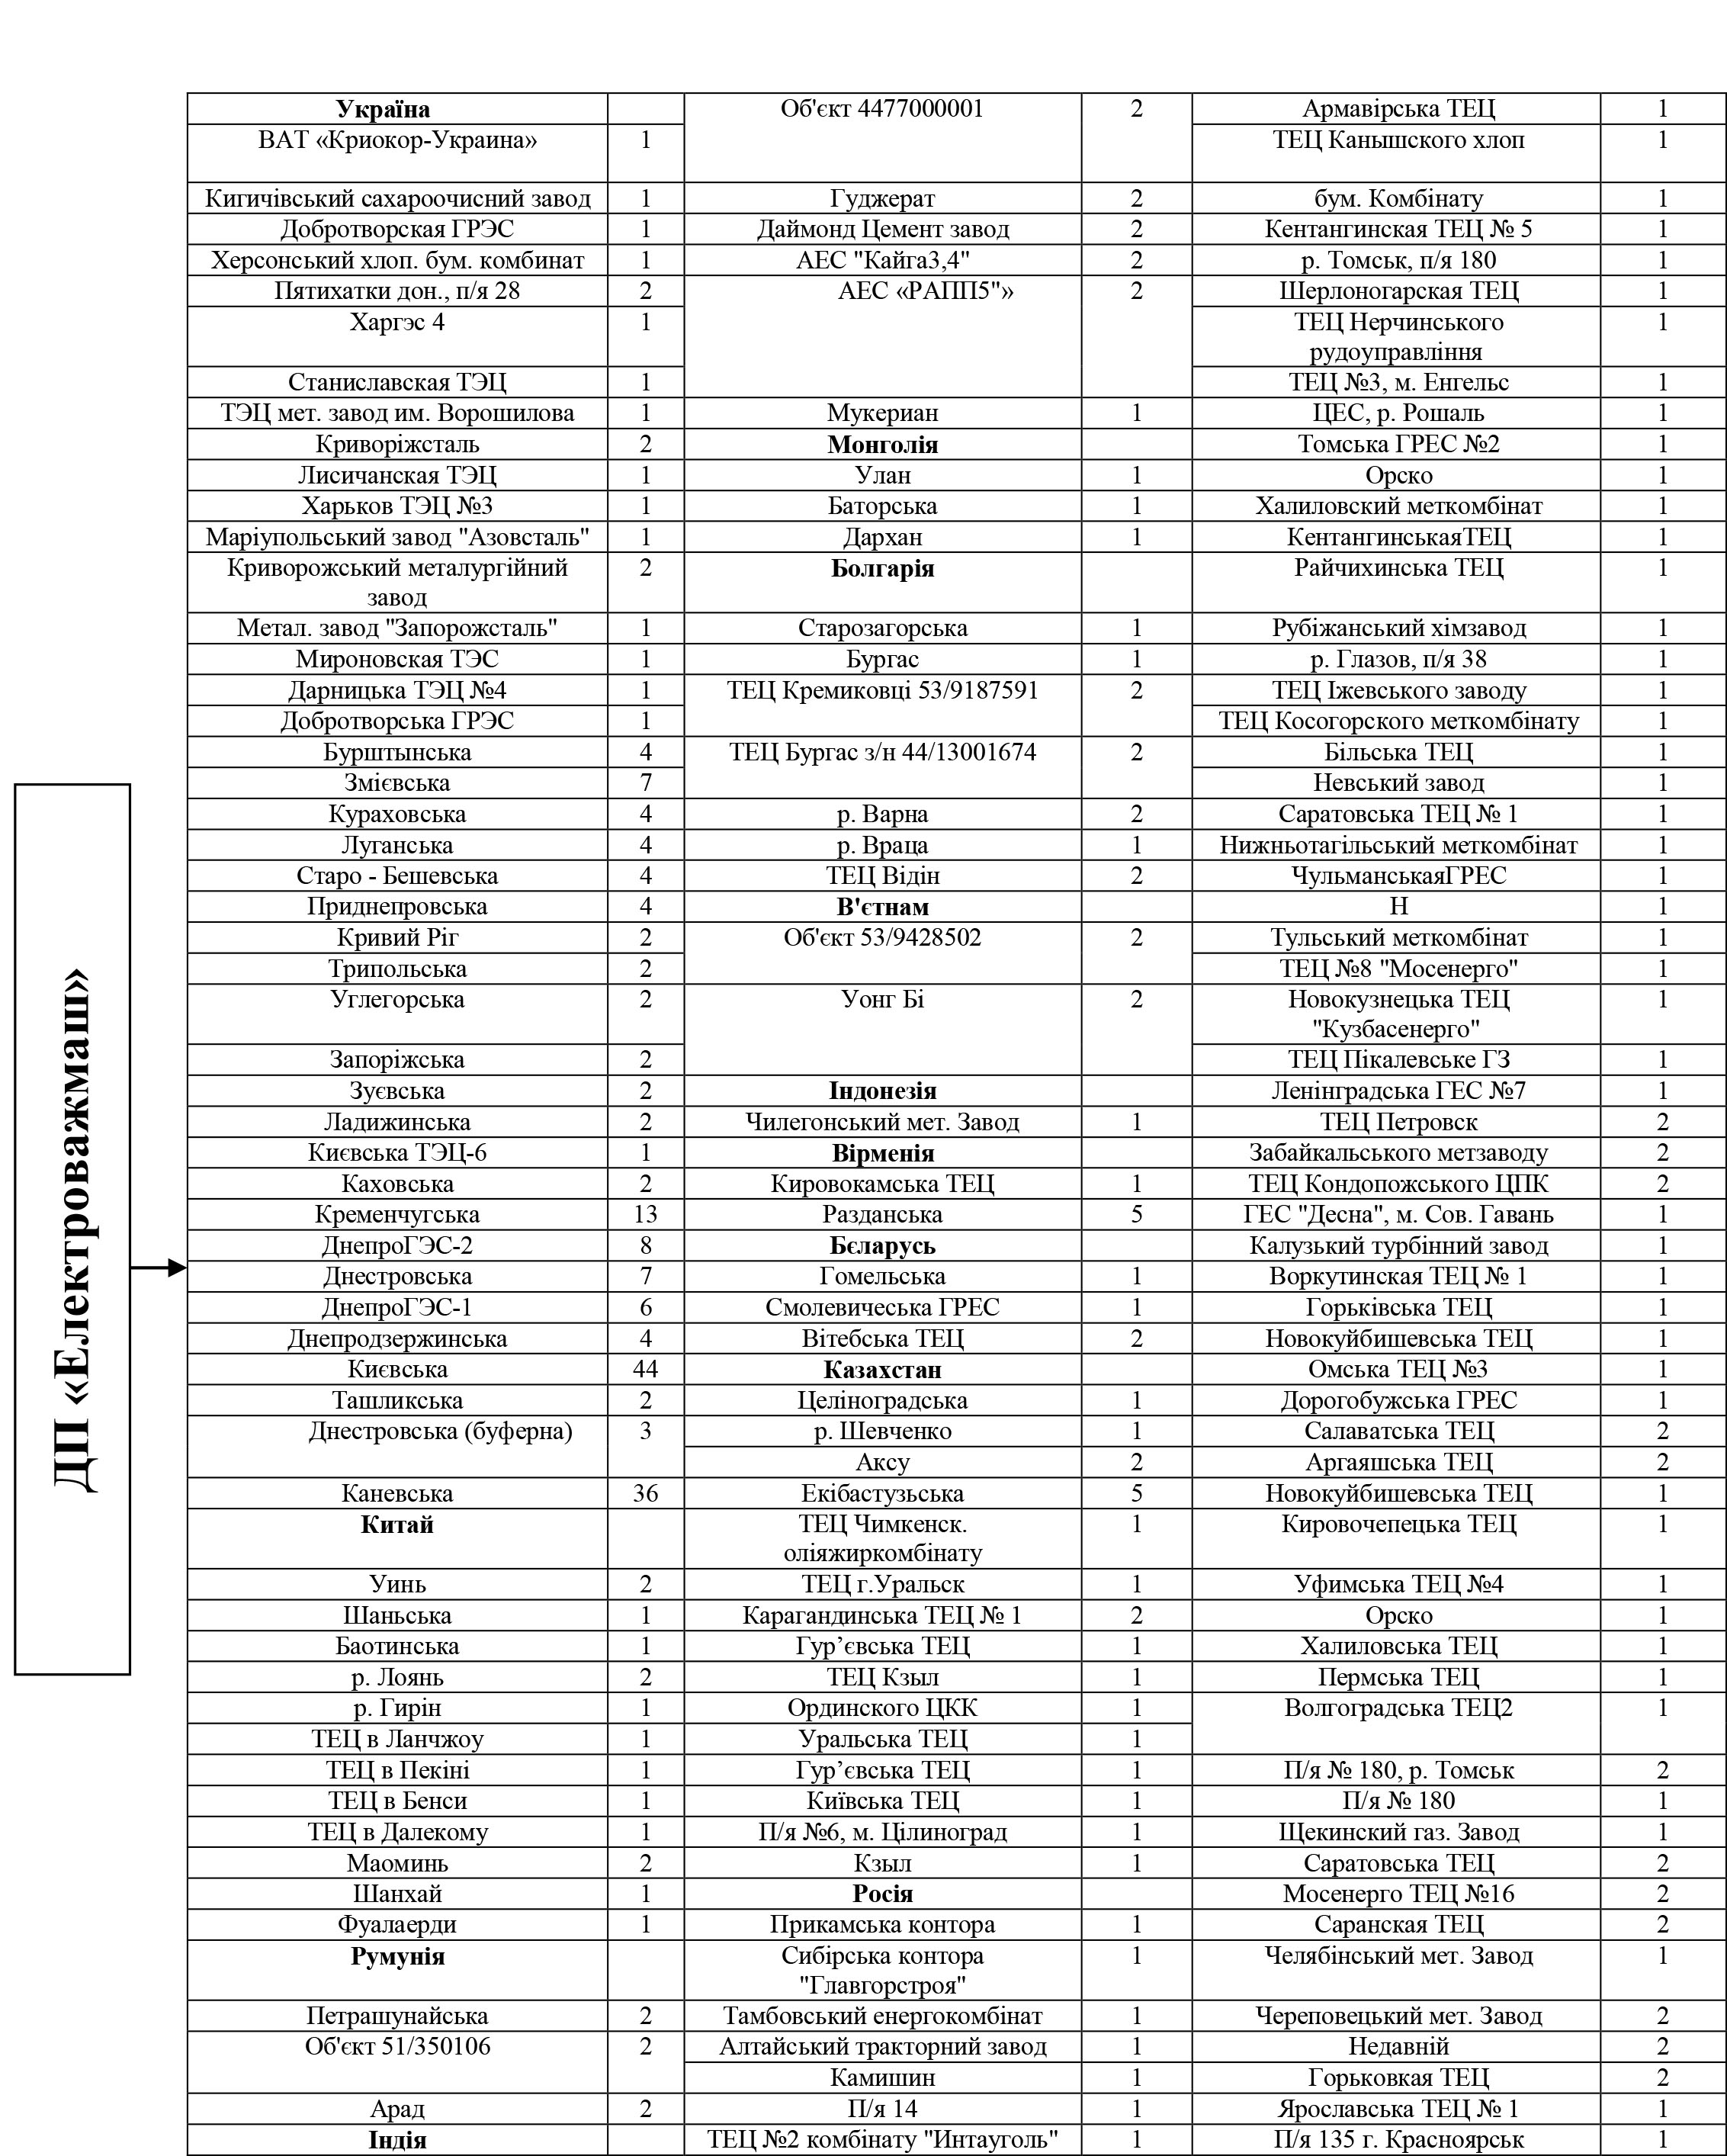
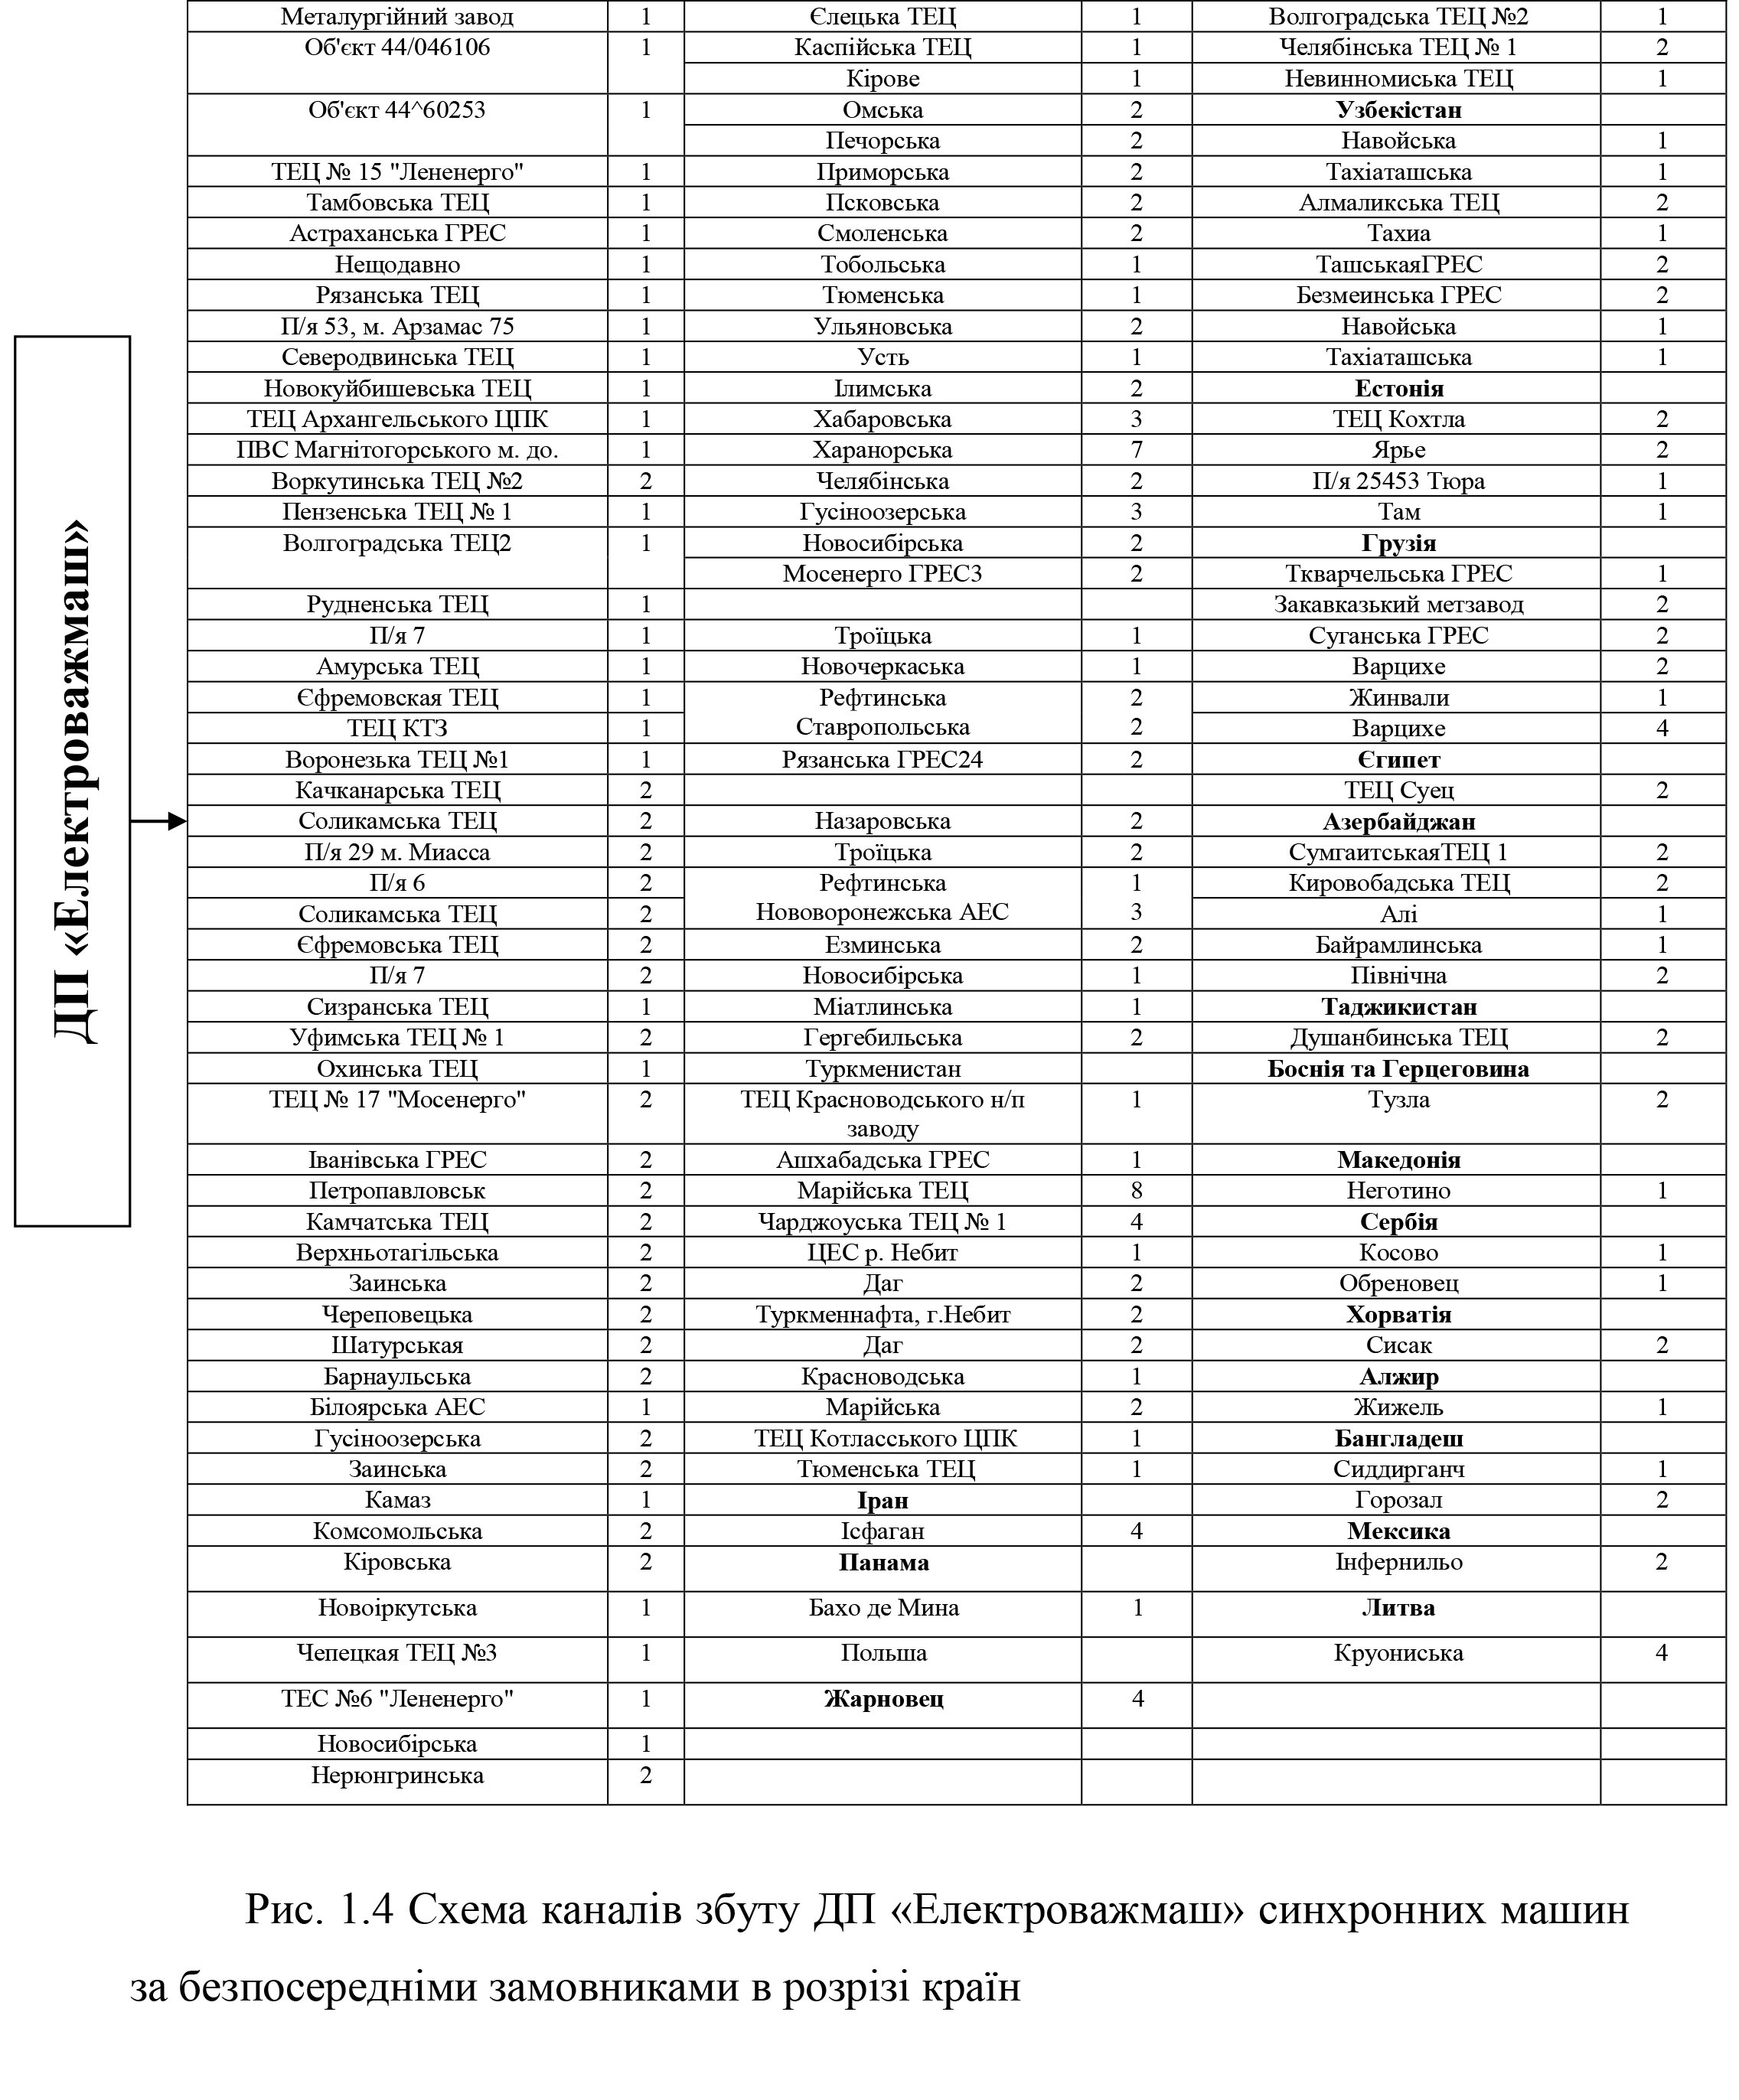
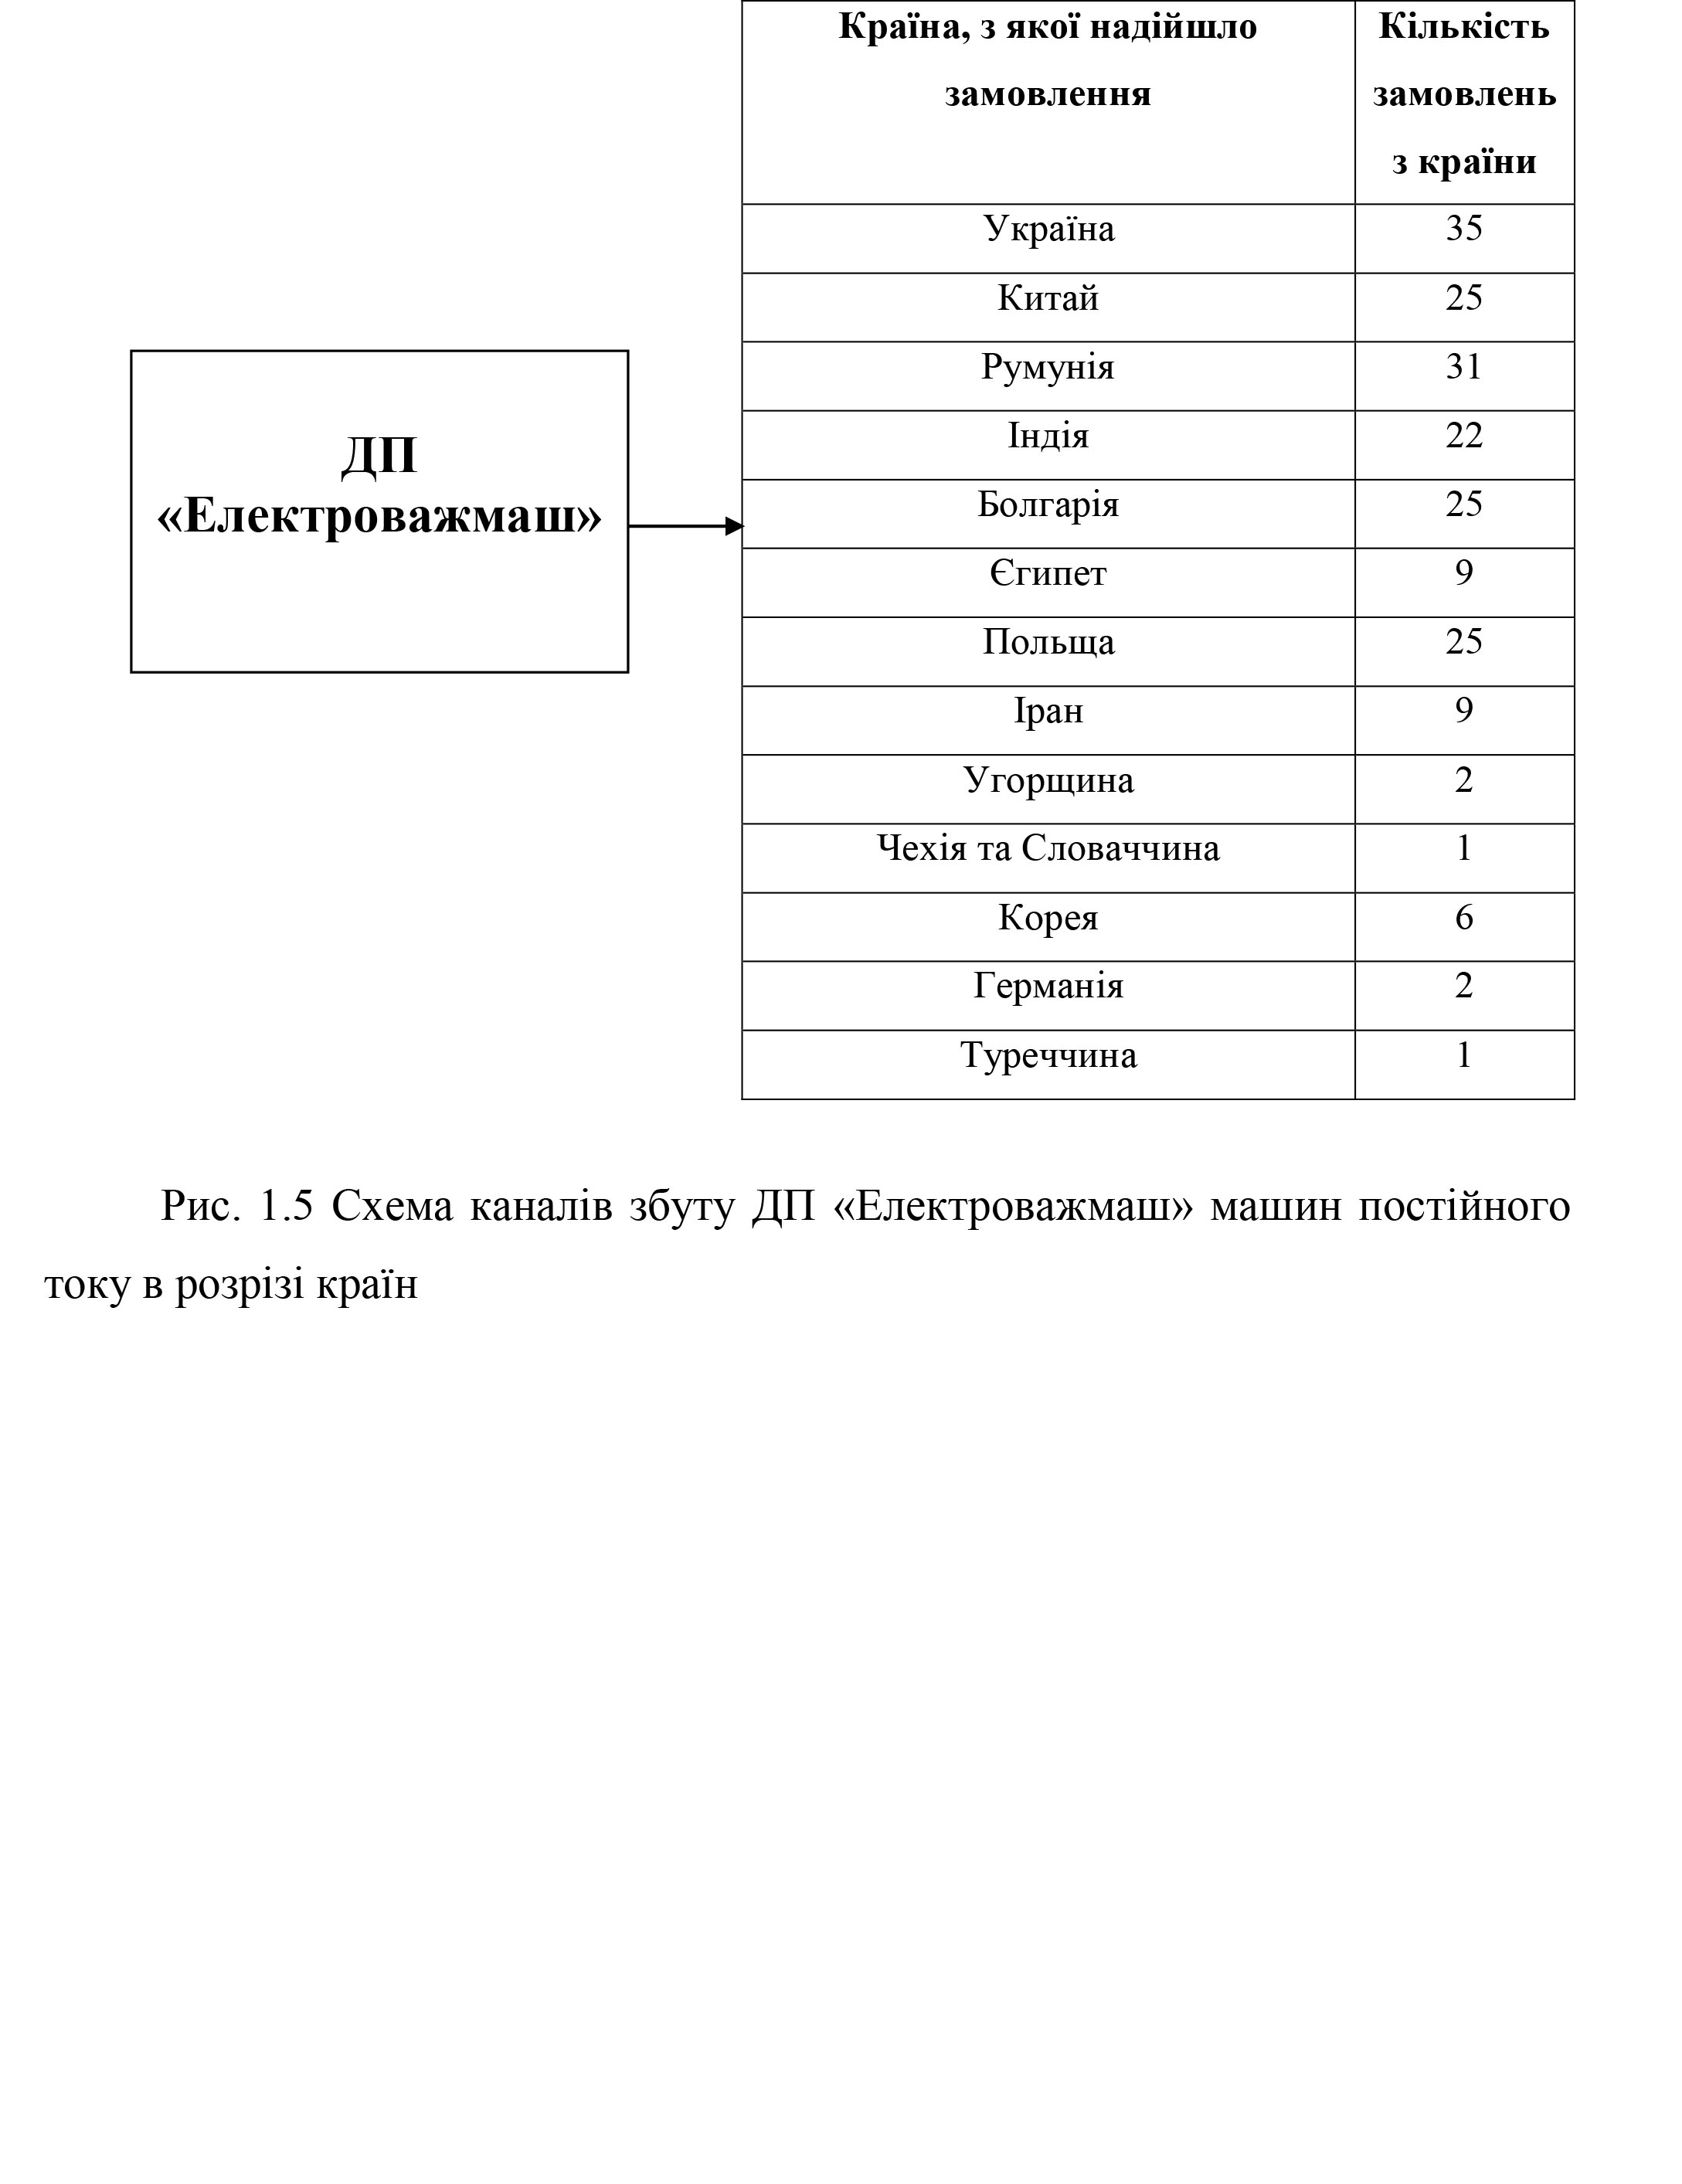
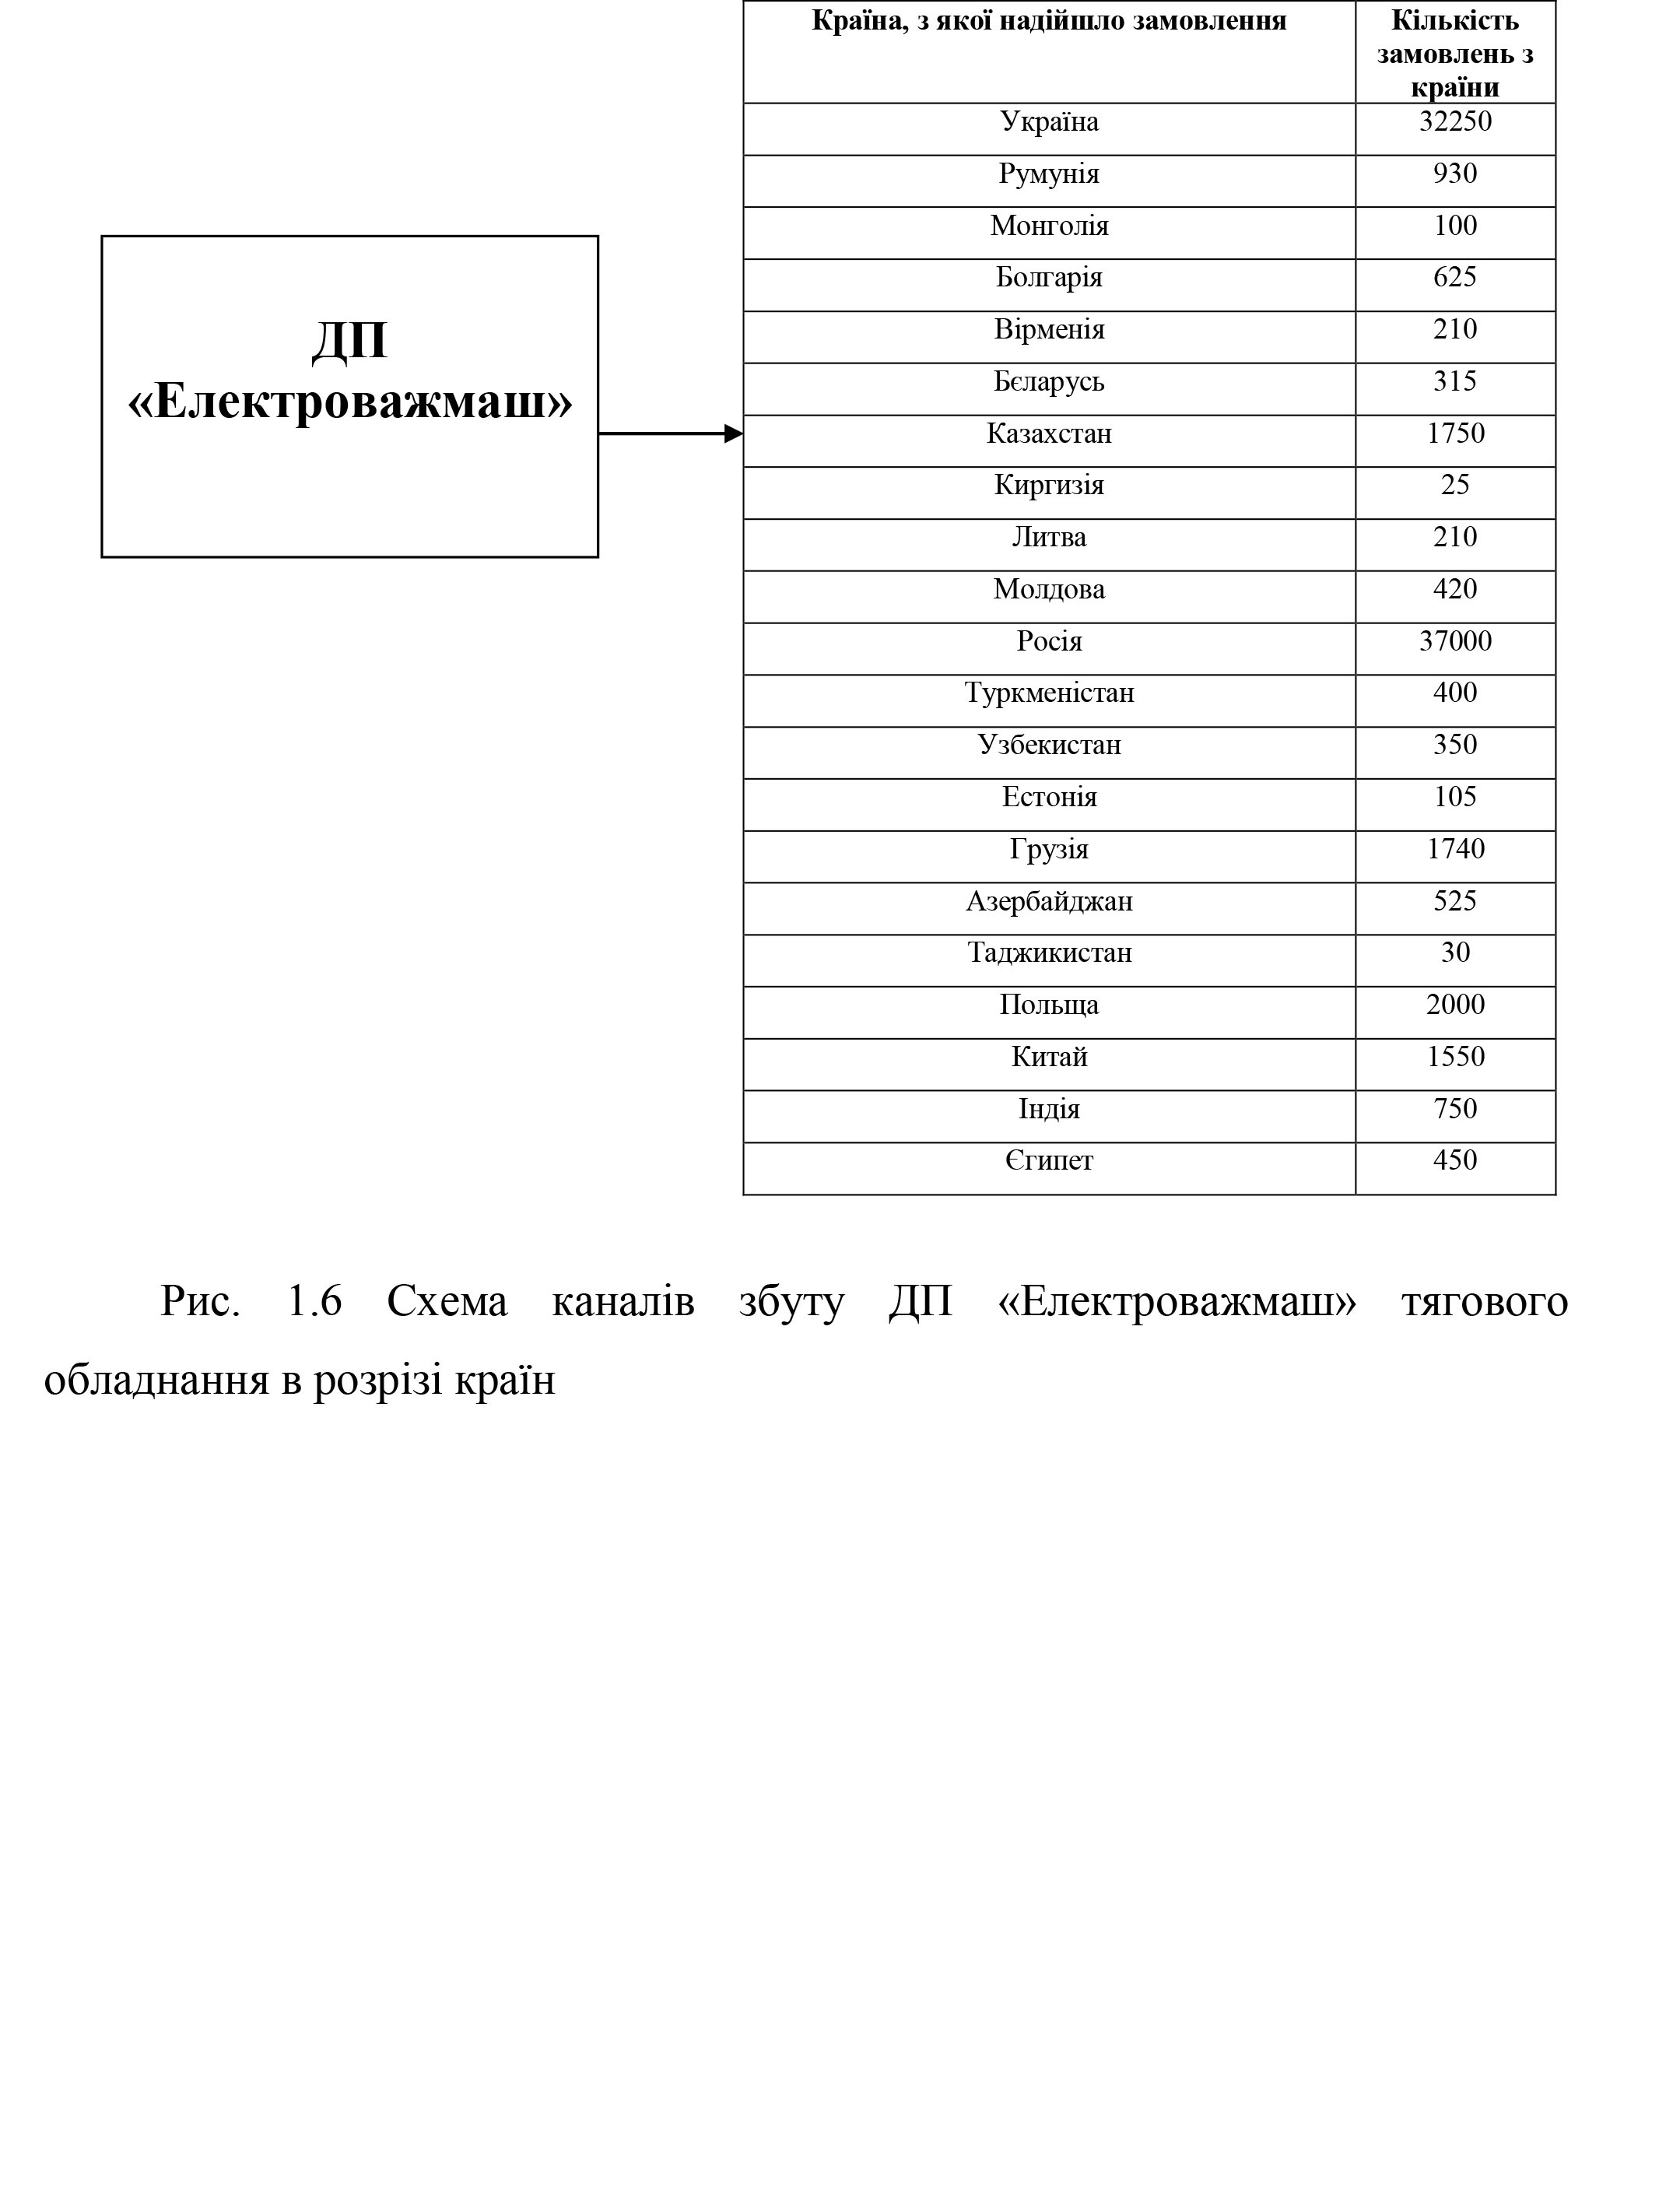
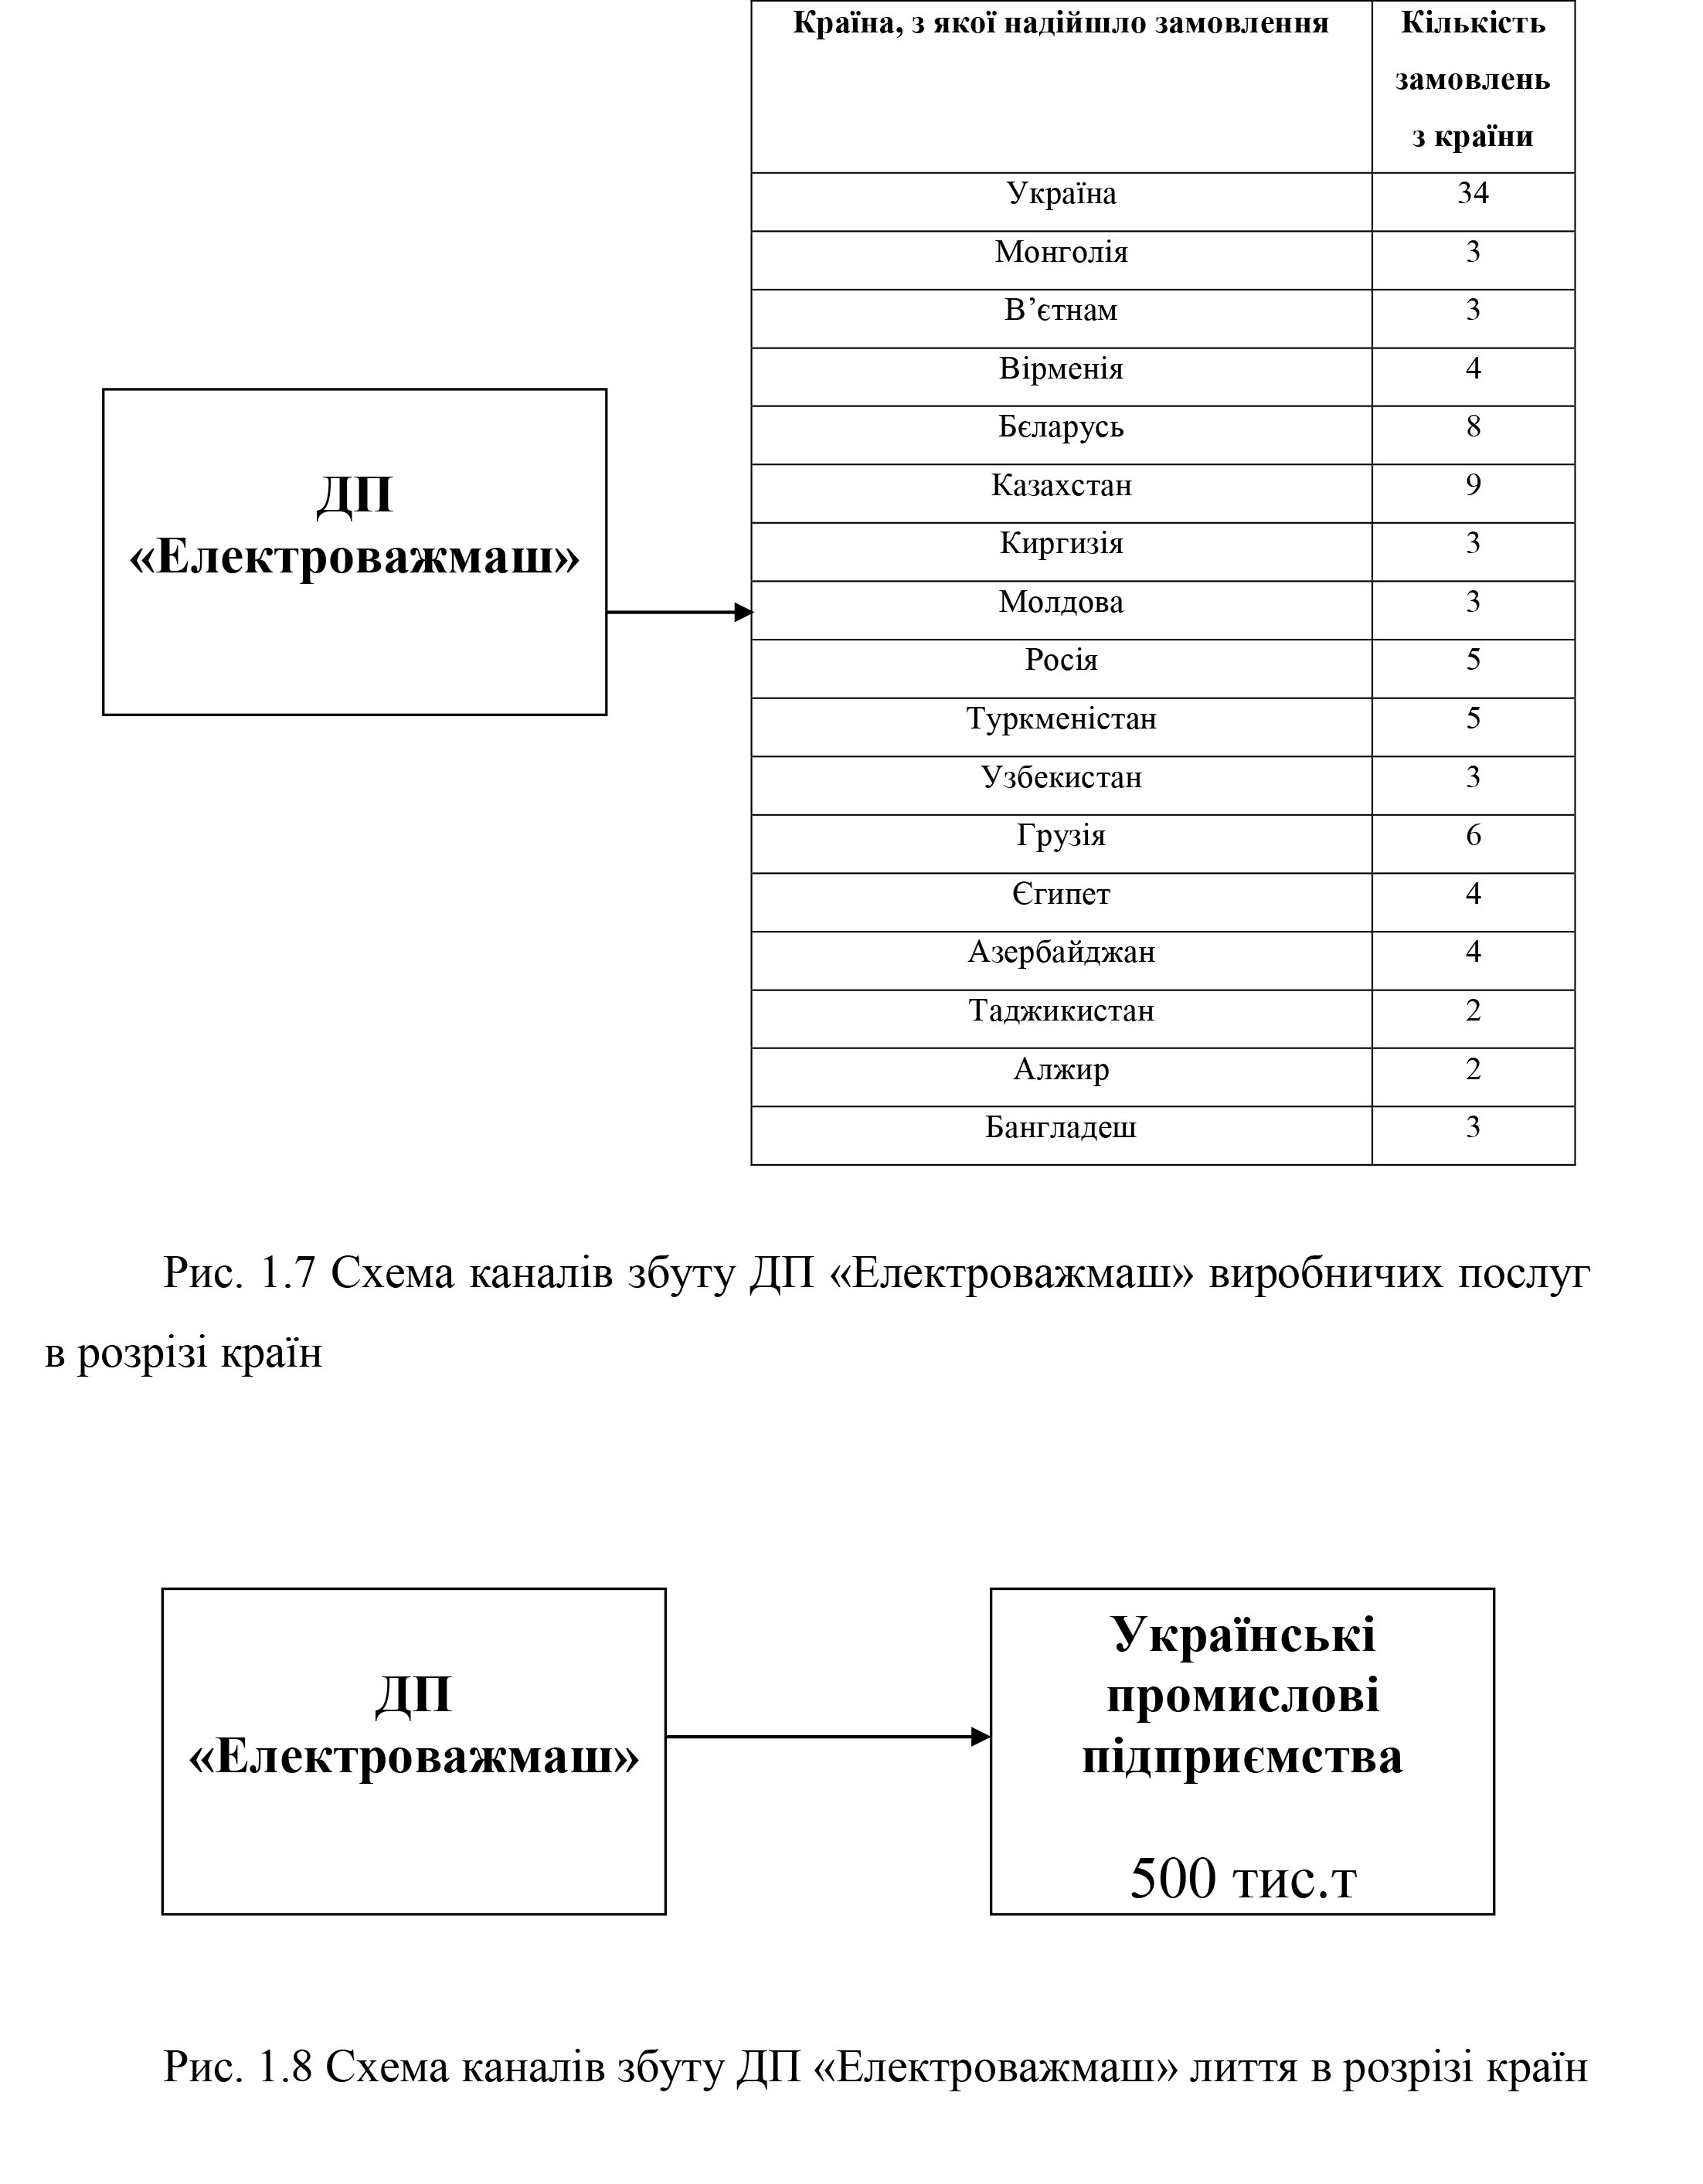
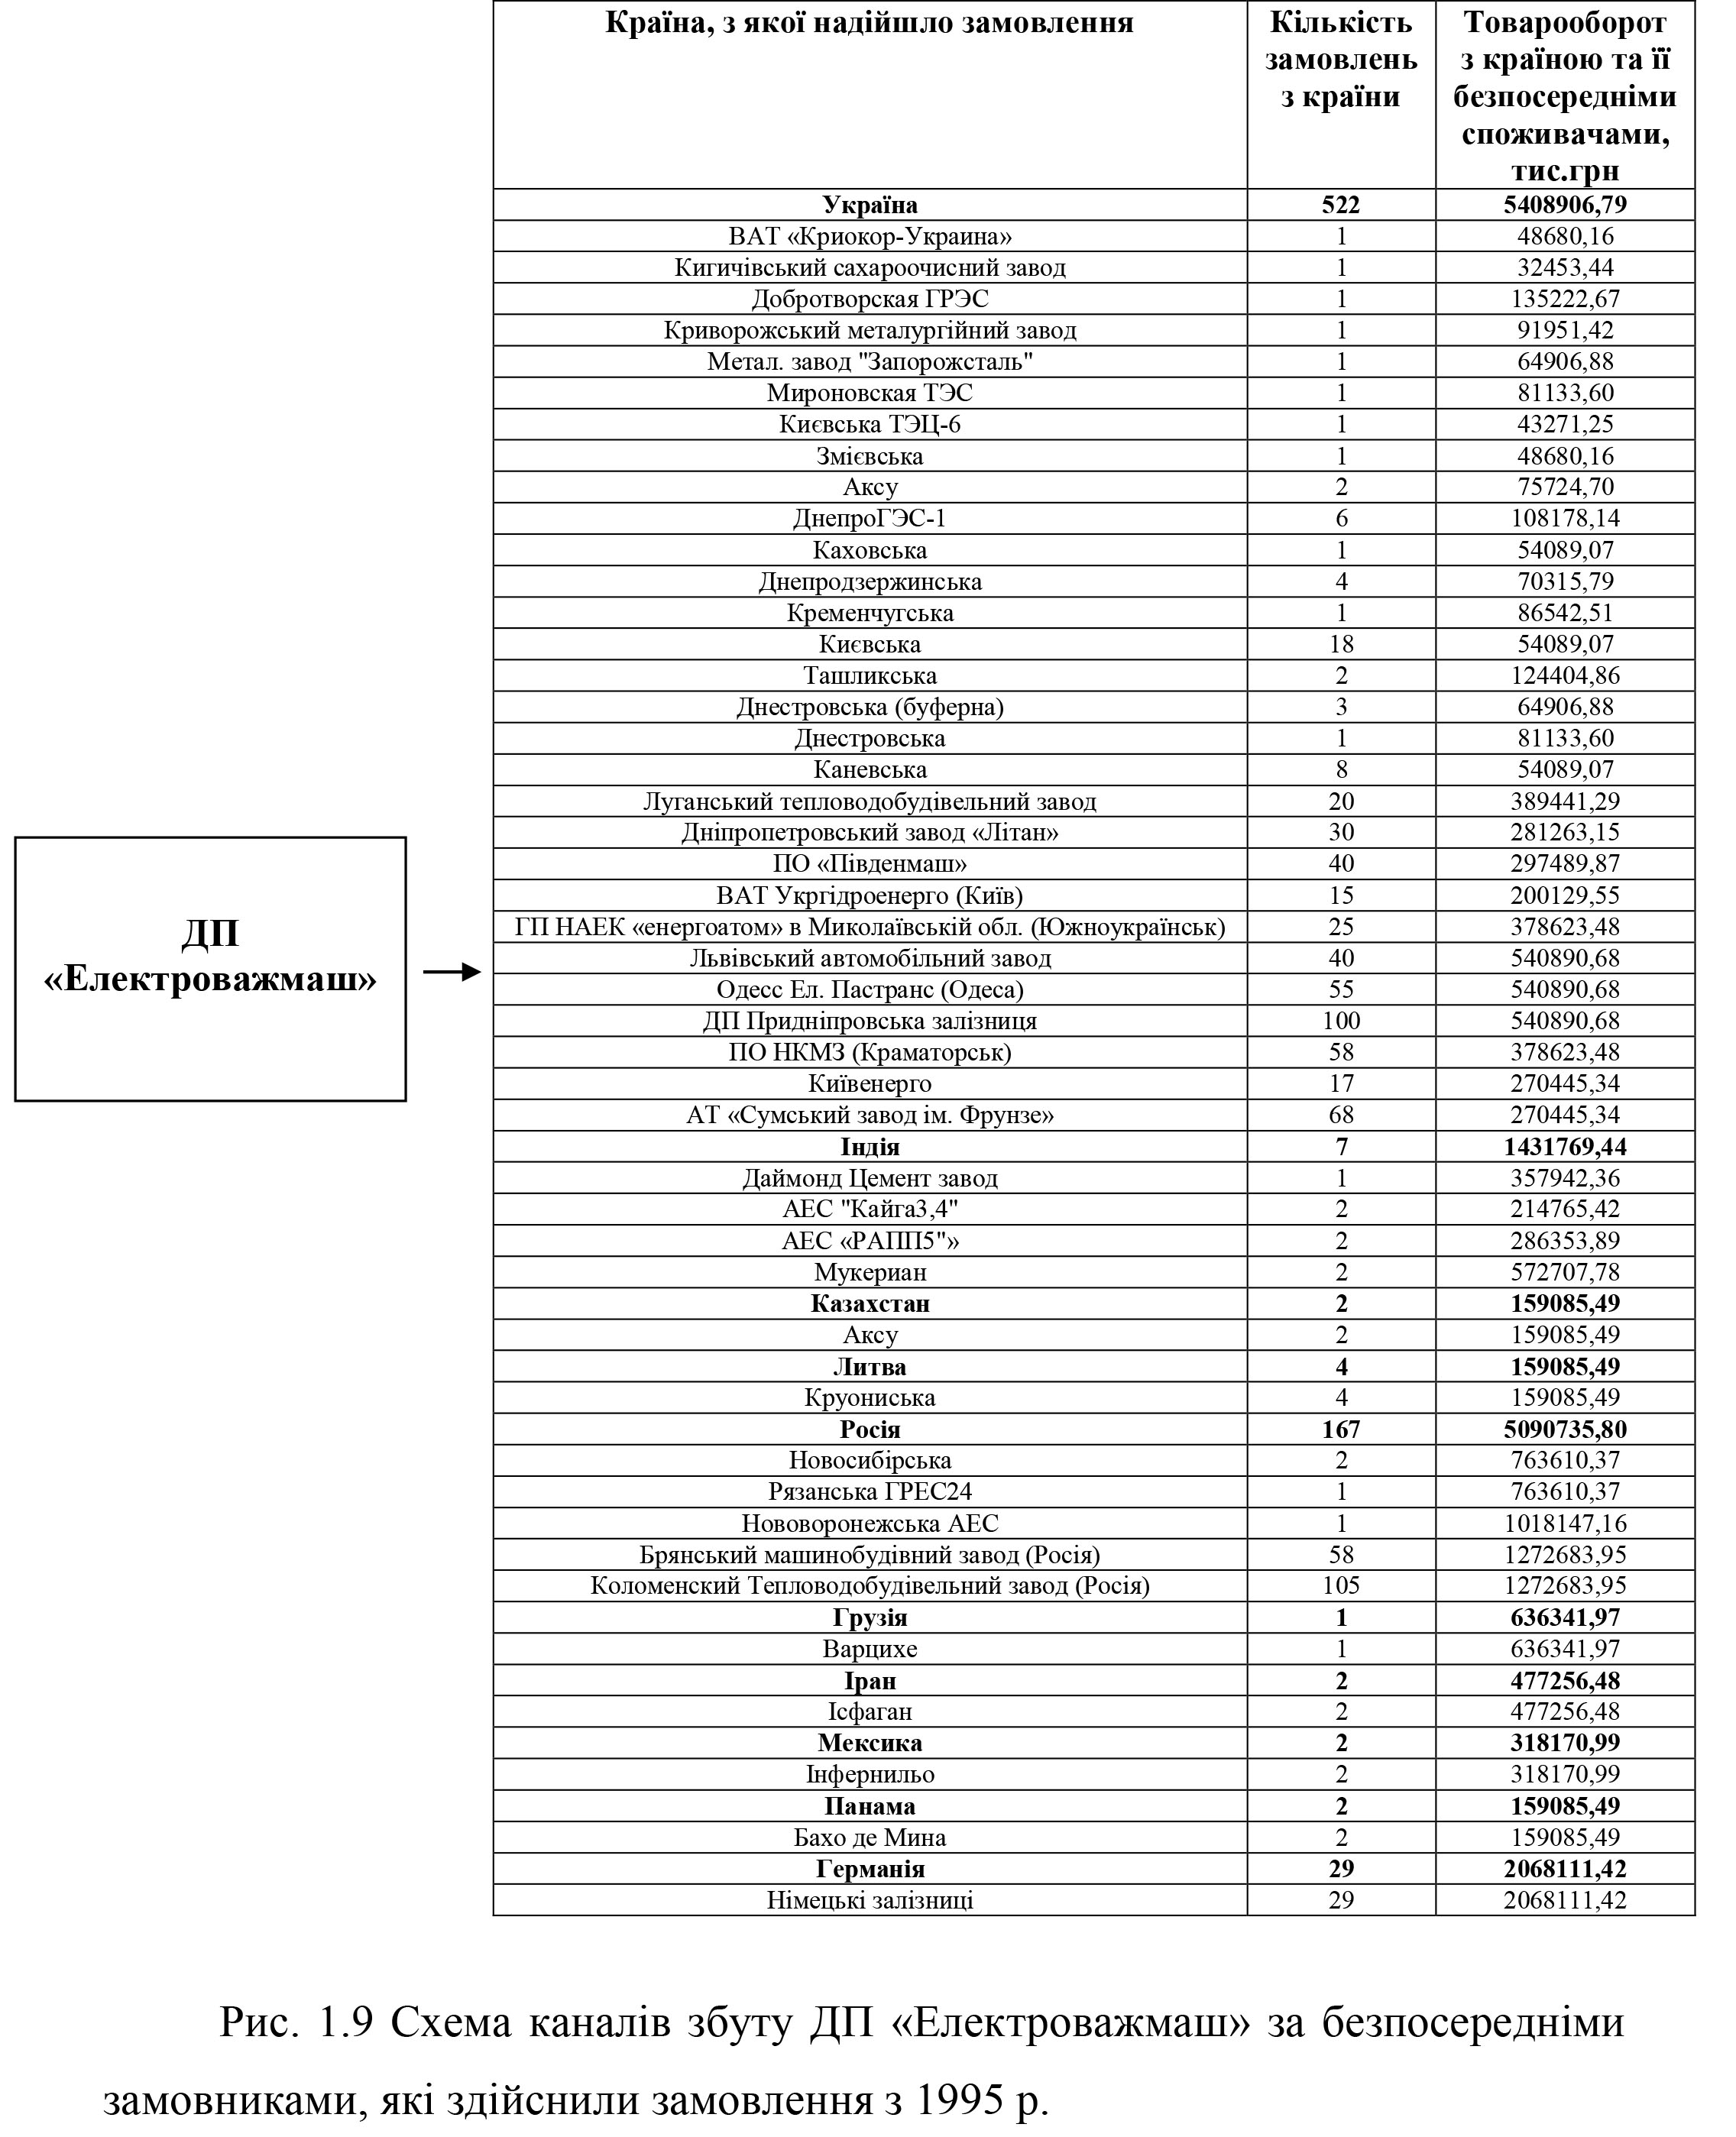
As can be seen from the figures, Elektrovazhmash does not have a specialized own distribution network in either the national market of Ukraine or the international market, nor does it use a dealer or any other intermediary distribution network in these markets. The sale of the enterprise occurs through agency negotiations between representatives of SE «Electrotyazhmash» and representatives of domestic and foreign counterparties in an individual, confederate manner. Meetings with representatives of industrial enterprises-consumers are held in the form of exhibitions, presentations, pre-event meetings of sales staff, marketing department, production units, design bureau, assembly teams — with domestic customers, and all the same units, but also including the foreign economic department — with foreign consumers. In case of mutual understanding, the parties enter into agreements in the form of contracts that are individual for each customer, which is primarily due to the technological and technical complexity of the use and installation of products of the enterprise.
During the history of its almost 70-year existence, SE «Electrotyazhmash» has a rather extensive system of economic relations with many industrial enterprises of the world. Since the life cycle of the supplied products is long enough, and sometimes it is necessary to carry out reconstruction works or to repair or upgrade them, all these channels can be considered to be active, however, they should also be remembered for their periodic stimulation. The most significant and numerous links have been established in enterprises with the CIS countries and Eastern Europe, which is completely natural, since they were mainly formed during the existence of these countries in a single state — the USSR. Among the leaders of consumption of products of the studied enterprise it is possible to distinguish, first of all, the Russian Federation, actually Ukraine, Poland, Georgia, Kazakhstan, China and India.
The most important for the enterprise are the sales channels through which synchronous electric machines such as turbogenerators and hydrogenerators are delivered. This is understandable, because both in terms of technical parameters and share in the revenue of the enterprise, and in fact their cost, scale of work, workload of the enterprise, these products are the most attractive. Consumption of synchronous electric machines in the number of orders again leads Russia, then, directly, Ukraine, then in order of decreasing consumption — China, India, Kazakhstan, Belarus, Georgia, Bulgaria and others. The consumption of DC machines is much smaller than that of synchronous machines. Basically, the consumers of these products are Eastern European countries, Ukrainian industrial enterprises, China, India and Iran.
The order volume for the traction equipment far exceeds the previous two product lines. However, due to its simpler technical solutions and larger scope, this situation is completely logical and logical. However, in the case of more frequent contacts with consumers of these products, the share in revenue from it is less than the previous two positions, although under the current conditions of saturation of the markets of synchronous and DC machines, considerable attention should be paid to the above mentioned product group in the nomenclature of the enterprise, and accordingly value existing sales channels and think about expanding them.
The production services of the enterprise are mainly used by domestic customers and there is also a small number of customers from CIS countries as well as the so-called «third world» countries. sources of this competition are the countries of Western Europe, Russia, the USA, Canada, China, Japan, and India, Iran and Korea are gaining momentum.
It should be noted that over the last 16 years the consumer range of products of SE «Electrotyazhmash» has significantly decreased. Today, by geographical principle, the products of the enterprise are ordered by the industrial enterprises of the following countries: Ukraine, Russia, India, Germany, Kazakhstan, Georgia, Lithuania, Iran, Mexico, Panama. Moreover, industrial enterprises of Ukraine significantly exceed in the structure of consumption of enterprises of all other countries. The positive thing is that despite the sufficient number of competitors in Russia, its consumers occupy the second place in the structure of consumption of products of SE «Electrotyazhmash». On the positive side, there are German railroads that purchase traction equipment for their electric locomotives among the consumers of the product, and accordingly the existing sales channel. Customers of synchronous and DC machines include India, Mexico, Panama,
Based on the architecture of the distribution channels of SE «Electrotyazhmash», we can conclude that the company, consciously or at a subconscious level, automatically uses a marketing retraction strategy, which is to target the consumer, in order to create a lenient attitude towards the product, and therefore enterprises, however, in our case without the involvement of intermediaries.
Thus, the company remains in a very serious, competitive position, although there are areas of activity that need to be urgently changed, as the reduction of sales units is caused by the following weak positions: maintenance, spare parts delivery, installation and service, accuracy and accuracy of order fulfillment . However, special attention should be paid to improving the enterprise’s communication policy, raising awareness of the enterprise, re-positioning it from a «monster of the Soviet industry» to an advanced, knowledge-intensive, modern enterprise of an innovative type and a European business culture.
EXTRACT FROM THE REPORT ON PROVISIONAL SERVICES ON BUDGET COMPANY BUDGETING AND MEDIA PLAN DESIGN
completed in 2012, © Nemtsov OV
4.1 Basic concepts and metrics in advertising
Ads are differentiated by product groups, services, brands, advertisers, programs, delivery periods, and the duration of specific campaigns. When designing an advertising campaign’s budget and documenting it in the form of a media plan, they identify the most effective advertising channels, using a number of metrics that are accessible through the activities of research institutions. The aforementioned structures track advertising broadcasts and publications in the media, capture information and process the data obtained by statistical methods. Also, research institutions collect information about the audience of a particular media tool and provide consolidated data on the target audience: form databases with information on age, gender, education, employment, social and marital status, income, assets, etc.
A media channel is a collection of advertising media that are the same in the way they convey information and are characterized by the same perception of the audience (television, radio, etc.). Vehicle media is a specific representative of a media channel (specific broadcast, program, radio broadcast, certain newspaper issue, etc.). So a media channel is a broader concept than a media carrier.
When choosing a media channel, you must consider the following criteria:
1) maximum reach of the target audience;
2) the relevance of the channel to the objectives of the advertising campaign;
3) cost ratio (advertising effect);
4) channel availability;
5) availability of alternative channels.
According to these criteria, the following indicators are explored:
Media coverage or layout scheme (Reach). This metric indicates the percentage of the population or target audience exposed by the carrier at least once during the study period (eg, four weeks). That is, each representative of the target audience is counted only once, no matter how many times within a specified time he actually contacted that medium.
- Frequency. The figure is denoted by the Latin letter «f» and shows how many times a certain percentage of the target audience has contacted the carrier that contained the ad.
- Cumulative frequency or cumulative exposure frequency distribution. This figure is denoted by the Latin letter «f +» and indicates the number of contacts of a specific part of the target audience with a carrier per unit of time.
- Frequency coverage (Reach f +). The metric describes the reach of a portion of the target audience exposed by a carrier with a certain cumulative frequency.
- Channel rates. This metric determines the cost of customer contact and is set for each specific media channel, taking into account the format, color, location, program, name, and other factors. It is generally accepted to convert cost bids into cost-per-thousand (CPT) metrics that characterize advertising costs per 1,000 target audiences.
Among the alternative metrics provided directly by the media in drawing up a media plan are the following:
- Rating of the carrier (Rating). This flashback is calculated in points and characterizes the part of the target audience that has seen or heard a specific program in a certain period of time.
- The media audience. The metric is used for prints and characterizes the part of the target audience that has seen a particular publication or article at some point in time.
- Sum of Rating Points — GRP (Gross Rating Points). This metric is defined as the sum of the product ratings of all carriers on the number of inclusions and shows the percentage of the population that is subject to advertising influence.
- TRP (Ttarget Rating Point). The metric calculates a total rating not for the entire audience, as GRP, but only for the target group.
An advertising campaign is planned and then conducted over a period of time — an advertising cycle. The choice of ad cycles and their duration are determined by the reach scheme. The duration of an advertising cycle may be different, for example, one year in the case of continuous advertising schedules or one day or even one hour. This definition refers to the period of the advertisement, not its specific duration. In some cases, for example, when you advertise in magazines or by direct mail, the time of the advertisement and the time it will be seen and read may vary significantly.
In order to find the right outreach scheme, you need to look at the entire advertising communications schedule from the point of view of the target consumer — the typical target audience representative. The target audience may be new users of the product category, loyal customers and non-regular consumers of other trademarks of this category, loyal and non-regular consumers of this trademark of this category.
5.1 Defining the purpose of the advertising company LLC «Company …»
Analyzing the market of mobile communications and the main competitors of LLC «Company …», and also considering that the purpose of the advertising company is to find a vacant niche and increase the share of the company in the market, it was determined:
- The product being offered (telecom operator services) is in a growth phase that is characterized by:
— the seller’s market — is constantly growing, with increasing competition;
— consumer market — mass;
— sales volume is growing fast;
— profit — maximum;
— goods — production of new types, brands, sizes, modernization of goods;
— the price is a bit lower than the birth stage.
- The advertising strategy to be pursued is to create a priority for the brand.
- Target audience — strategists and pragmatists, with the reach of a small number of enthusiasts.
- The target audience coverage scheme — the «awareness scheme» is somewhat adjusted for the purpose of gaining market share.
- Media (media channel): newspapers, television, magazines, outdoor advertising, Internet.
To determine the channels on which the campaign will run, we analyze the following media metrics of the channels and their dynamics: TVR, share, coverage, compliance index, CPT. Fig. 2 shows the Affinity Index and coverage of major television channels. 5.9.
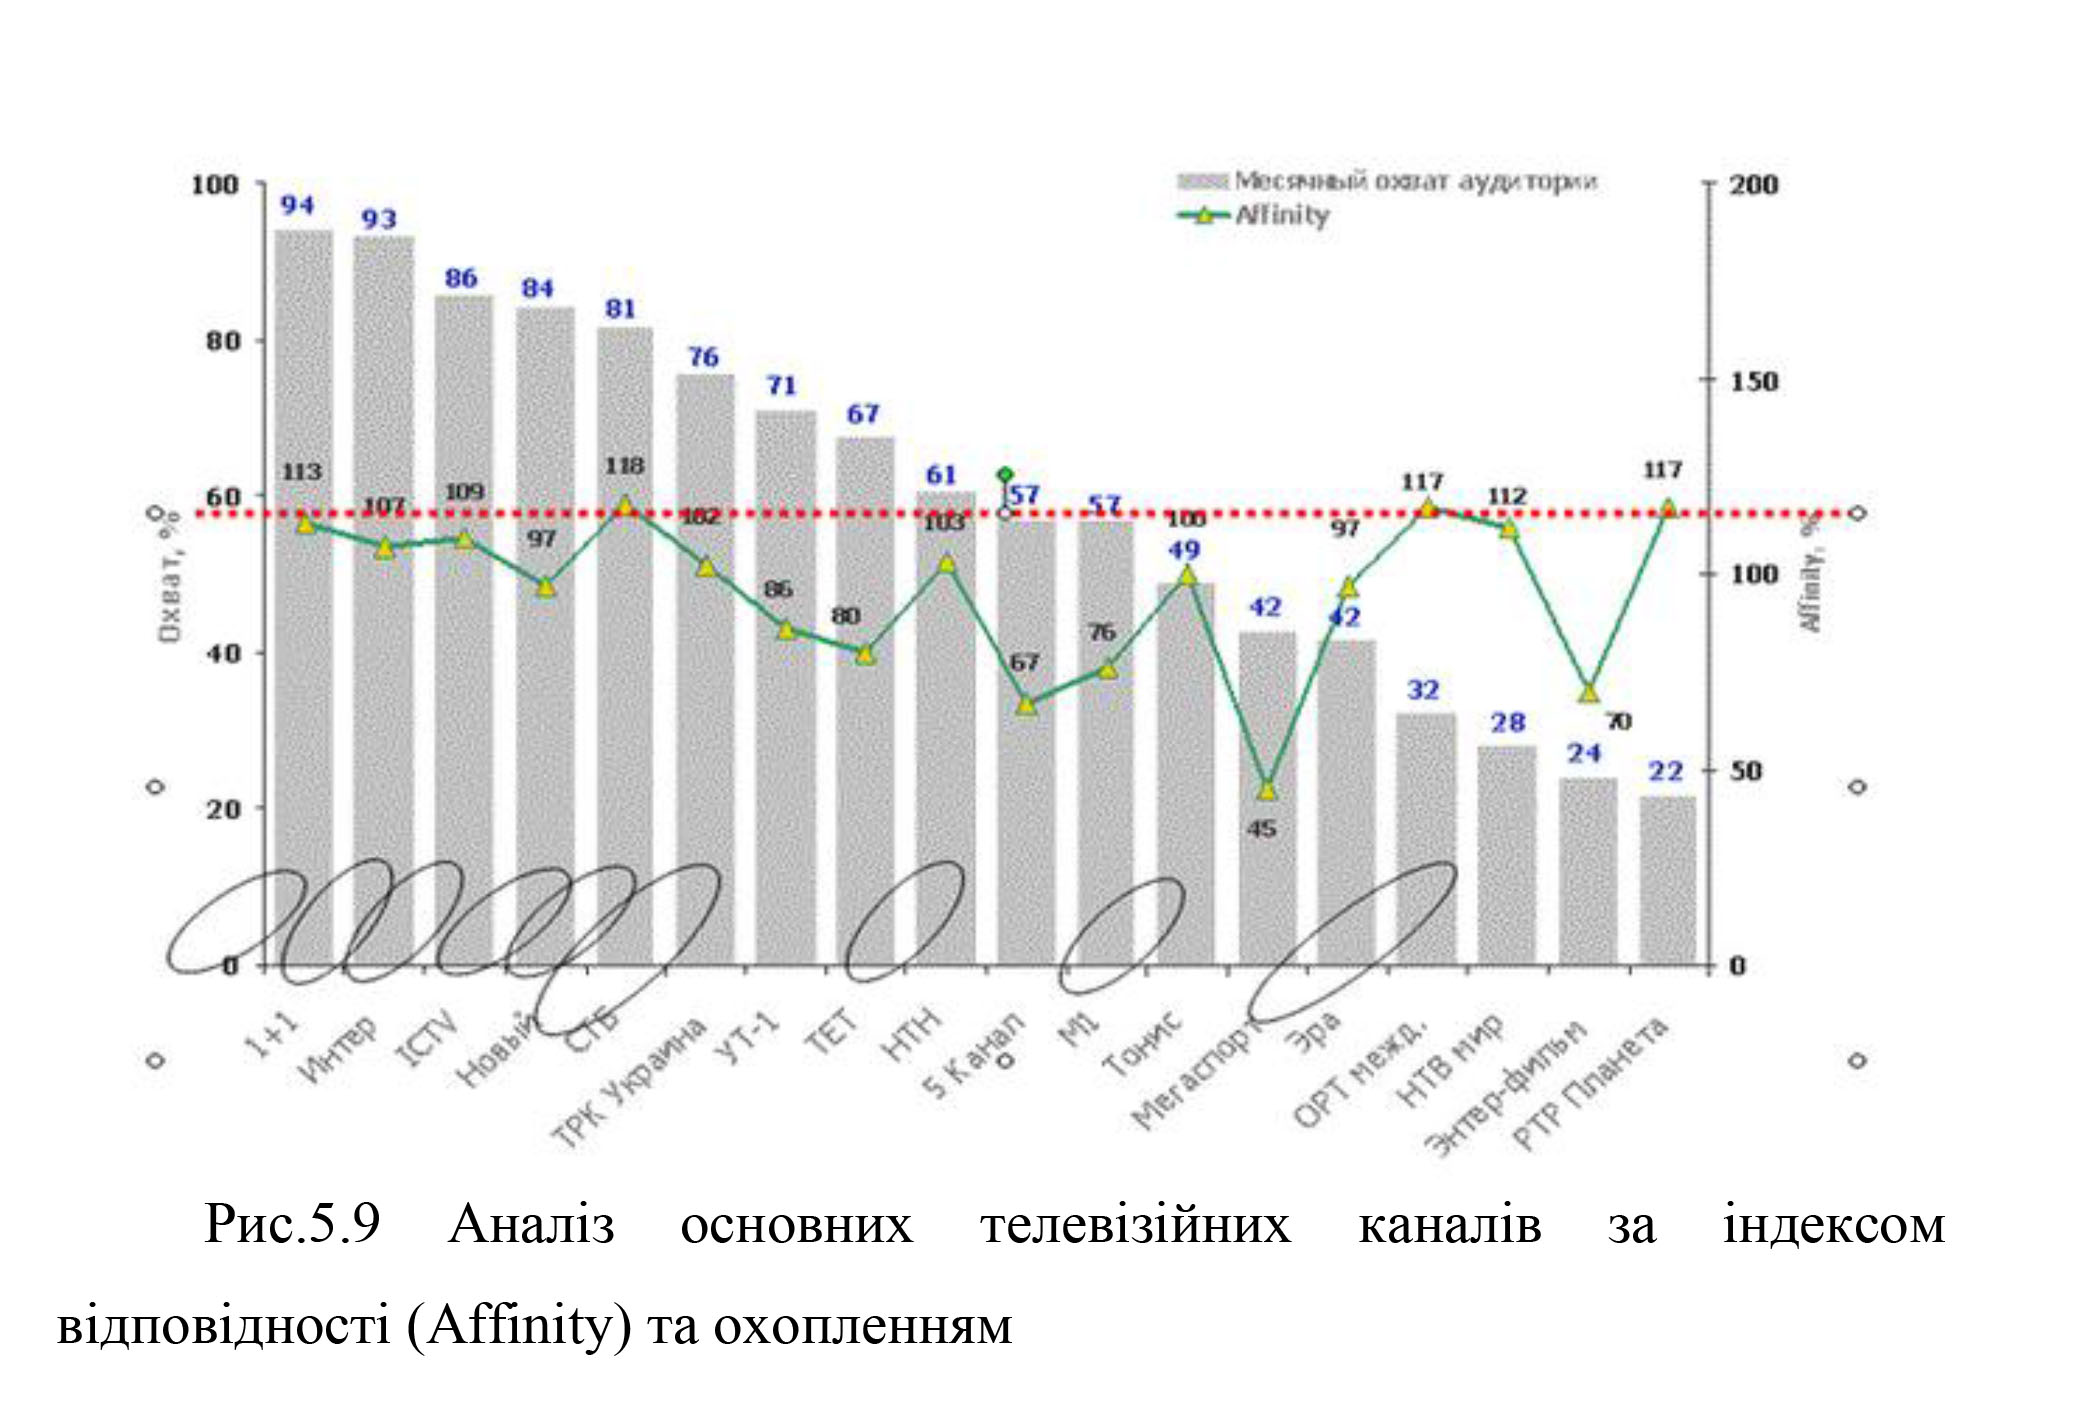
National channels are 1 + 1, Inter, ICTV and Novyi channels.
7 .5 Media plan of the advertising company «Company …»
Having selected the media on television, we determine the budget of the future advertising campaign and make a media plan (Table 7.5.10).
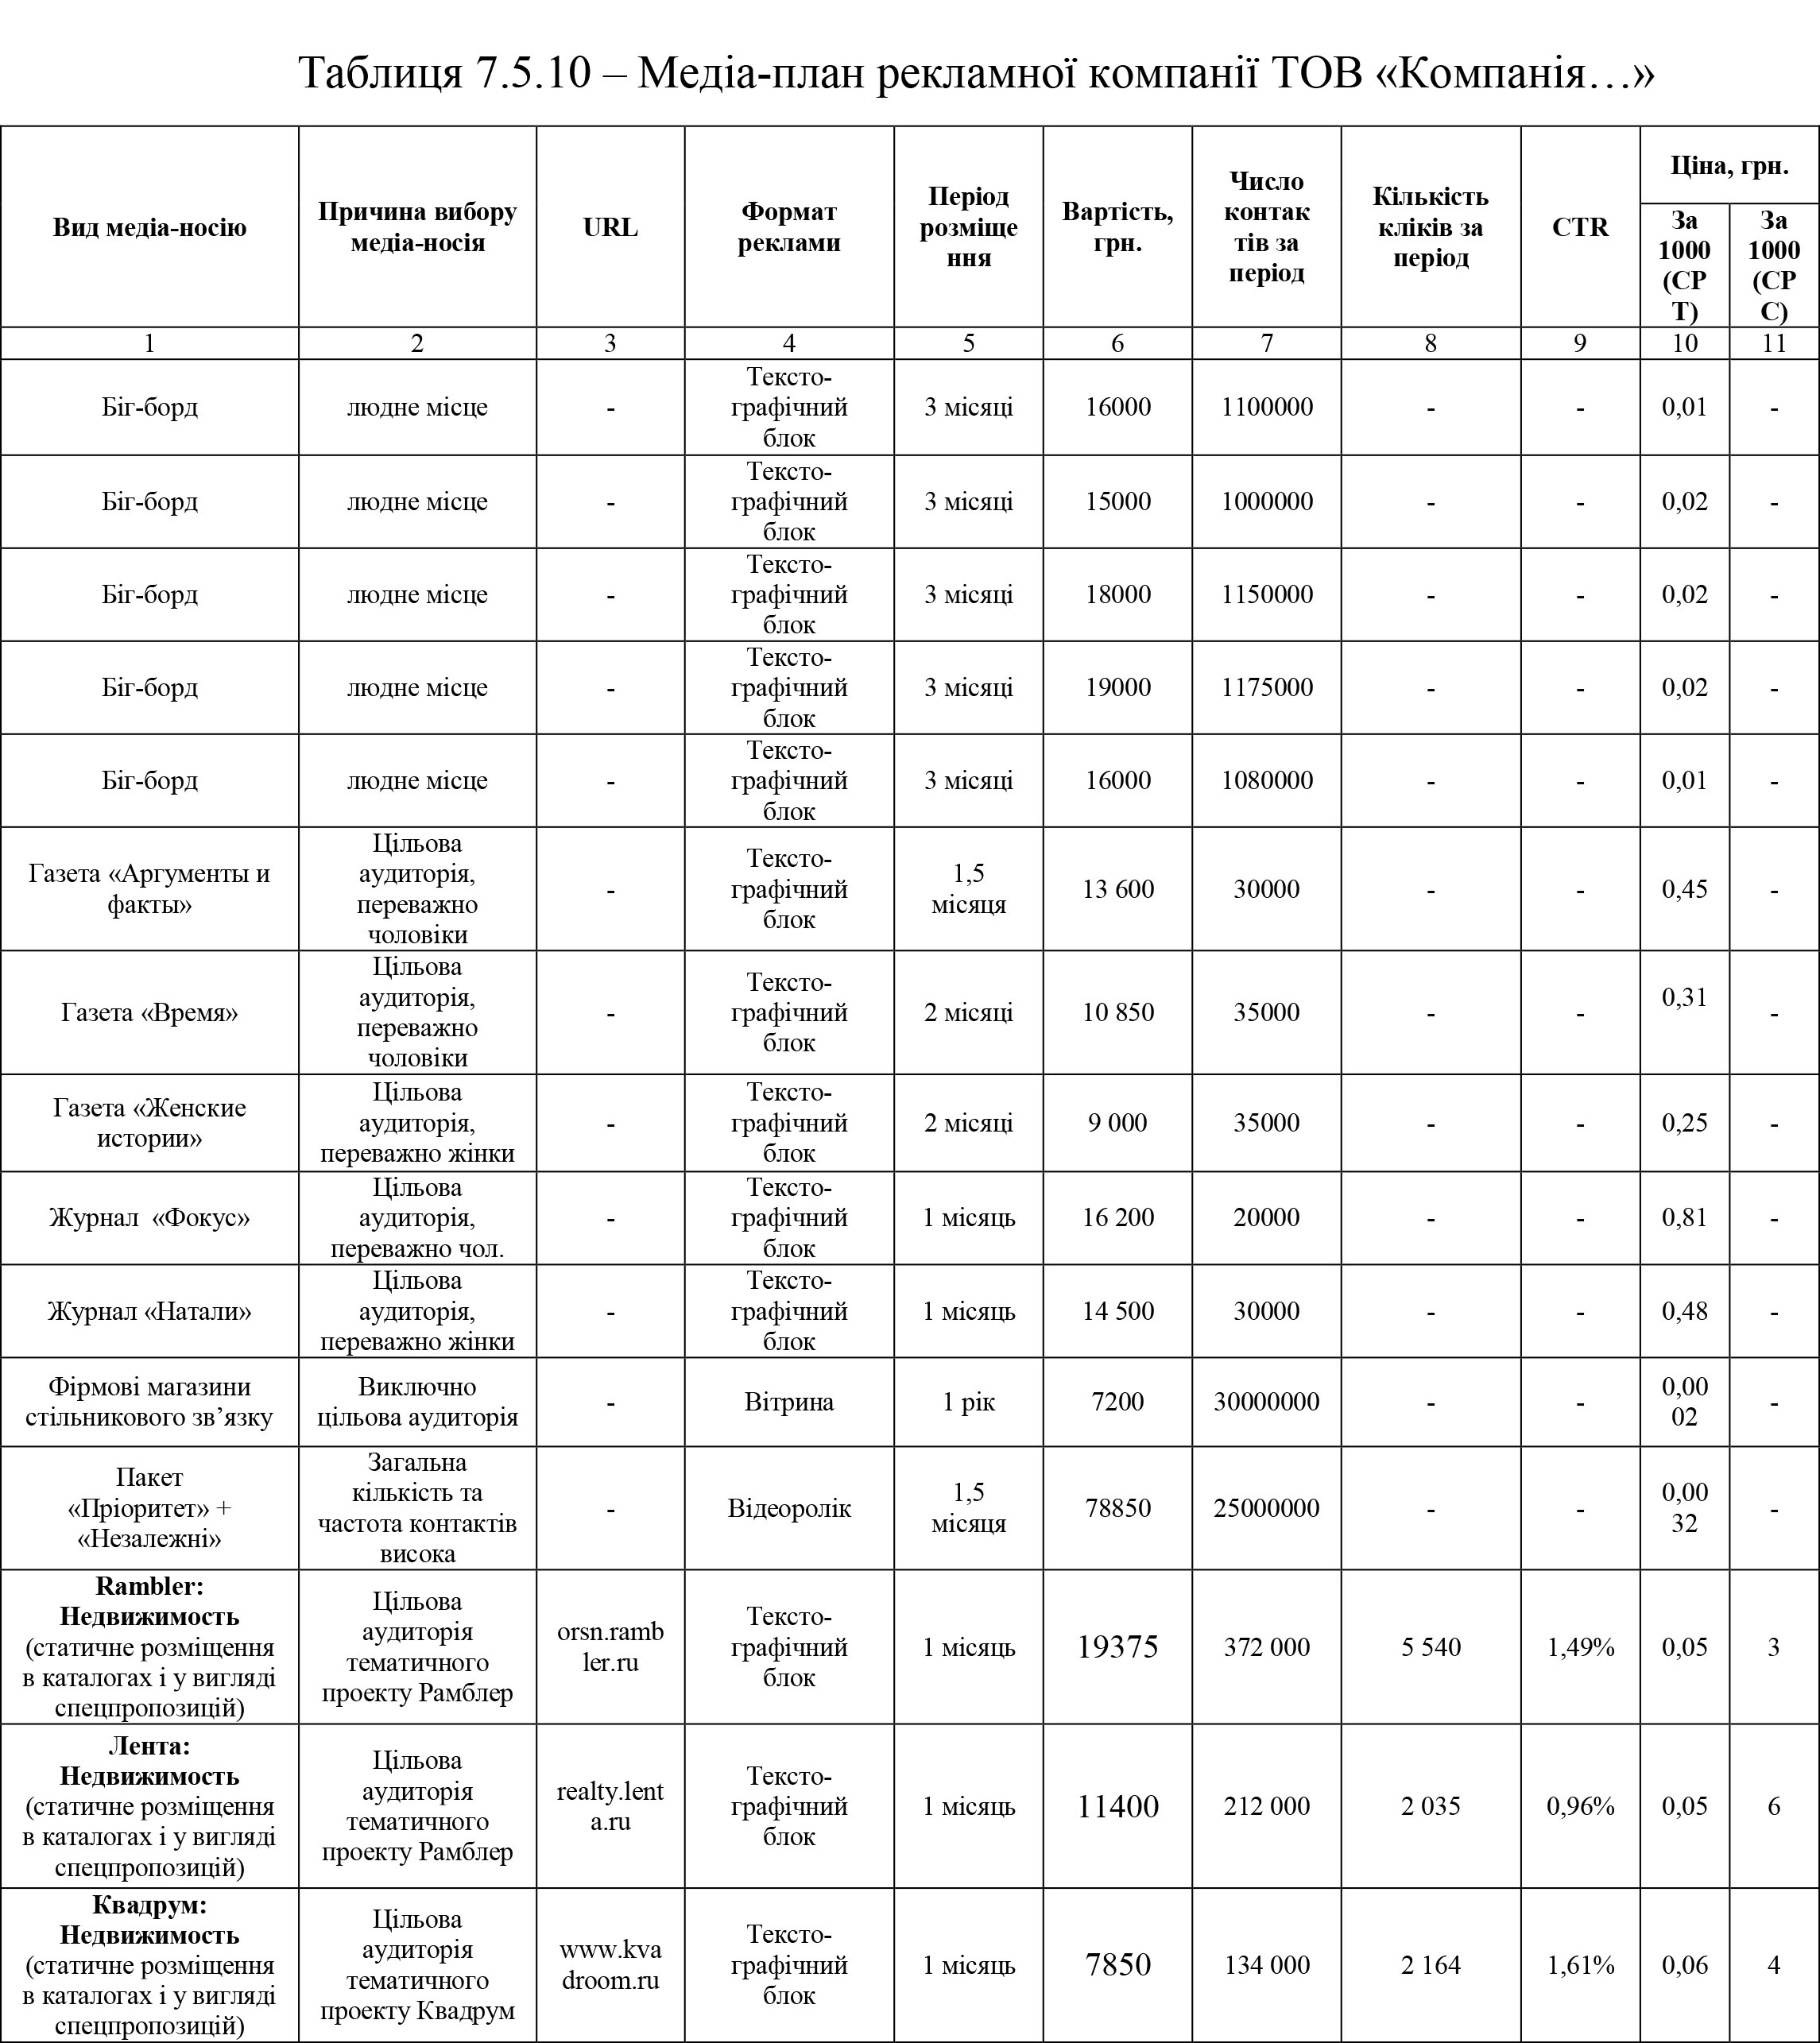
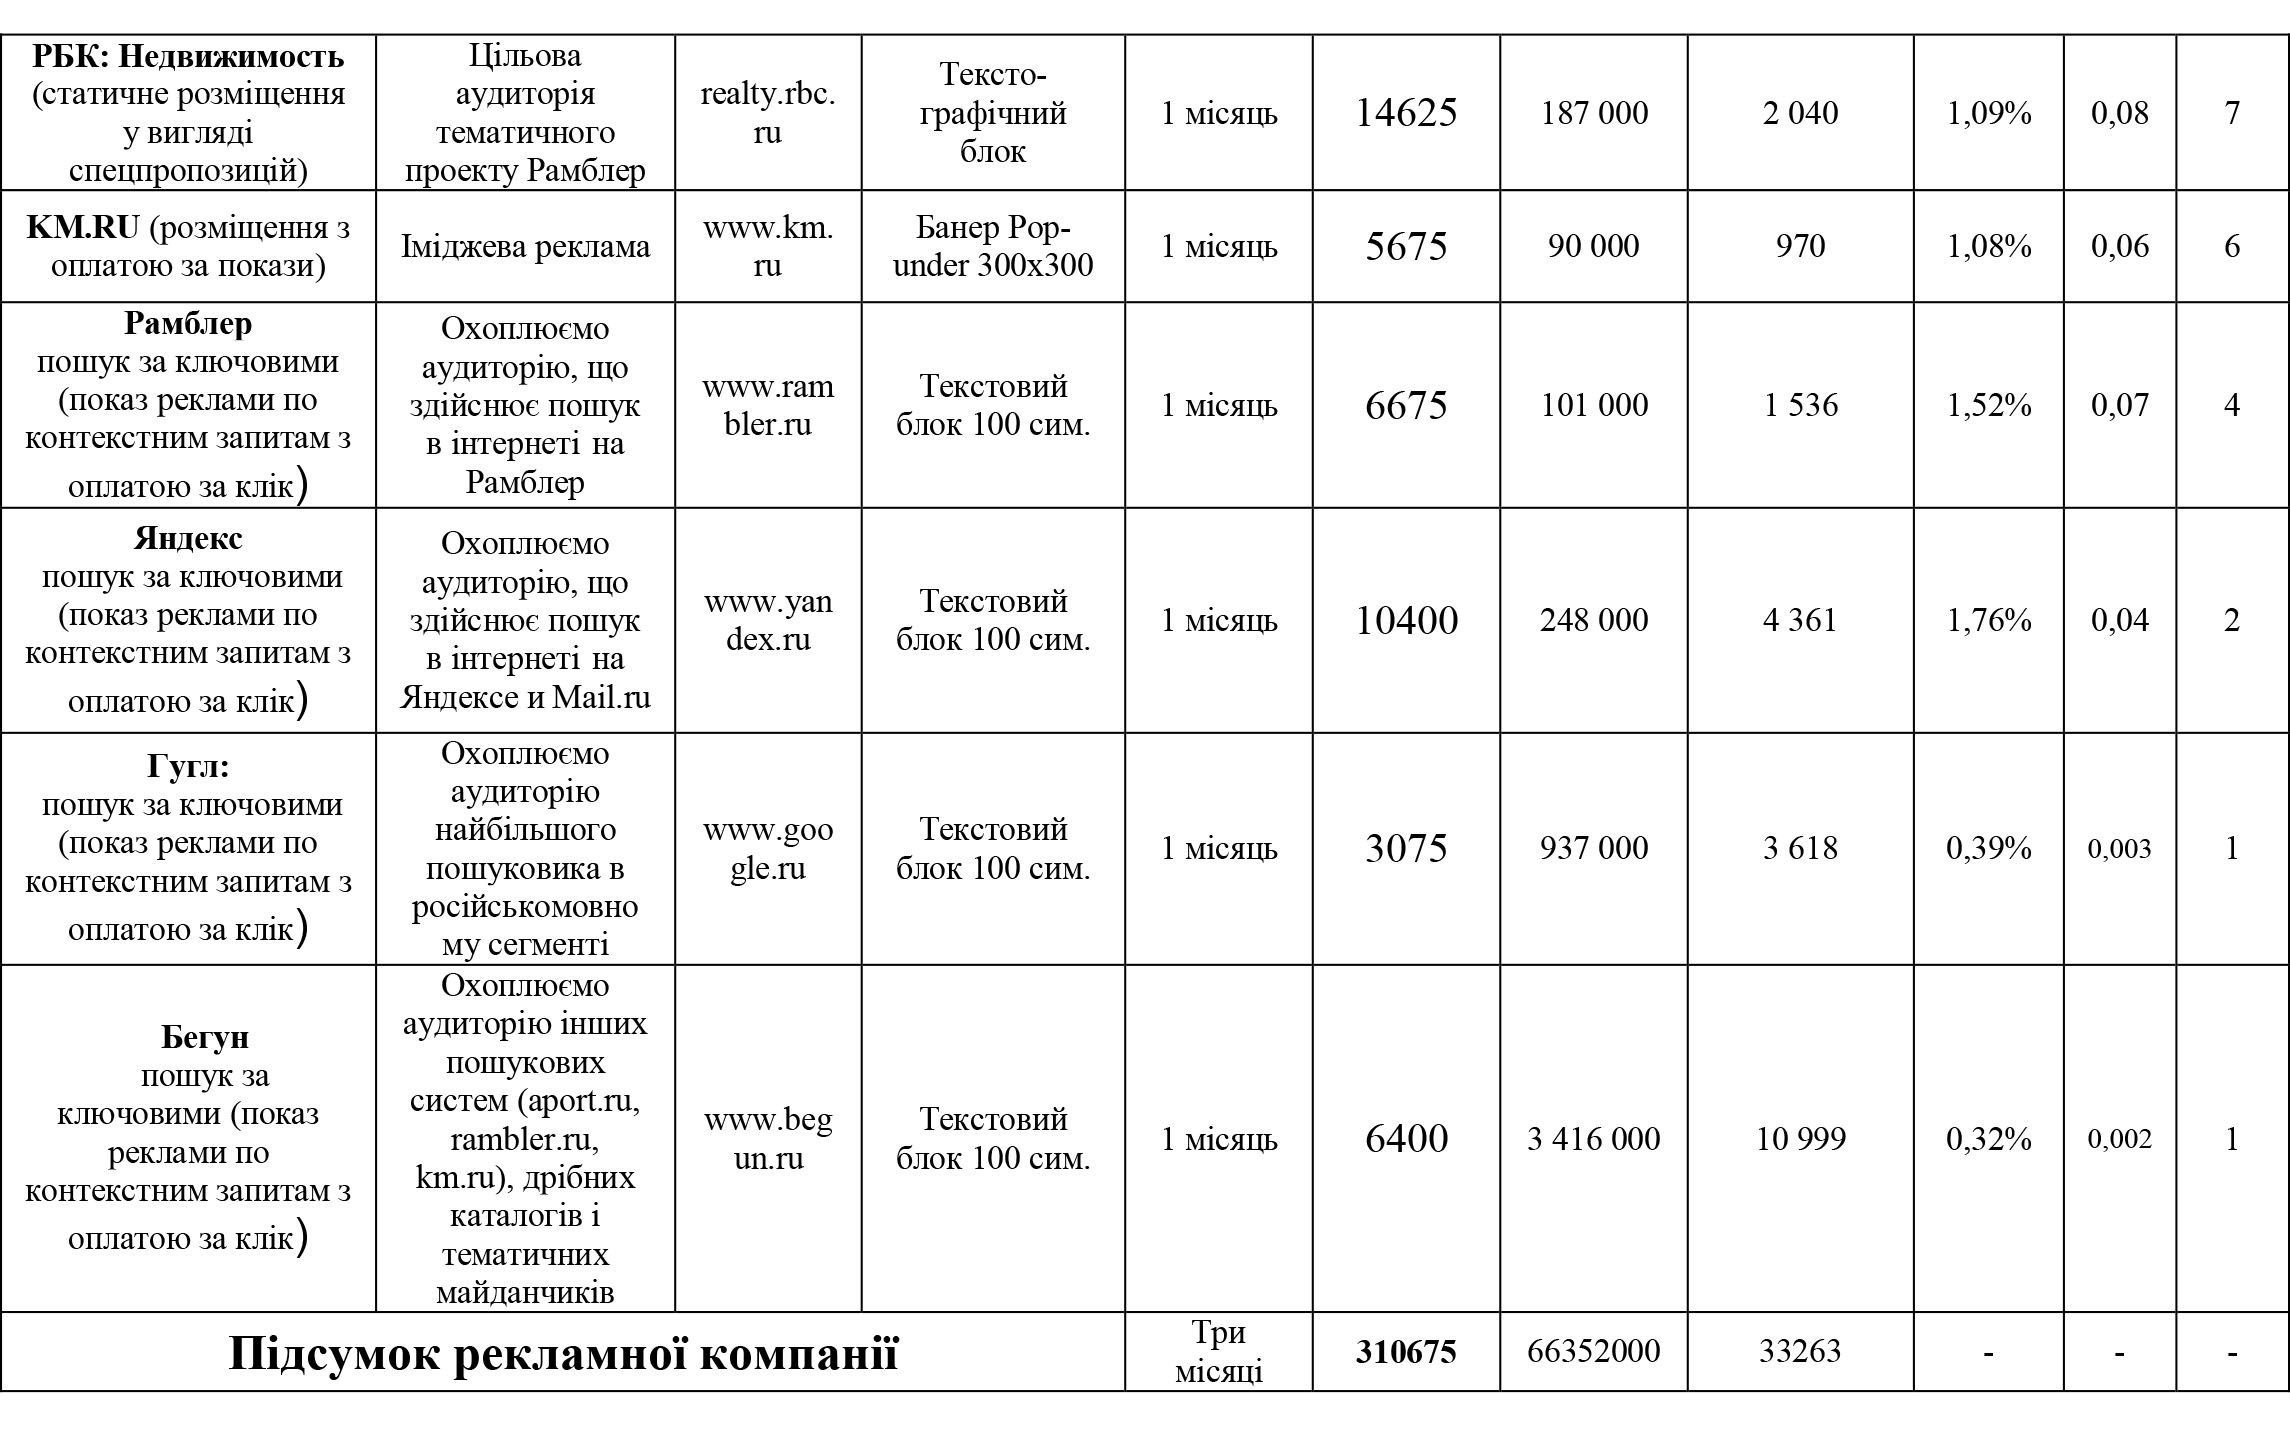
Thus, the total cost of an advertising company using 5 media channels and 21 media carriers for a total period of three months is 310675 UAH.
EXTRACT FROM THE REPORT ON THE PROVISION OF ADVISORY SERVICES ON OPTIMIZATION OF THE MANAGEMENT SYSTEM
performed in 2011, © Nemtsov OV
1.5 Assessment of the market situation for alcoholic beverages
The beverage industry in Ukraine is one of the most dynamic. Today, the profitability of enterprises in this industry is one of the highest, and the growth rate of production is increasing every year. Most of the import of products is replaced by consumers for Ukrainian goods, and fierce competition within the industry, only contributes to the improvement of product quality, the development of new marketing strategies and more.
Illegal production is particularly intensified during the period of the excise duty rate increase by the state due to the increase in the prices of alcoholic beverages. Fake and substandard alcoholic beverages are a serious threat to the health and sometimes life of consumers. Main violations: increased content of fusel oils and low alcohol content.
According to experts, the volumes of the illegal vodka market look threatening. It should be noted at the outset that not all products in the illegal vodka market are counterfeit — according to various specialists, only 30 — 40%. The presence of a large number of fakes in the domestic market is beneficial to many. Owners of well-hyped brands suffer the most from counterfeiting in the market.
According to experts, in recent years, alcohol consumption has not generally decreased, just the majority of producers state has driven the excise policy into the shadows. The cost of 0.5 liters of vodka with 40% strength includes 17.2 hryvnia of excise duty, and it is necessary to take into account the value added tax, the cost of packaging and more. And you can buy vodka for only 23.5 UAH. Although it is of dubious production, however, sellers assure, it is quite high quality — the same vodka as with excise stamps, but made «to the left.» They believe that the proportion of vodka, as well as its quality, which is in the shadow turnover, has significantly increased and exceeded 50%. Given the real solvency of the population, of course, many people choose what is cheaper.
For those who have money, are afraid of poisoning and buying only legal vodka branded in the store, all manufacturers offer a non-returnable (disposable) bottle and original stopper. This is what the middle-price vodka is called, the taste and quality of which is quite different. Although manufacturers talk about the optimum value for money of their products, there is, in fact, powerful advertising support behind it.
In such circumstances, it becomes advantageous to produce the food alcohol itself without paying excise taxes and to sell it cheaper than at the store. But such schemes will appear only if demand for it arises.
So far-sighted marketers are constantly studying the lifestyle, habits, priorities and consumer behavior of a part of society that is able to buy medium and high-end vodka.
According to experts of Image Holding, the threshold of entry into the Ukrainian vodka market has increased several times in the last one and a half or two years — up to $ 12 million. The Chairman of the Board of Olympus also confirmed this assessment. As one example, the very low cost of manufacturing licenses for alcohol trading in Ukraine. In just one year, the cost of a license for the production of alcoholic beverages has increased tenfold, the cost of a license for wholesale trade — five. The rather low cost of obtaining various permits also contributes to raising the threshold for entering the vodka market.
But simply investing in production and advertising is not enough today — you need to have a well-developed distribution, established links with retail chains and more.
Market experts also do not expect a large number of new vodka brands (now called about 30 national brands). And it is not only the high cost of promoting a new brand. The increase in the number of brands is limited by the technological capabilities of the manufacturer, as well as the dimensionless store shelves. Therefore, large manufacturers are likely to increase the number of brands, not prescription vodka.
Vodka problems are not limited to competition among themselves. An increasing role in the alcohol market is played by retailers. Network merchants are already trying, and it should be noted, unsuccessfully, to dictate their will to manufacturers. For example, the products of UGC Nemiroff disappeared from the counters of the Furshet stores (approximately 1.25% of its vodka sold in the Furshet). The reason for refusing to be accommodated at the Buffet table at UGC Nemiroff is explained by the fact that the management of the network demanded the supply of products at low prices.
Analysis of the market of alcoholic beverages, including vodka, showed that a significant increase in consumption of vodka in Ukraine in recent years is not observed — 30-35 million dal per year (or 6-7 billion USD in retail prices). The discrepancy in estimates of sales of $ 5 million is explained by the contribution of shadows — illegal production and sale of alcoholic beverages remain a major problem in the liquor market.
According to estimates of the largest vodka producers, about 30% of the market is in the shadow today. Two years ago, illegal drinkers accounted for up to 40% of the sale of hard drinks. The reasons for maintaining a large proportion of the shadow segment are called different. Most often, there is a large amount of illegal alcohol. According to the chairman of the supervisory board of Soyuz-Victan, «10-15 mln dal of shady vodka is produced in the country, which consumes 4-6 mln dal of alcohol. As long as the unaccounted-for turnover of alcohol remains, there will be a shadow vodka.
It is no wonder, then, that in such circumstances, the distilleries are looking for a direct path to the consumer. For example, according to the official website of the company, the owner of the Bondarev vodka factory has started the project of its own retail network «Point».
According to the calculations of specialists of the corporation Olympus, Nemiroff, companies Soyuz Victan and Image Holding, Ukrainians prefer the mid-price segment. This statement is also supported by market research and evaluations conducted by leading research companies.
Regarding the middle price segment, it can be noted that sales volume has remained approximately the same in recent years, but experts note a slight decrease of 1-2%.
2.3 Strategic analysis of PJSC N …
Internal and external analysis based on the SWOT matrix (Table 2.3.1.) Showed the following trends.
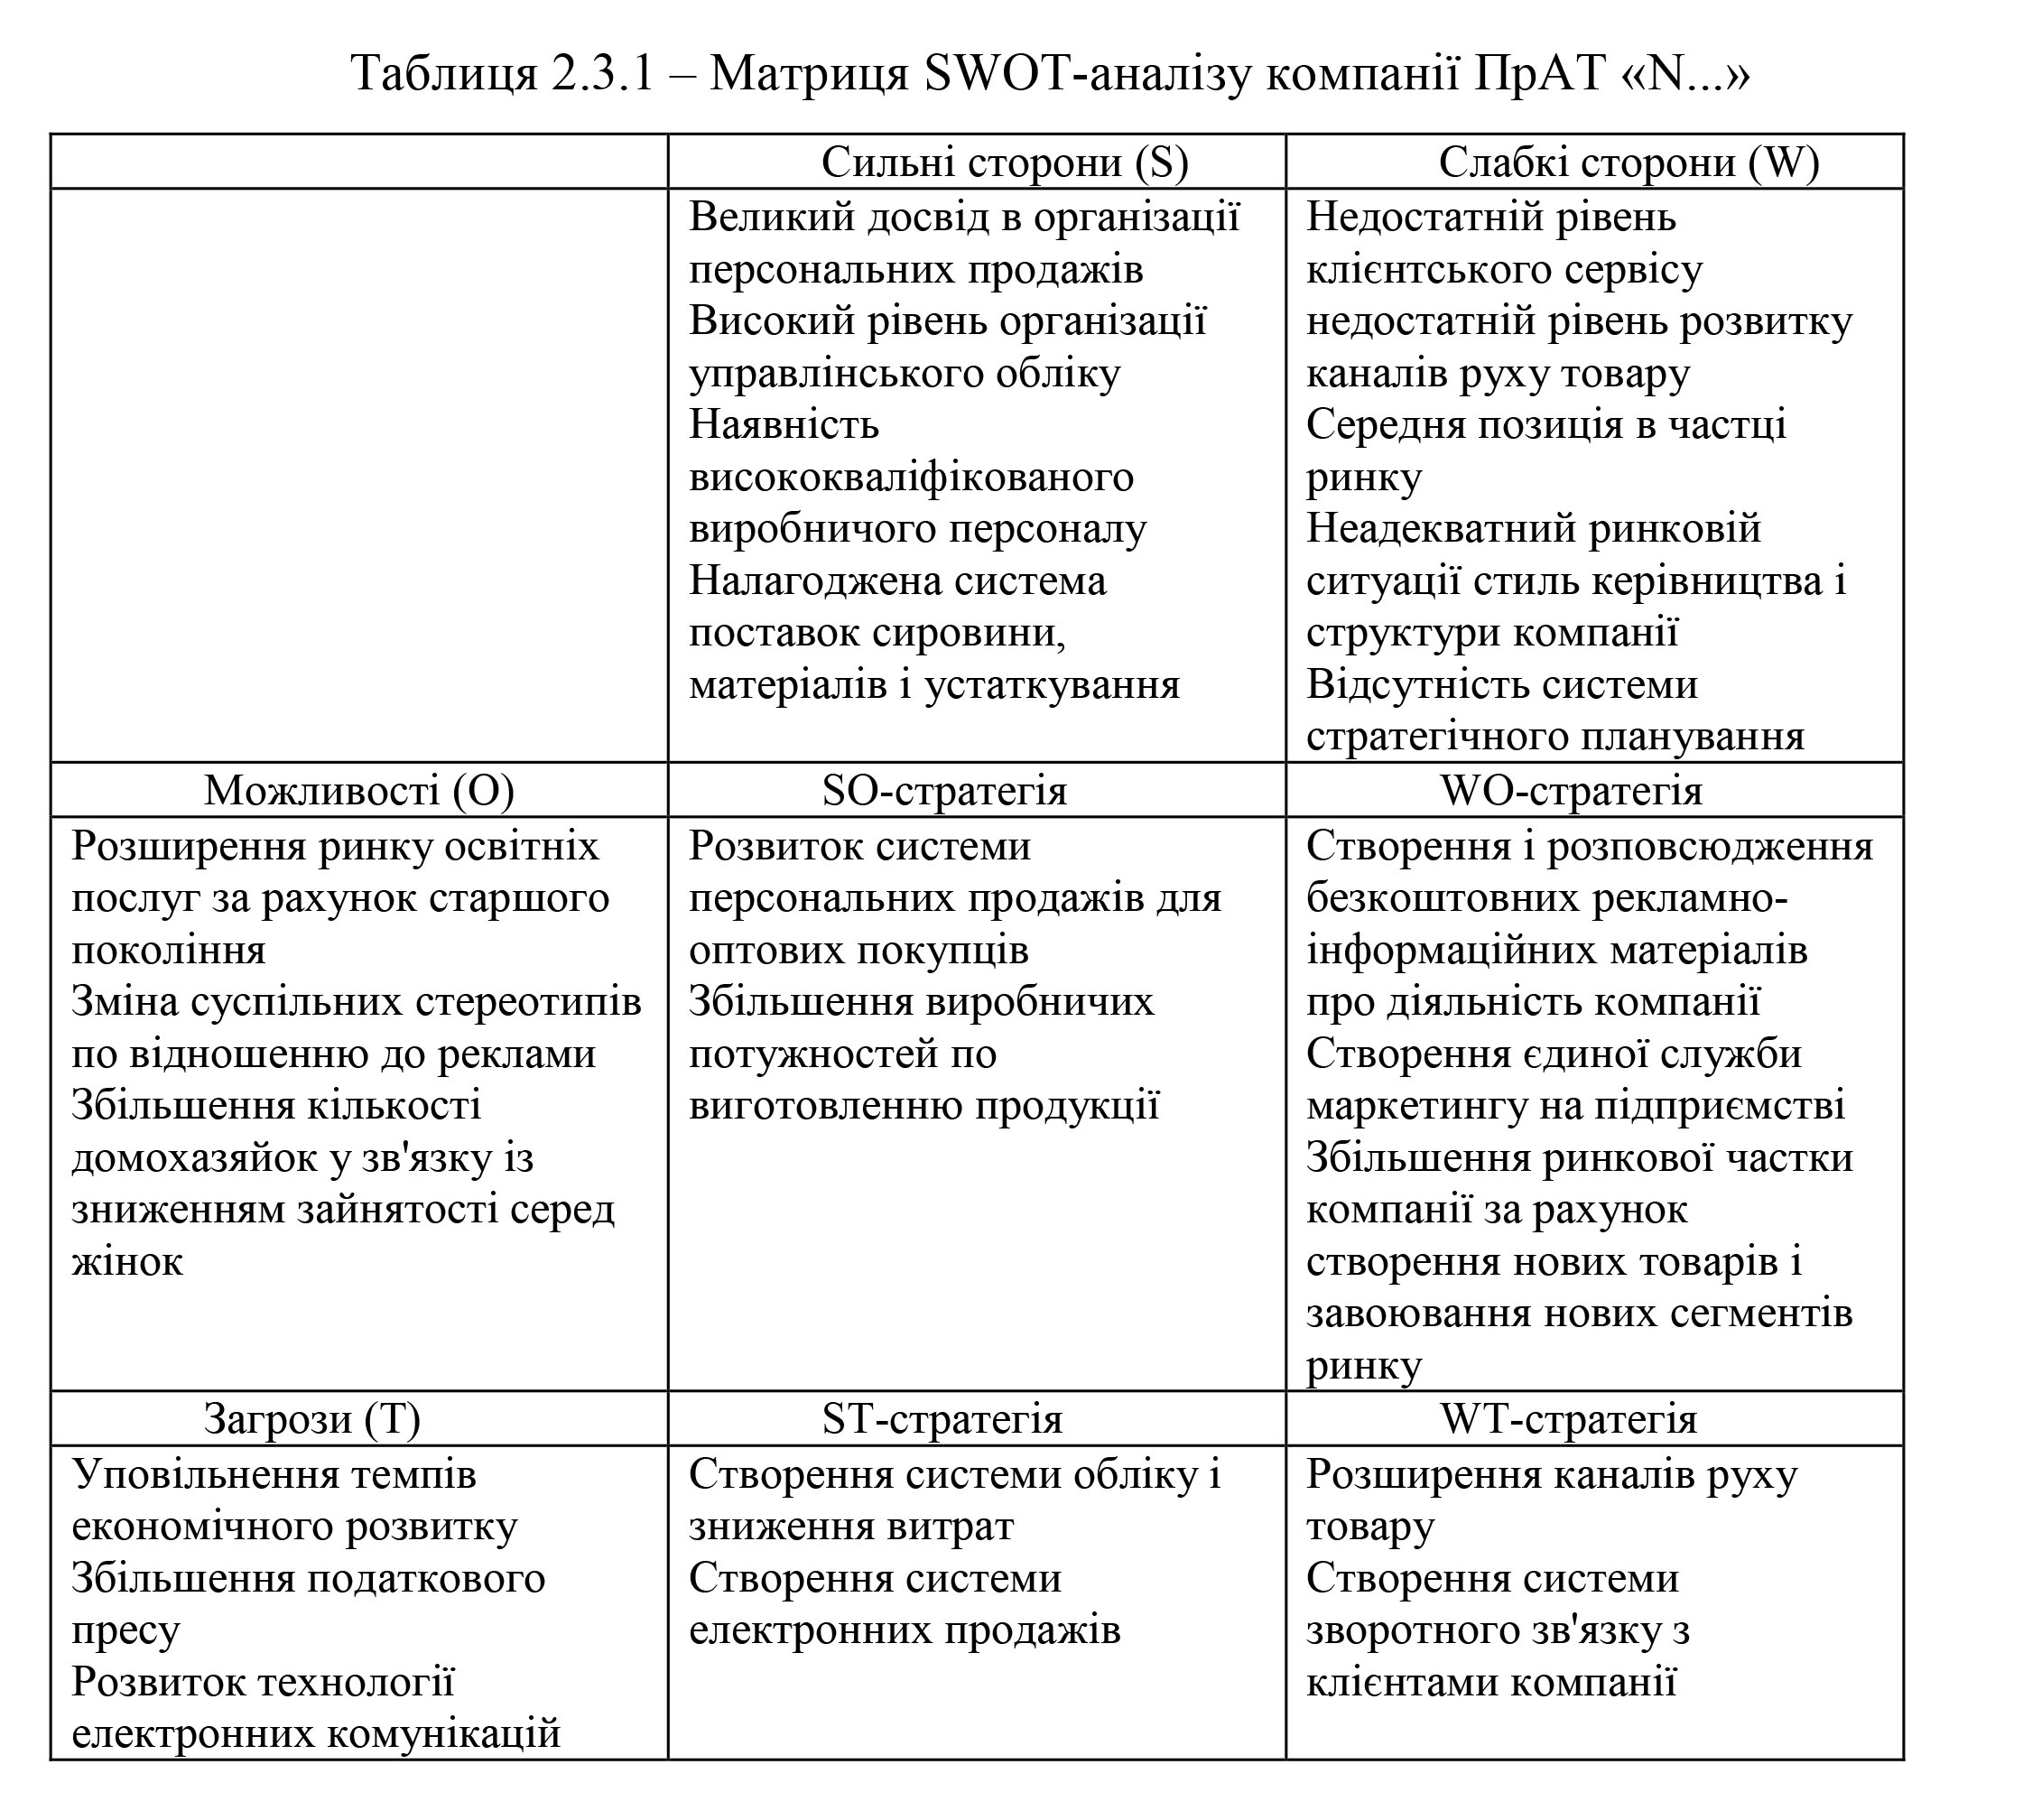
Right now there is a capture of promising sectors of the market, there is a geographical expansion. In an increasingly competitive environment, proper positioning is very important. You need to find your market segment and fight for it.
The main reasons for the decrease in the share of PJSC “N…” in the regional sales are:
- the emergence of new market players and the increasing level of competition between them;
- Decrease in the purchasing power of the population, due to the prevailing rate of increase of tariffs for housing and communal services, rising inflation and lower real incomes of the population;
- weakening of the commercial work of PJSC “N…”, deterioration of the management of trade processes, from the purchase of goods to the full realization of their retail stores.
The above facts adversely affected the structure of wholesale turnover of PJSC “N…”, which reduced its potential revenue potential.
Despite the work that has been done to intensify the activity, to strengthen its relations with the retail trade enterprises of the system, the proper result has not yet been achieved.
PJSC “N…” has all the prerequisites for the implementation of the set strategy: mobility, human factor, cooperation with major suppliers and buyers. The problems of product planning and sales are discussed at meetings held by major customers.
5.3 Determination of production profile of PJSC “N…”
Sales of goods should be preceded by marketing research that contains the characteristics: the product itself, its prices, methods of its distribution and sales promotion, aimed at improving the competitiveness and quality of goods and services, ensuring the growth of market share.
Conducted marketing research of qualitative components of vodka made it possible to identify the most significant characteristics of vodka for consumers. The most significant for the experts is the taste, then the strength, in the third place — the price. They are followed by other organoleptic indicators, the image of the manufacturer, information components, packaging, etc.
Table 5.3.1 lists the main properties of vodka and the attributes that make up the impression of this drink. Conducted a cross-sectional ranking of the above characteristics by the degree of importance for the consumer, using the expert method of the point scale in reverse order of growth: the most significant characteristic corresponds to 1 point, etc., ie, the less significant the characteristic, the greater the value of the score on the scale. Thus, the most significant for consumers were:
— among the main properties of vodka — quality, taste and protection system against counterfeiting;
— among the related, that is, the attributes of the environment — the price and image of the brand.
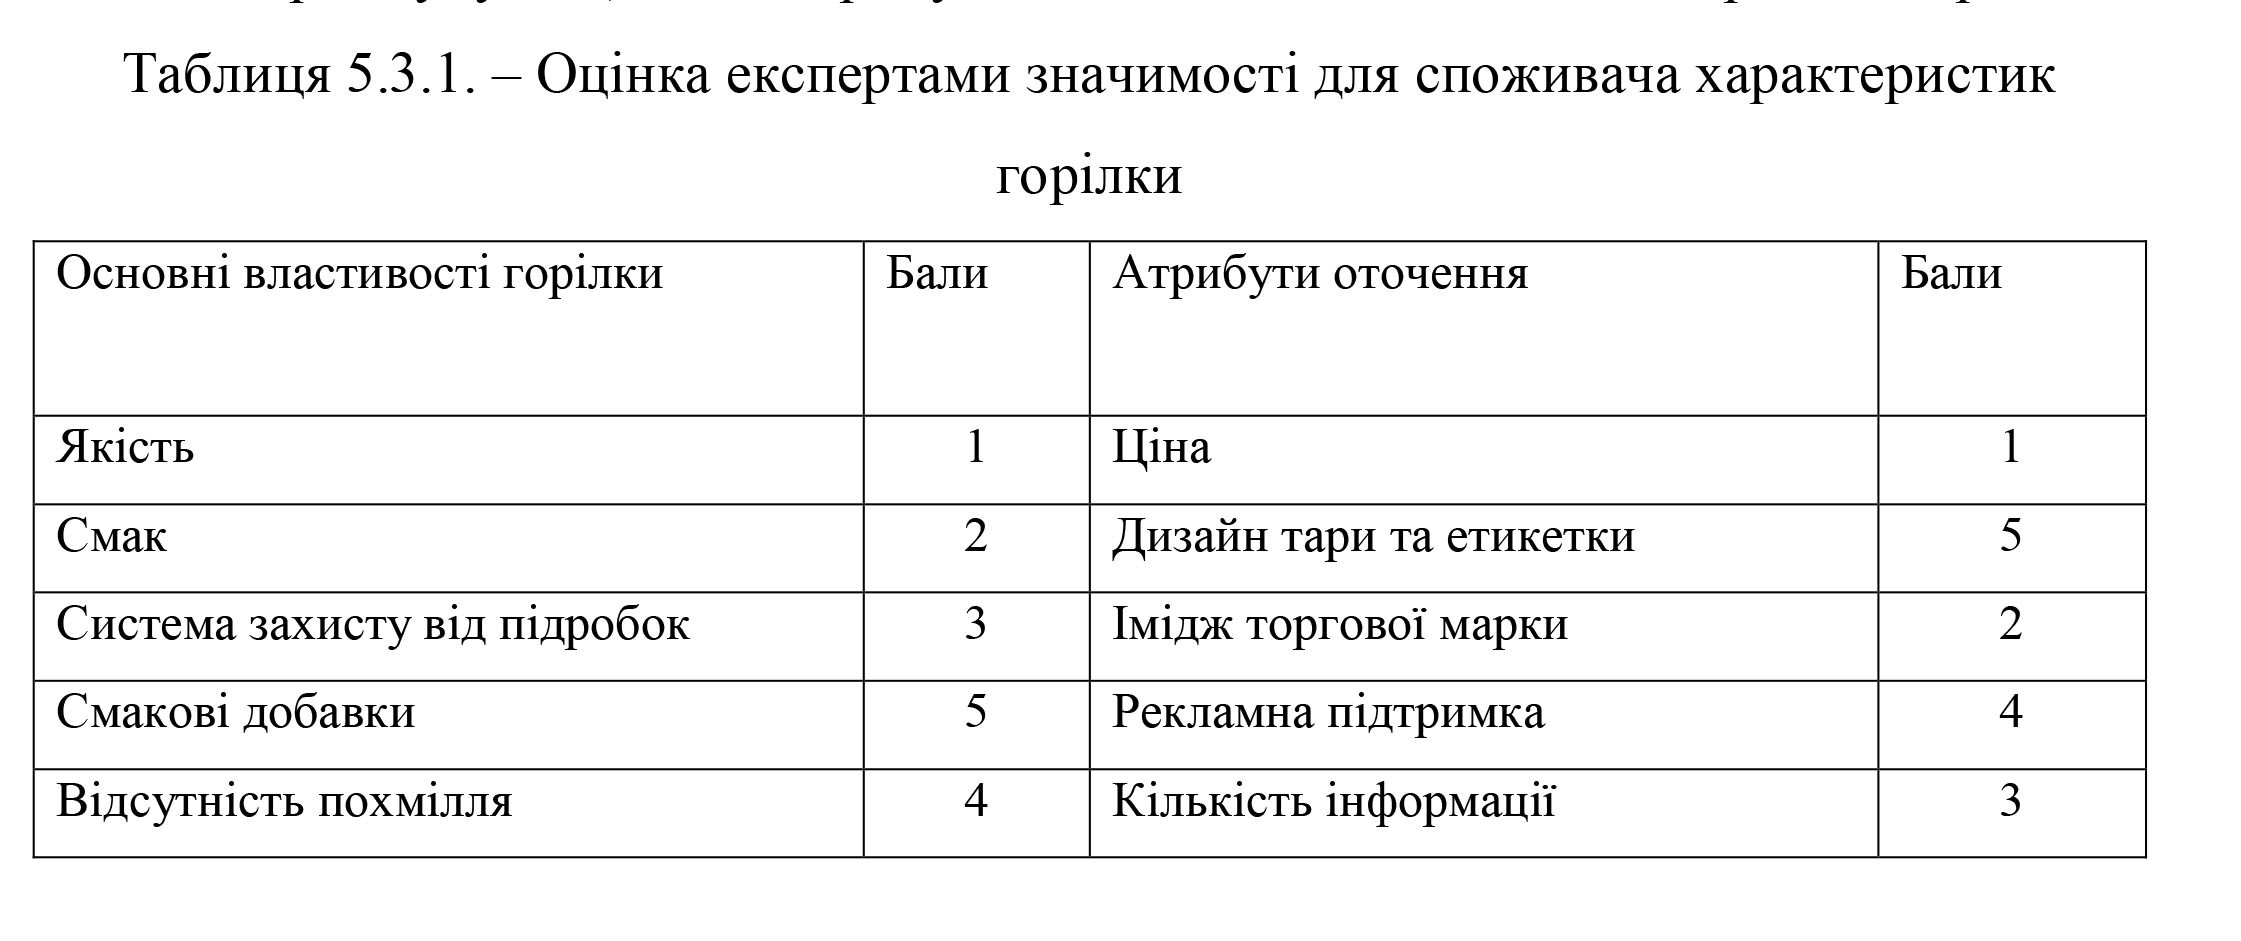
Therefore, in the formation of vodka brand profile and the production of its product assortment, PJSC N … should be guided by the identified advantages.
7.1 Basic principles of formation of marketing-oriented management system of JSC «N …
The purpose of forming a marketing-oriented management system of PJSC “N…” is to increase competitiveness and attractiveness (both social and investment), which will lead to higher income.
For most Ukrainian commercial organizations, the formulation of the mission associated with obtaining the maximum profit that meets the classic motivation: income, profit, and survival is typical. At the same time, it is proved that any organization in an open market environment is an open system and can only develop successfully if it meets the requirements of the external environment, so profit may not serve the purpose, but a means of achieving it. Choosing an appropriate mission involves establishing a consumer segment and exploring their needs.
Based on the analysis made in the previous sections of this report regarding the state of affairs in the sphere of activity management of PJSC “N…”, we can note the following disadvantages:
- lack of a unified methodological approach to the marketing concept of the company;
- orientation of the company management on outdated marketing concepts;
- lack of a single marketing service at the enterprise and purposeful activity in the field of marketing;
- lack of clear strategic goals and plans of the company and line units;
- insufficient activity of the company in the field of advertising and sales promotion;
- absence of an established system of «feedback» with buyers of goods and services of the company.
As the main directions of formation of marketing-oriented management system of PJSC «N …» in the future can be distinguished:
- creation of an adequate market for organizational structure. It’s about setting up a marketing team, but to get started as a marketer working in the supply and sales department. It will allow to constantly analyze the marketing situation in the market, to react in time to changes and accordingly to conduct effective marketing policy;
- formation of a complex system of trade services (introduction of services for delivery of goods directly to retail stores). Implementation of this direction will significantly increase the profitability of PJSC “N…”, will help to improve the quality of service;
- implementation of rational assortment policy that will take into account seasonal variations, forecasting of demand volumes, etc .;
- Improvement of methods of stimulation of counterparties (through competitions of intermediaries, lotteries, etc.)
- rational location of the head office and warehouses of PJSC «N …», which, in addition to accessibility for most sellers, will save the cost of delivery of goods.
- introduction and improvement of modern progressive methods of sale of goods (it is necessary to introduce the sale of goods by catalogs, samples, pre-orders, registration of orders via the Internet);
- introduction of progressive forms of organization and stimulation of labor of employees of trade enterprises, by introducing the dependence of wages on the overall result of the enterprise’s activity, ie income.
- Provision of additional services to buyers without reducing retail prices. However, any action aimed at increasing trade turnover and not accompanied by price increases requires additional costs.
Formation of marketing-oriented management system is impossible without measures aimed at improving the use of material and technical base. It is worth implementing computerized enterprise management systems (currently only accounting and accounting operations are computerized). As the main direction of modernization of the trading network of PJSC «N …» can be offered reconstruction and technical re-equipment of warehouses and trading halls in order to create modern conditions of storage and transportation (it is necessary to fully mechanize the work of loaders), which will allow to reduce their number, terms of loading and unloading works. their quality. As a result of the planned measures, both economic (increase of profit) and social effect are expected to increase.
7.5 Assessment of the enterprise’s readiness to form a marketing-oriented management system
Assessing the readiness of an enterprise to form a marketing-oriented management system is a significant element in the process of preparing the optimization of marketing units in the company. The characteristics that characterize the willingness of the company to form a marketing-oriented management system include:
- the definiteness of the mission;
- definition of the goals and strategy of the enterprise;
- availability of a well-established mechanism for collecting, analyzing and processing marketing information;
- work on improving the competitiveness of the enterprise;
- adaptability of the enterprise to the opportunities that are being opened;
- orientation of current management to fulfill strategic tasks of the enterprise;
- organizational separation of strategic management tasks from operational management tasks;
- availability of headquarters units providing in-house consultancy on strategic development issues;
- invitation of outside consultants to solve non-specific tasks;
- constant informing of personnel on strategic goals and plans of the enterprise;
- high level of corporate culture;
- presence of an effective marketing unit at the enterprise.
Identification of the degree of manifestation of the characteristics that characterize the company’s readiness to use marketing principles in the formation of management systems, was made expertly by the Delphi method. Experts were independent consultants and top management of the company, which ensures the confidentiality of the event and does not require the involvement of large resources. In addition, this technique can be repeatedly reused to control the effectiveness of the measures taken to improve the current situation.
To assess the readiness of the company to form a marketing-oriented management system of experts, it was suggested to evaluate the degree of manifestation of each of the above signs in the company’s activity — to give estimates that correspond to the degree of manifestation of one or another sign:
«5» — if this feature is fully detected at the enterprise;
«4» — if this feature is not completely;
«3» — if this sign is weak;
«2» — if this feature is not detected.
The overall rating of the company’s readiness is a weighted average score:
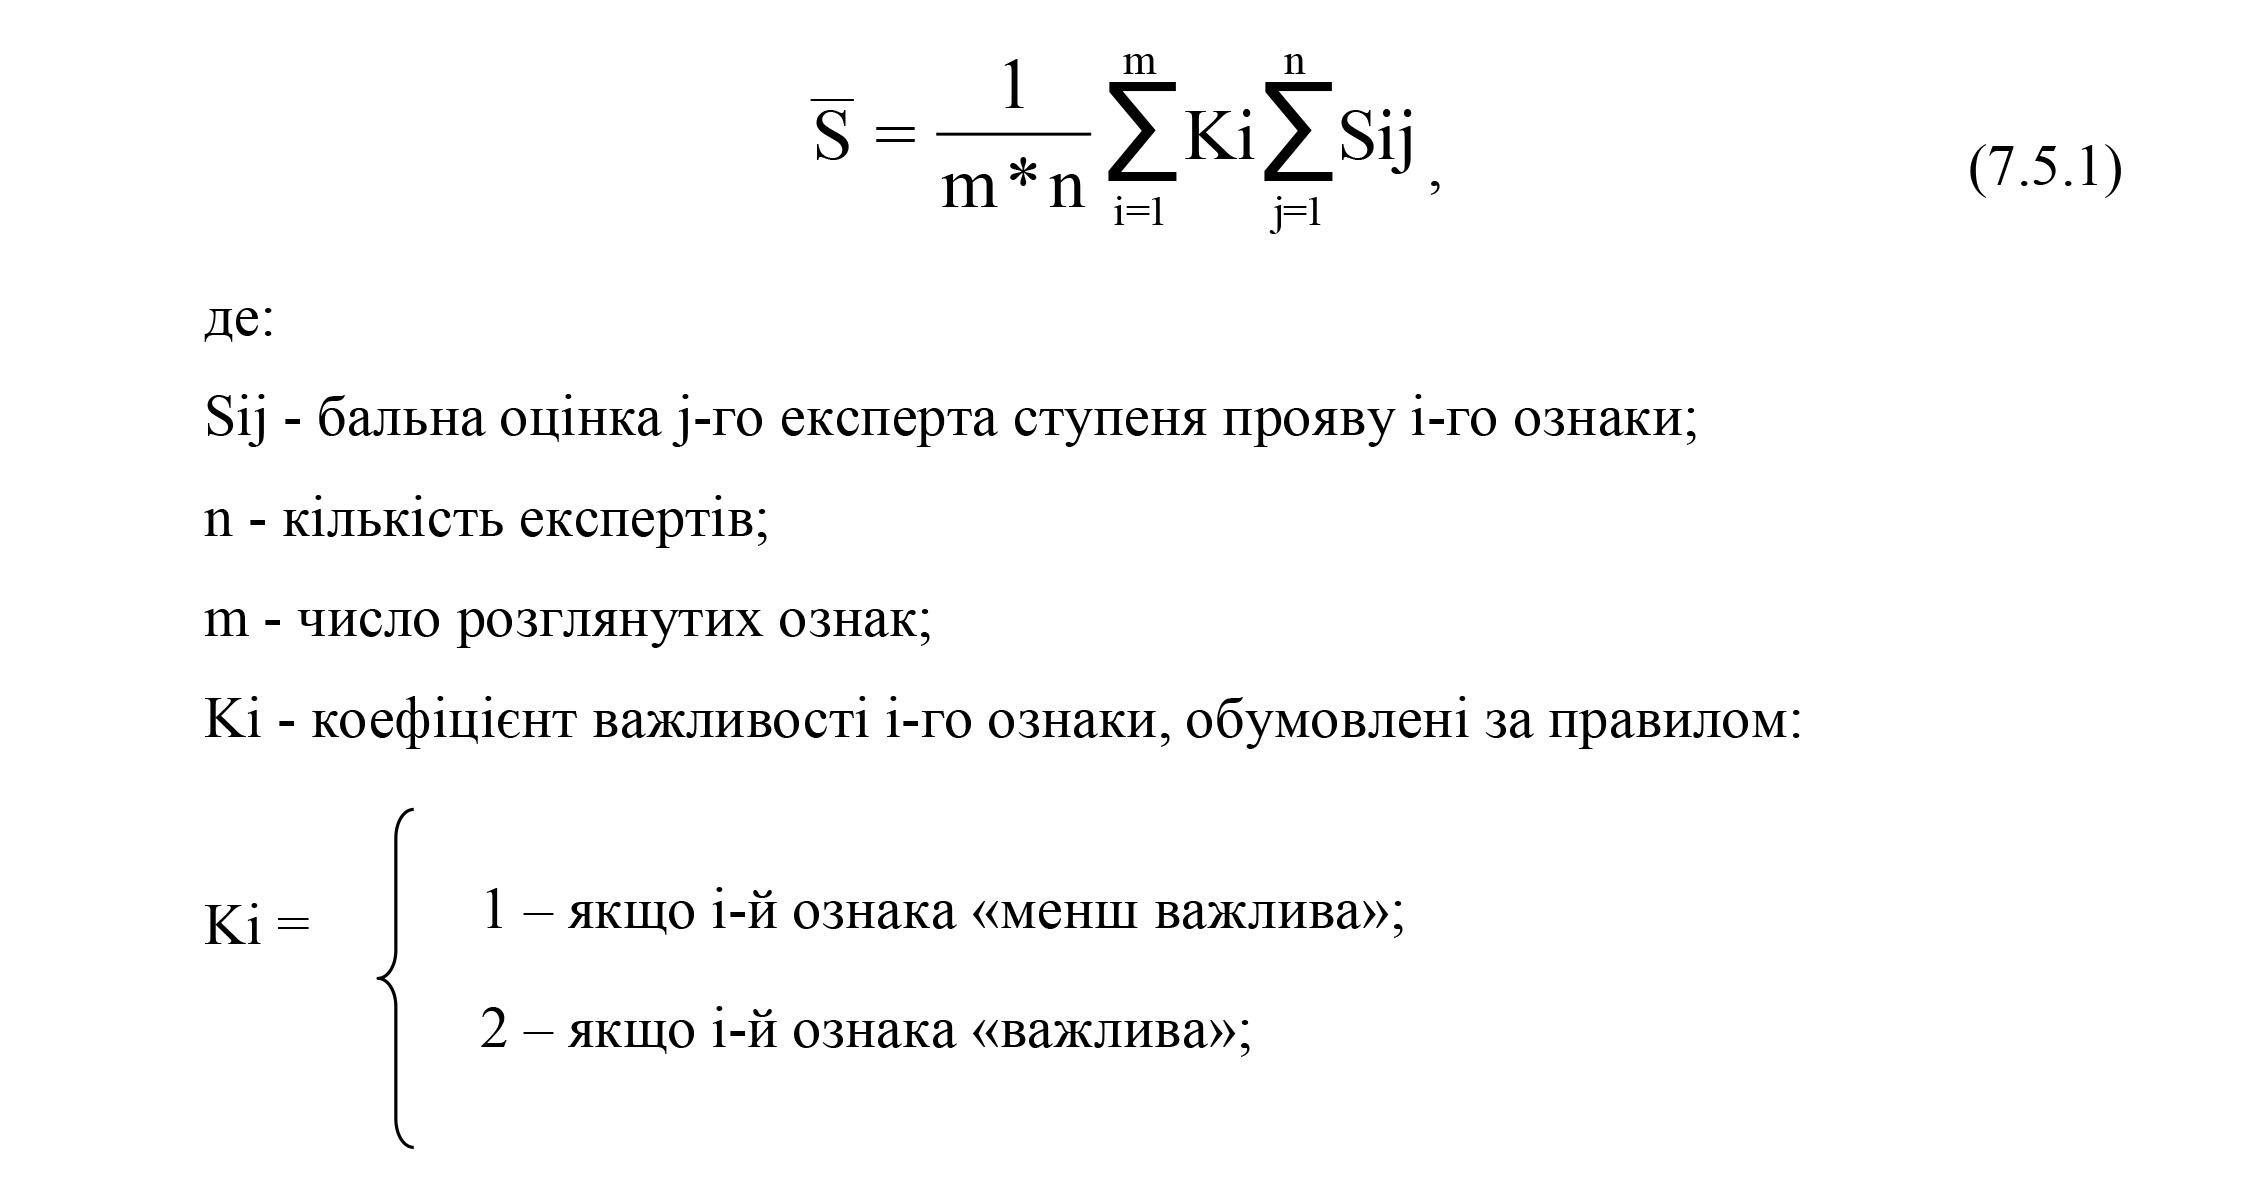
It is accepted that all signs are of equal importance and k = 1.
Ten experts participated in the evaluation, thus n = 10 and m = 12.
Calculate by the formula 7.5.1 the following limit numbers:
b min = 0,2 — corresponds to the case of complete manifestation of all signs;
b sl = 0,3 — corresponds to the case of weak manifestation of all signs;
b nn = 0,4 — corresponds to the case of incomplete manifestation of all signs;
b max = 0,5 — corresponds to the case of full manifestation of all signs.
For the formulas:
1, b = b + 0.75 (b fault CR fault — b ) (7.5.2);
b ср = 0,5 (b ideal + b max ) (7.5.3);
b 2 = b NP + 0,25 (b max — b TM ) (7.5.4);
calculate the thresholds b 1 = 0.275, b cf = 0.35, b 2 = 0.425 and display the calculated thresholds in Fig. 7.5.1.
The degree of readiness of the company to form a marketing-oriented management system should be evaluated as:
- very high if the result falls within the range b 2 — b max ;
- high if the result falls within the range b av — b 2 ;
- moderate if the result obtained falls in the range b 1 — b Wed ;
- low if the result is within the range of b min — b 1 .
Table 7.5.1 summarizes the results of the generalized assessment by PJSC “N…” managers and independent consultants of the twelve listed readiness.
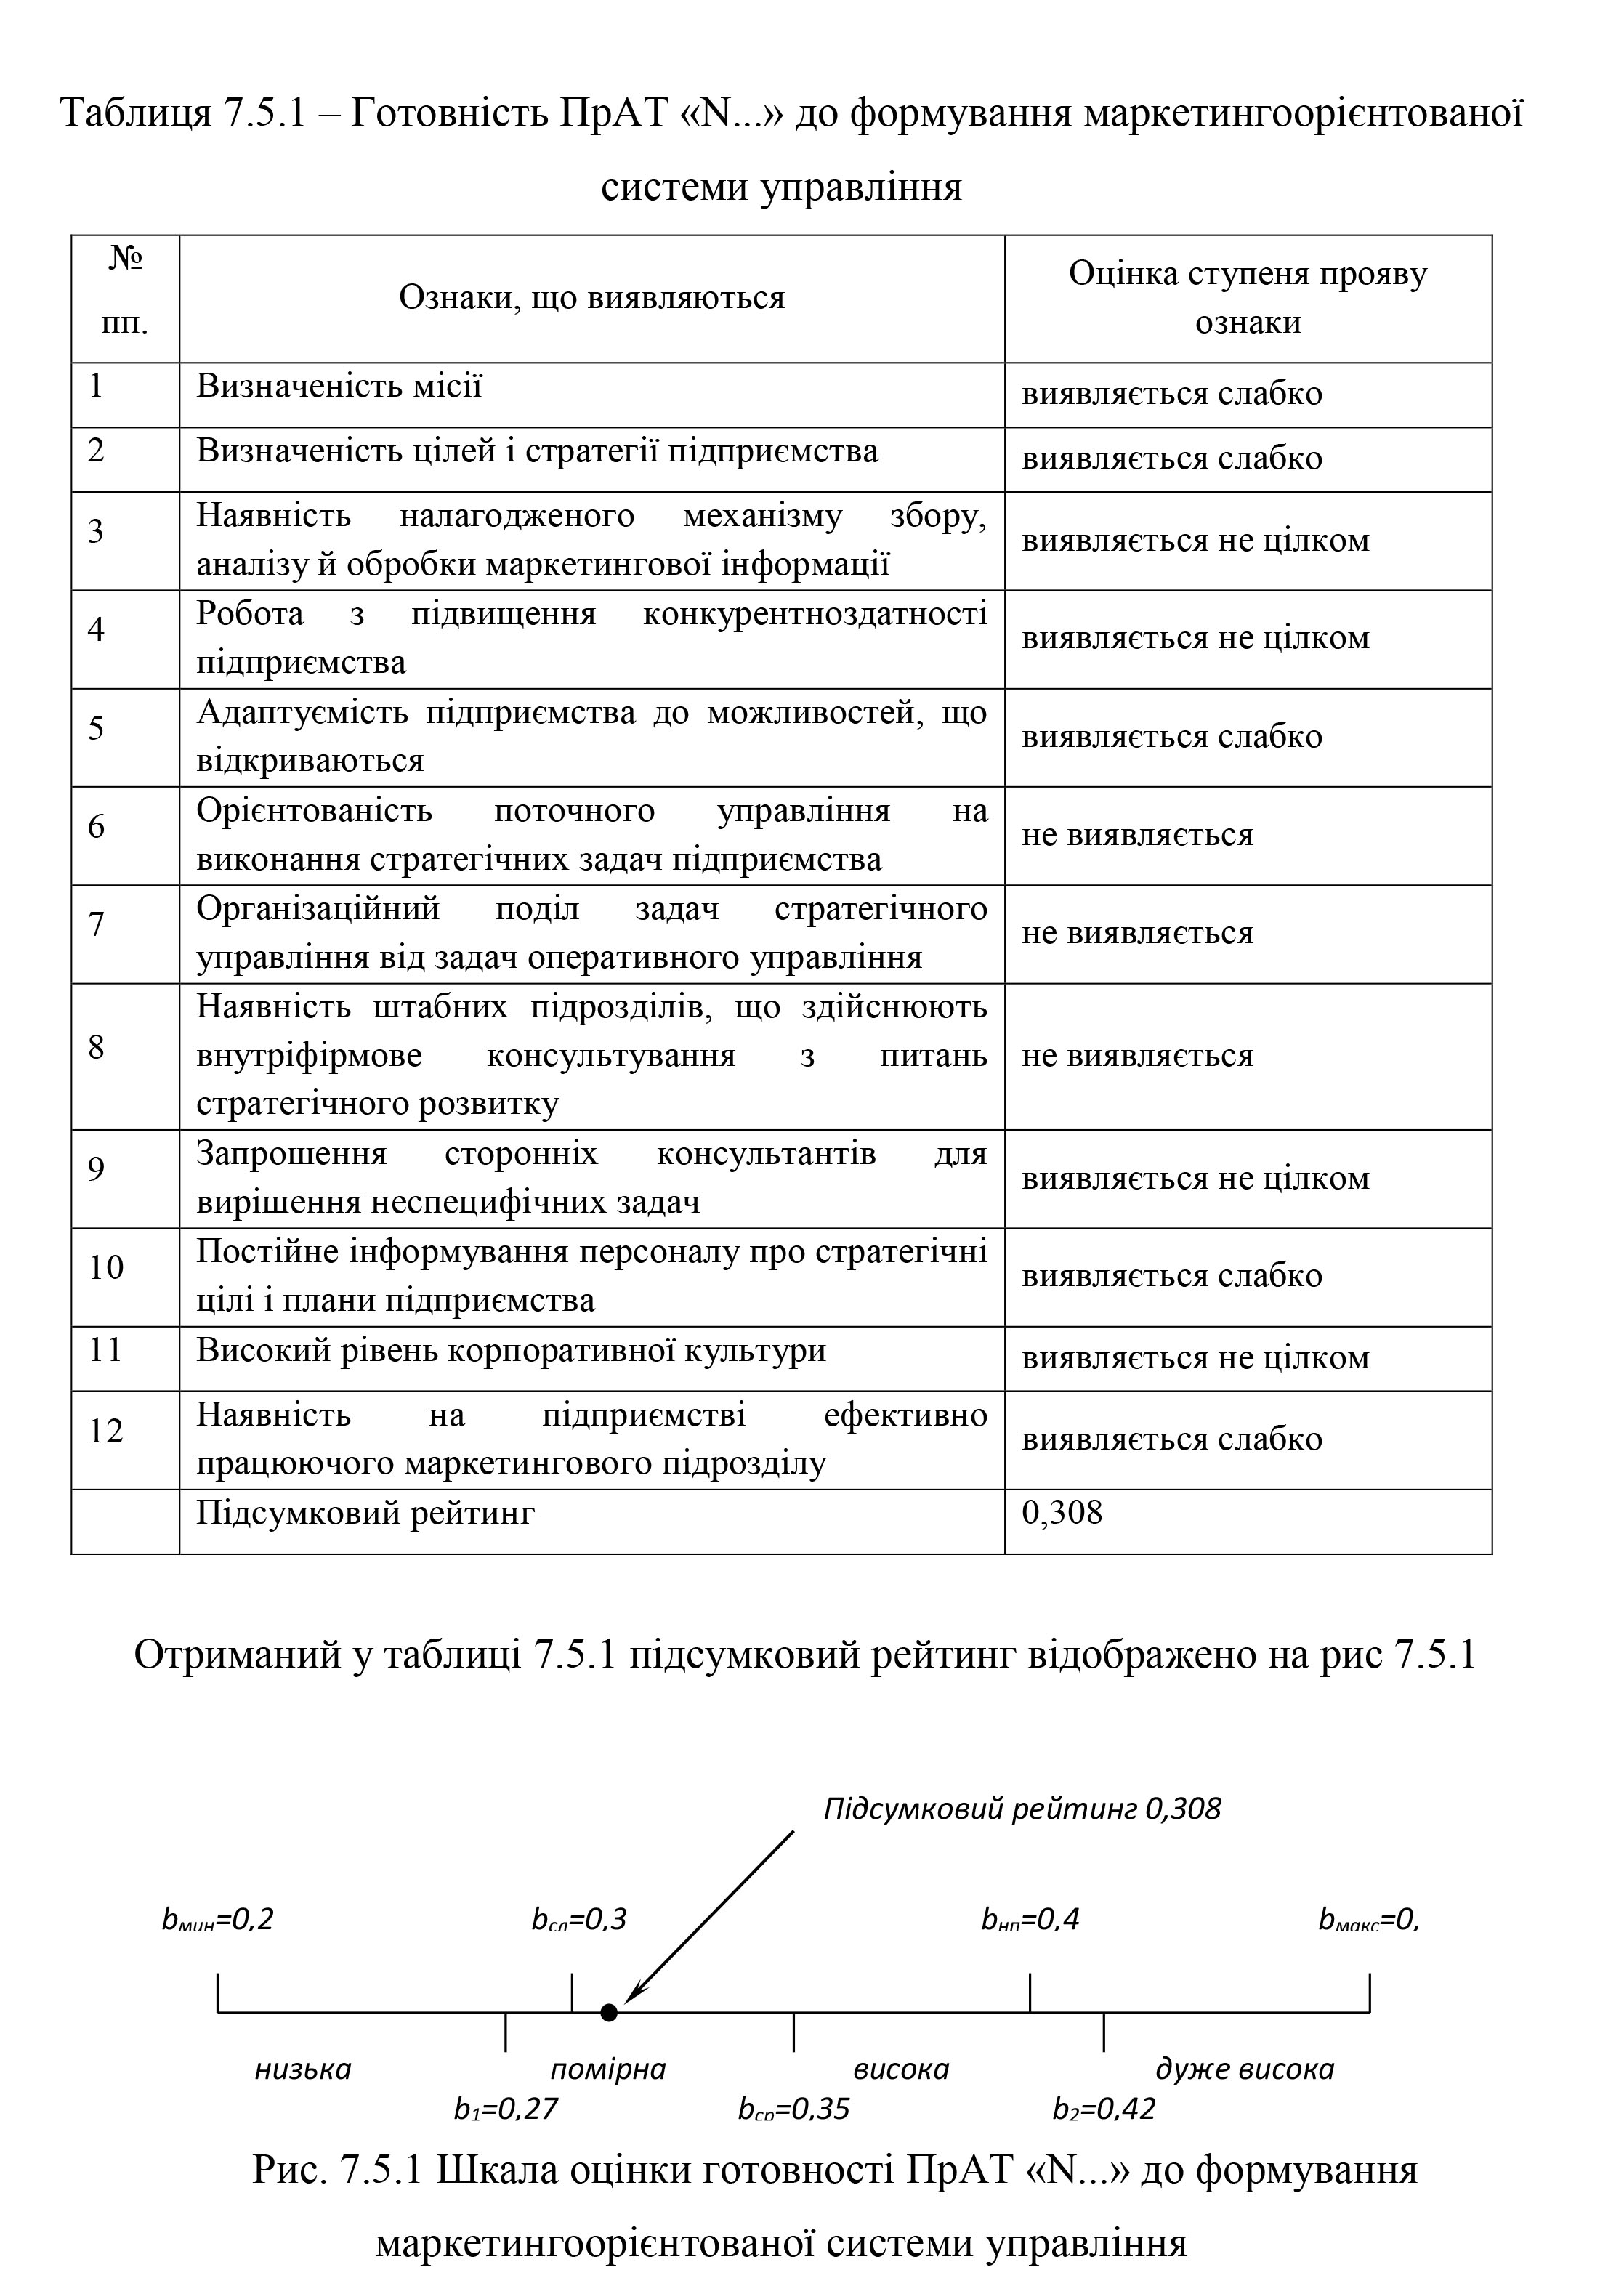
Based on the obtained assessment of the degree of readiness of PJSC «N …» we can draw the following conclusion: the company as a whole is ready for the implementation of marketing strategy and optimization of the marketing service, which will be responsible for preparing the structure of the company and staff for its implementation, but it is necessary to determine more specifically, corporate strategy and develop other strategic aspects of operations, and create the preconditions for alignment with operational activities.
9.2 Basic principles of formation of marketing service (department) at PJSC “N…”
Despite the fact that the company does not have a single marketing service, marketing functions are performed by different units. The first step in setting up an enterprise marketing service is to define its organization system. The organization of the marketing department for commodity production, which is presented in Fig. 9.2.1, meets the needs of the company most fully.
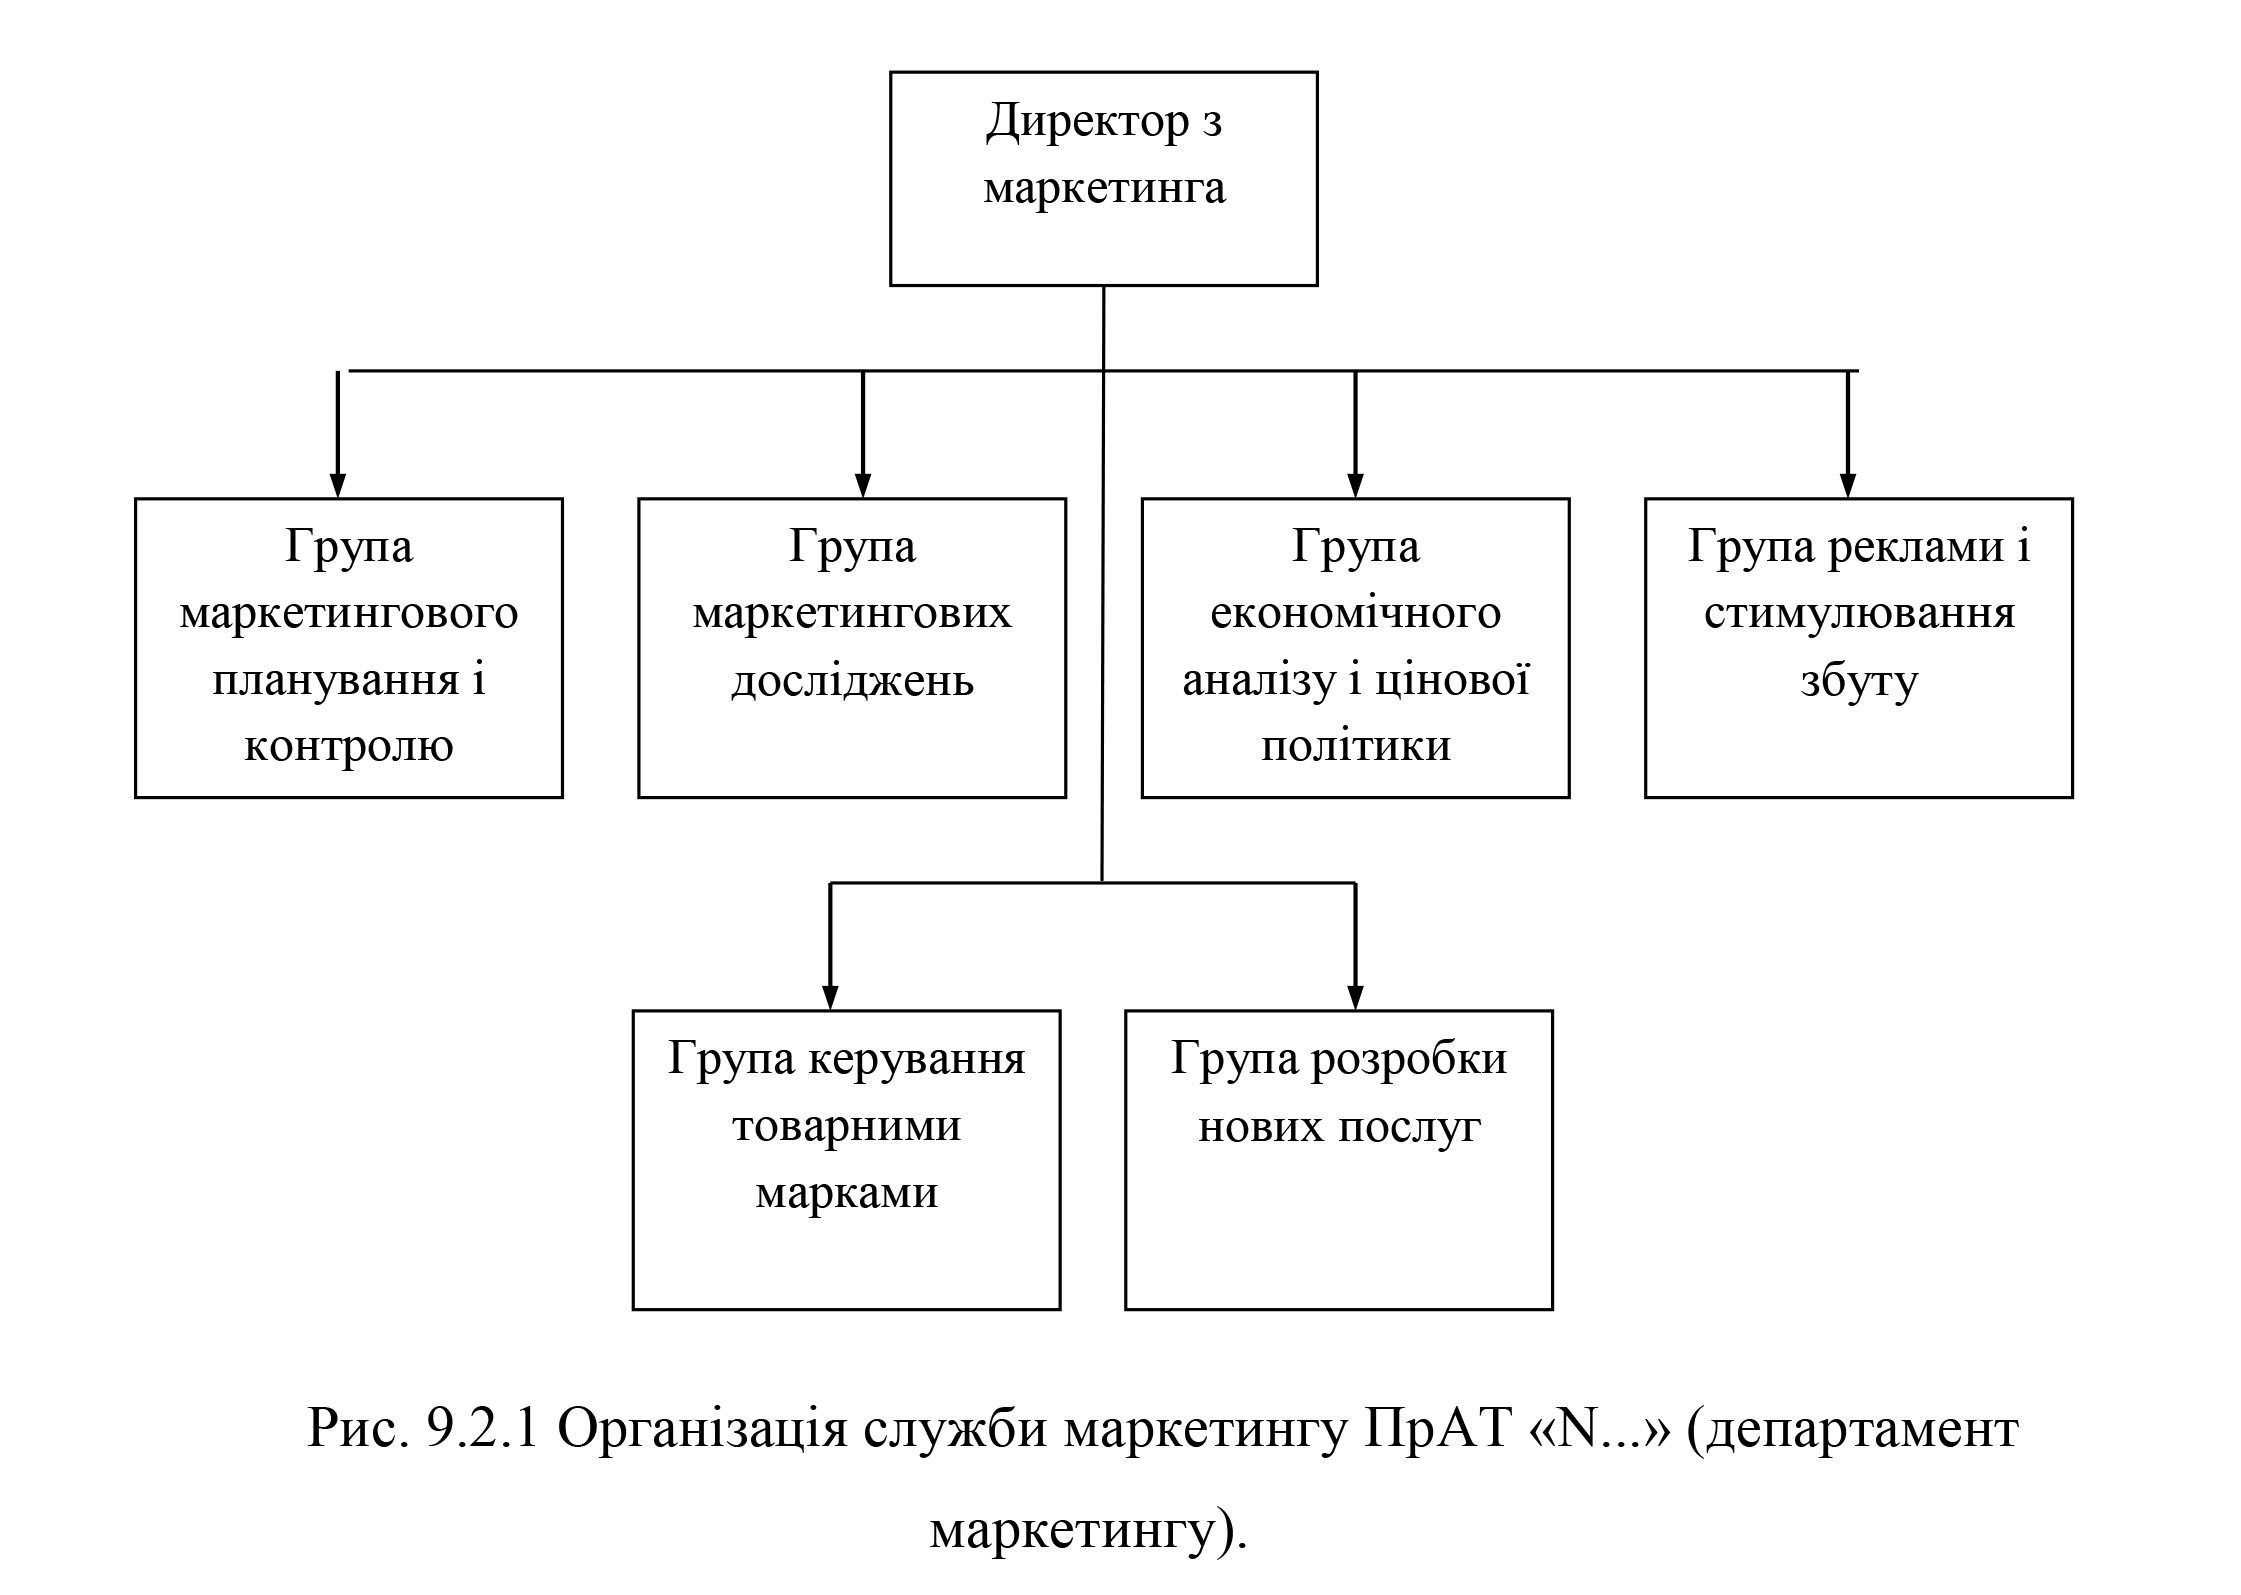
We will define in detail the proposed structure, as well as the functions of groups, functional responsibilities of employees and communication with other divisions of the company. The basic principles that are proposed to lay down when creating a marketing service:
- the marketing service is organized as an independent unit (department);
- the marketing department has in its composition groups (departments) that plan, organize and control the performance of certain marketing functions of the company;
- in the course of their activities the marketing department in a special (functional) respect subordinate the relevant divisions of the company; that is, the marketing department plays the role of a kind of «intellectual headquarters» of the company.
The Marketing Director manages the company’s marketing department, organizes and manages all of the company’s marketing, advertising and sales promotion activities. He is the first Deputy CEO and in his absence performs his functions. Functionally, he is a member of the board of directors of the company and reports directly to the CEO. He is directly subordinate to the heads of groups of marketing department, and in a special respect — directors of departments, divisions and services, performing marketing functions and tasks in the company.
The Marketing Planning and Control team is responsible for strategic and ongoing planning of the company’s marketing activities. The specialists of this group supervise the execution of marketing functions by the company’s departments, which are not structurally part of the marketing department. They are also tasked with periodically auditing the organization of marketing activities at the enterprise.
The Marketing Research Team is responsible for planning, organizing, gathering information and processing the results of marketing research conducted by the Marketing Department. In this case, any element of both external and internal marketing environment of the enterprise can act as a field of research. If necessary, the experts of this group can involve external experts in marketing research.
The group of economic analysis and pricing policy analyzes the economic indicators of the enterprise. At the same time, the tasks of the group do not include the tasks of financial analysis and activity planning. Specialists of this group determine the company price policy, discount policy, make company price lists.
The Advertising and Sales Promotion Group is intended for the planning, organization and control of the Company’s advertising activities, product promotion and sales promotion activities. The same group is responsible for maintaining the company’s public relations.
The brand management team consists of brand managers (brand managers), whose task is to coordinate the entire marketing mix of their brand and to determine the company’s trademark policy for each brand. Managers in this group can respond more quickly to the smallest changes in the market situation, they are better than other employees of the marketing department know the features of their market segment and their product (brand).
The new product and service development team is responsible for planning, organizing, and overseeing the company’s operations in the development and implementation of new products and services, as well as the withdrawal from the market of products and services whose life cycle is nearing completion.
The proposed structure of the marketing department and the level of authority of its employees are maximally adapted to the peculiarities and needs of PJSC “N…” at this stage of activity. It is possible that in the process of implementation of this proposal, you will need to review the functions of individual units or to introduce additional groups in the department itself. The initial costs of establishing a marketing department and the costs of supporting the department’s activities are shown in Table 9.2.1.
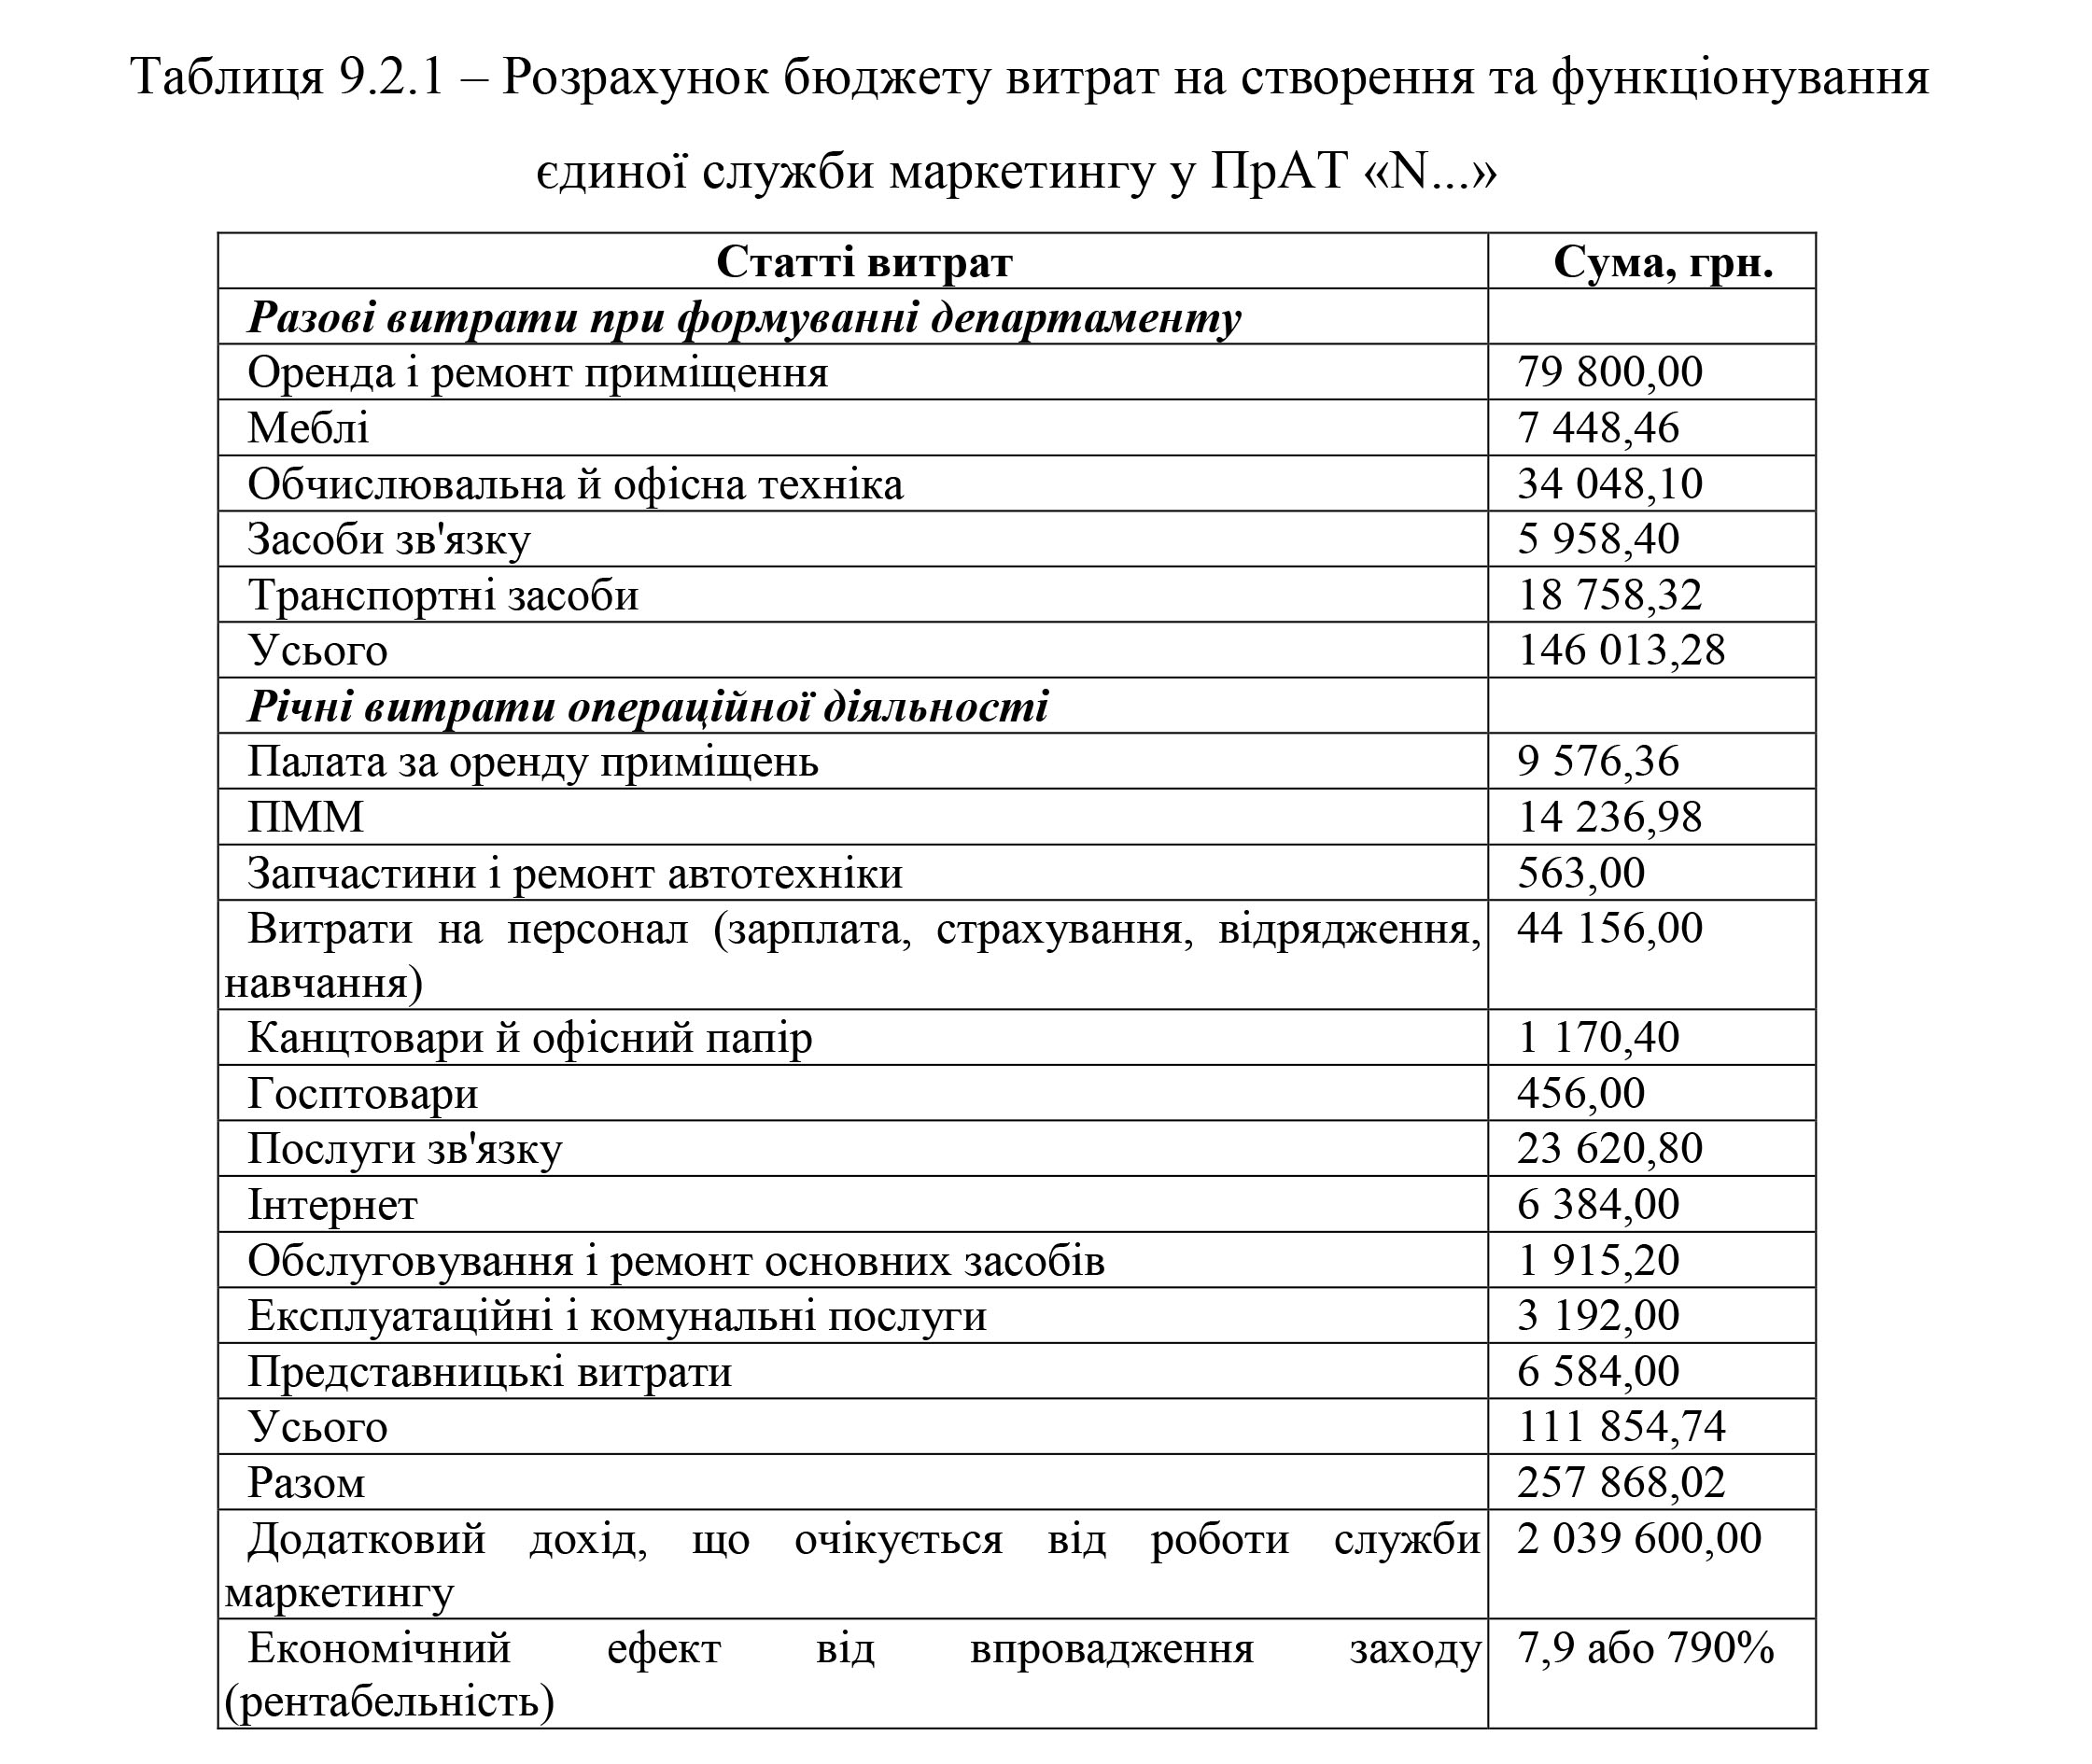
A single marketing service should consist of highly qualified marketers. When selecting specialists in the formed marketing service it is necessary to pay enough attention to the professional training and versatility of the skills of new employees. In addition to purely marketing problems, the created marketing service will have to solve the issues related to the redistribution of functional responsibilities and structural relationships within the company, to make explanatory work among employees about the role and place of marketing in the modern economy.
It should be borne in mind that the creation of a single marketing service is a rather costly and time-consuming event. If the company management policy in this direction is ambiguous and inconsistent, then the marketing director will have to repeatedly assert the expediency and necessity of certain measures. Probably, the majority of the company’s employees is dominated by the stereotype that the effectiveness of measures can only be judged by its instantaneous economic efficiency, which is indirectly confirmed by the moderate degree of readiness of the company to formmarketing-oriented management system. Therefore, it is strongly recommended that the first steps taken by the new marketing service are advertising and sales promotion. Priority, organization and competent implementation of advertising and sales promotion activities will allow the company to significantly increase its own gross revenue, while the marketing service will «justify» its own necessity and efficiency, and cover the initial costs of its own formation and maintenance.
CONSTRUCTION OF A FUNCTIONAL MODEL OF THE PLANNING SYSTEM AT THE ENTERPRISE KP «KHARKIV THERMAL NETWORKS»
Published in 2010 — K .: Municipal Utilities — KhNAMG, Kyiv Technique, 2010 — p. 141 — 149 © Nemtsov OV
Keywords: Planning system, structure of planning system, simulation modeling, functional model.
The system of planning for Kharkov’s heat supply enterprises is built. This system is formed as functional model, using program product AllFusion Modeling Suite 7.1. Avtor’s vision of structure elements this system and mechanism their correlation is offered. The logic of process these elements forming and functioning is elucidationed.
The planning system of any enterprise, including KTM KTM, is a complex socio-economic system that operates in a dynamic, stochastic, deterministic, rapidly changing environment. Therefore, as for any system of this kind, it is characterized by considerable connections, which in many cases are poorly formalized, have no clear dependence between each other, are probabilistic in nature, and are not subject to strictly defined dependencies, when another specific event necessarily occurs. an event in which the behavior of the system itself is poorly predicted and difficult to describe. Today, the aforementioned inconveniences when trying to describe or inflate any complex object or process, especially in dynamics, are counteracted by simulation modeling that allows one to artificially create such an object or process,
Analysis of recent research and publications. The following scientists have been engaged in the problems of formation of the planning system: I. Ansoff, R. Akoff, D. Han, OB. Bad. Issues of modeling, in particular simulation, were researched by many domestic and foreign scientists and leading experts in different fields of knowledge: Kizim, TS Klebanova, S.V. Maklakov, EV Minko, A.E. Minko, EV Freudina, OO Belyaev, E.M. Short.
The purpose and purpose of the article. Build a planning system for a powerful complex of heat supply companies in the city of Kharkiv — KP «Kharkiv Thermal Networks».
Outline of the main research material.Modern computer technology makes the process of building a simulation model more convenient and understandable and less time consuming. In today’s conditions, enterprises have the opportunity not only to make a simulation model with the help of computer software, but also to create their own automated enterprise system. It should be said that today there are many computer programs that allow you to automate an enterprise management system, coordinate it with planning, direct execution, control of results, an information system that generates all the input and output information flows, or leads to such a situation. Among the software products that allow the formation of modern information-based automated control systems, the following can be mentioned: » SQL Monolith»: Operational planning», » Master MRP II «, » SyteLine ERP «, «Infors: Enterprise», » KIC » Omega Production «,» KIC «Galaxy», » iRenaissance «, » Lynx Enterprise ,» IT- Enterprise «,» VIRTUOZ TM «,» Cognos Enterprise Planning «,» Hyperion Performance Scorecard «,» Cognos Metrics Manager «,» Geac Performance Management «,» Pbviews «,»Aris BSC , SAP Strategic Enterprise Management , Intalev Navigator. Based on the analysis of the software products, we can conclude that one of the best options for building both a simulation model of the planning system and an automated management information system is the application of AllFusion Modeling Suite 7.1
software package. With the AllFusion Process Modeler software7.1, which is included in the above package, we will build a functional model of the planning system in TO-BE format. Let us present the work on the formation of the planning system at the enterprise KTM «KTM» and its relationship with the external environment graphically in the context diagram of the corresponding model, which is depicted in Figure 1. The input information to be studied and processed in the planning system consists of information flows that distributed in certain sectoral directions: political, economic, social, scientific and technological, environmental, legal factors. All these factors deliver information that is relevant to each area of operation, which can be displayed both in a descriptive and more specific form — various metrics, formulas, schemes and more.
External managerial influences on the planning system (they are not transformed in the process of its formation) should be characterized by external decisions of the consortium on modernization and management of production and supply of thermal energy.
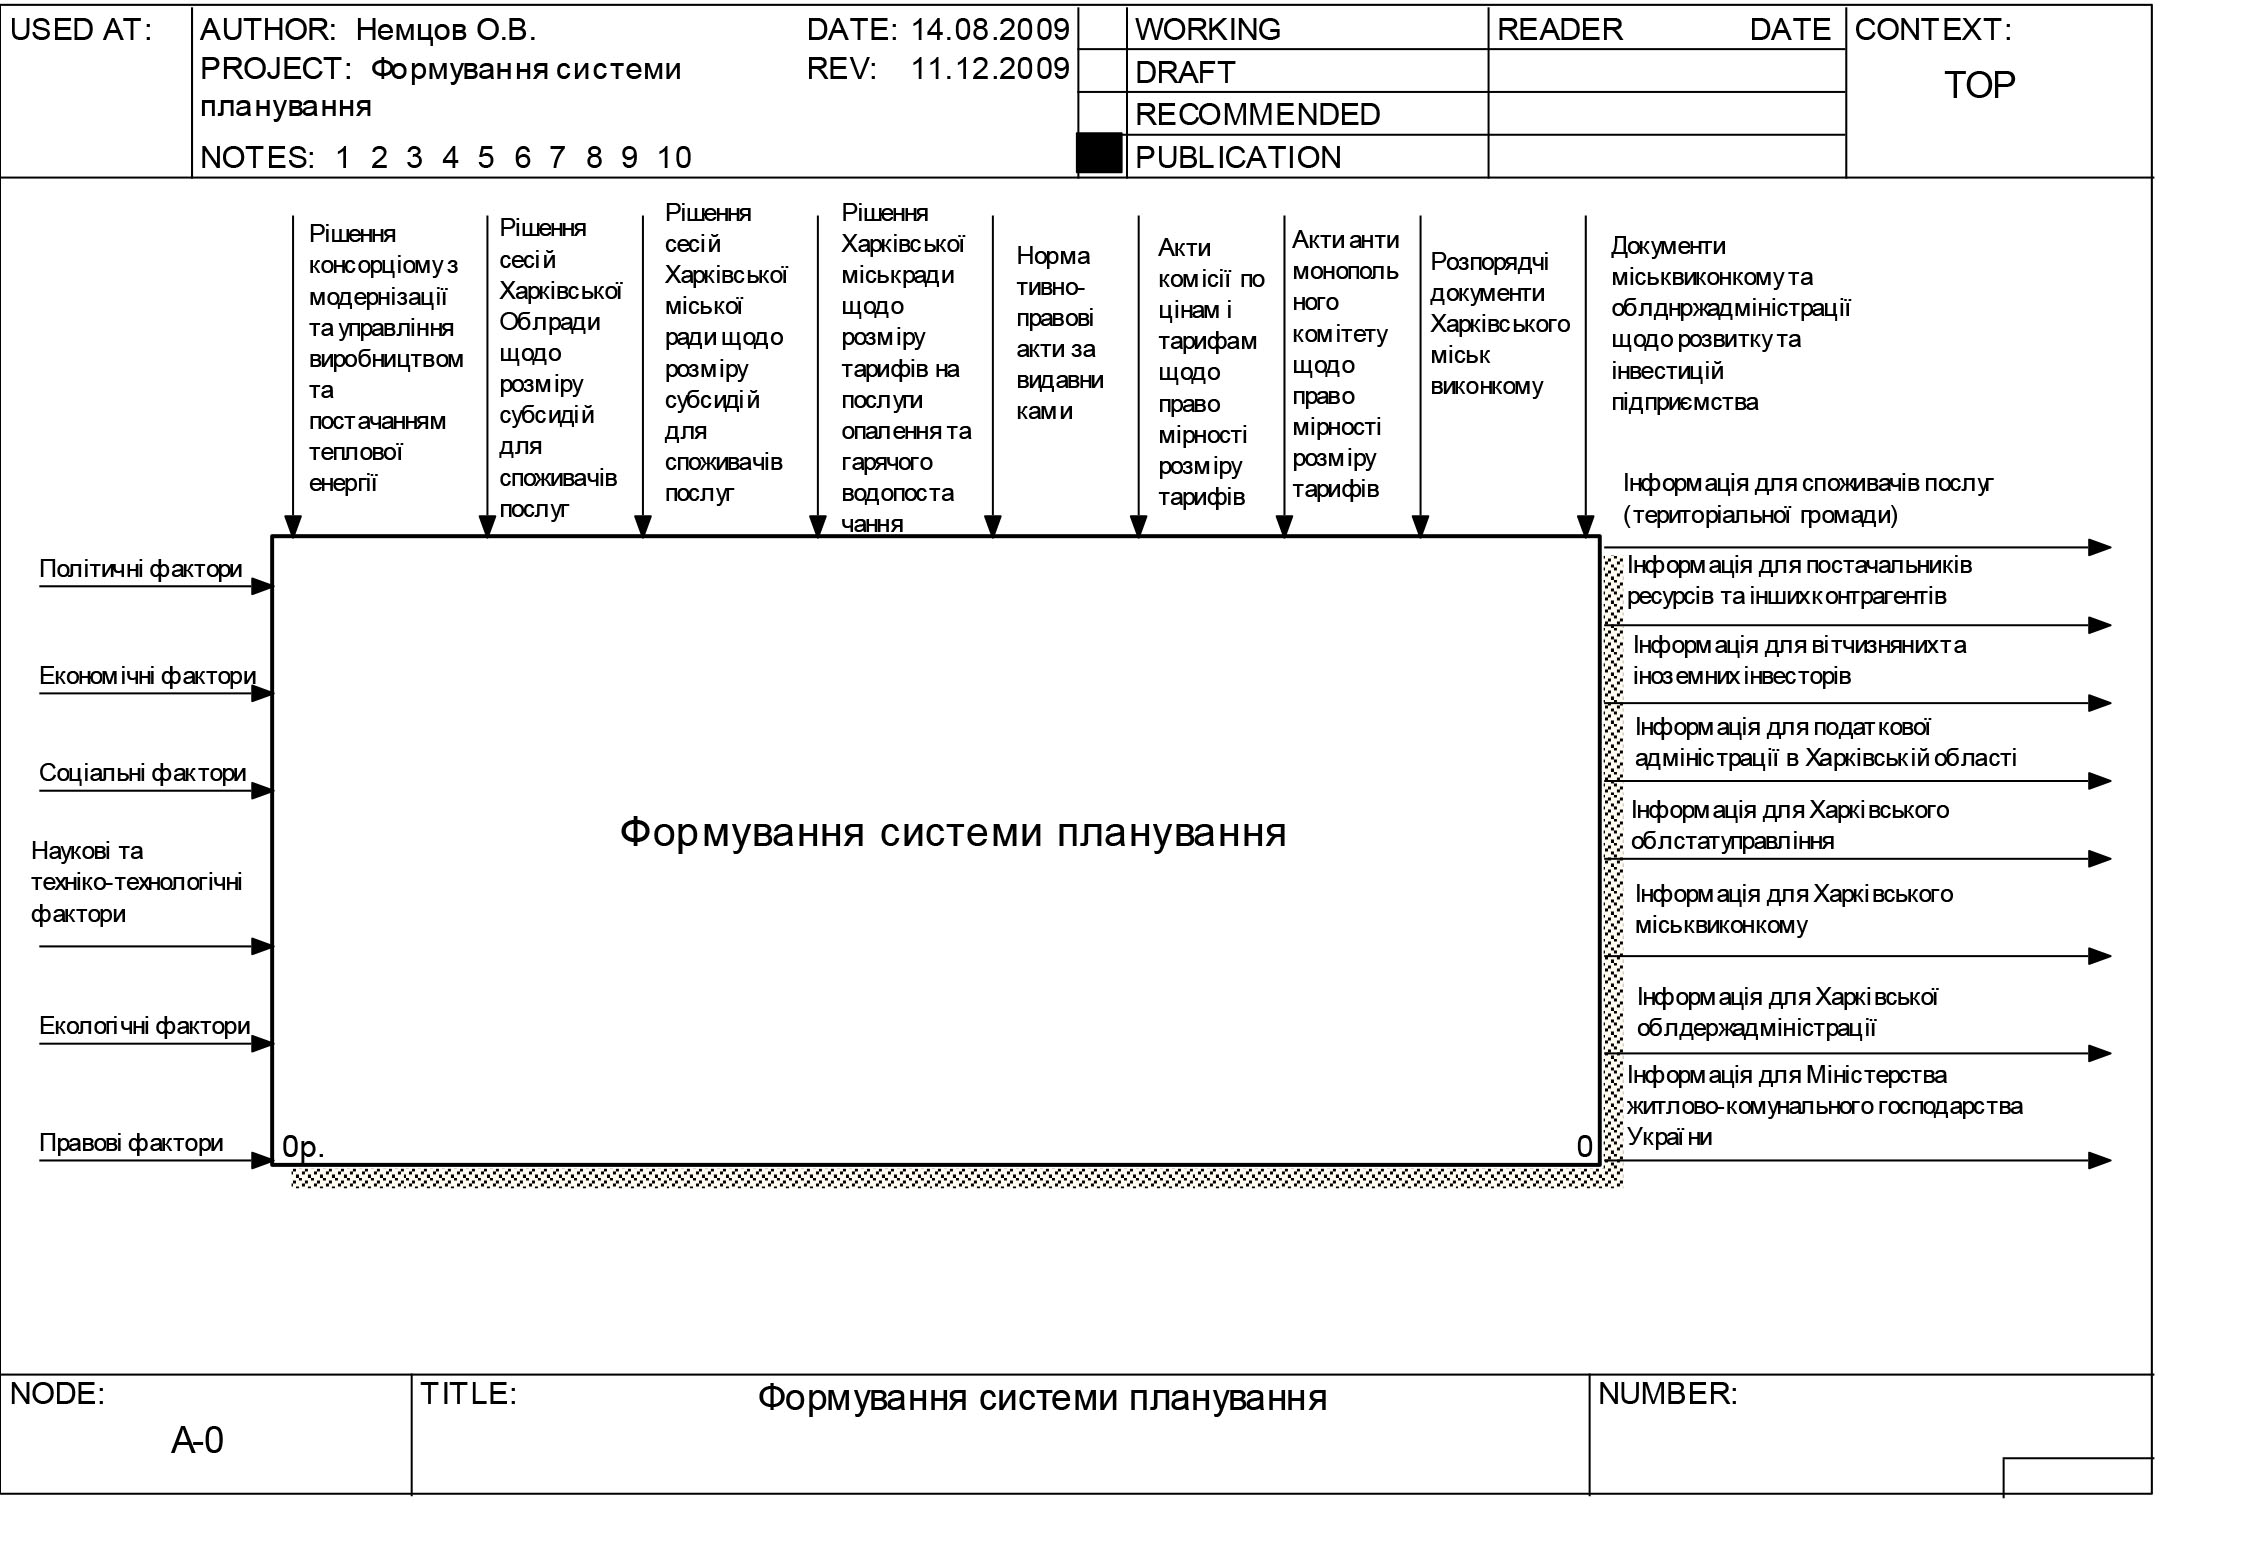
Figure 1 Context diagram of the model of planning system formation at KTM enterprise
In order to improve the work of KPM KTM enterprise, in particular, the efficiency of the planning process on it, as well as for greater transparency and publicity of its activity, we propose to create on the basis of this enterprise or of all utility companies a consortium that will coordinate the activities of modernization and management of municipal services in the city, in particular in our case — the production and supply of heat.
The output generated by the enterprise planning process is a collection of information flows distributed to external users. In connection with the changes that we intend to introduce into the organizational and economic form of the enterprise, as well as based on the mood and expectations of society and the desire of governmental structures to create transparent business, including state and municipal, based on publicity and impartiality, such two outbound external information flows that would inform service consumers as well as resource providers and other counterparties of the enterprise.
We propose to provide these information flows through the creation of enterprise web sites on the Internetand placing on them statistical reports of the enterprise, the charter of the enterprise, information on the size of tariffs for heat supply services and other additional services, normative legal acts that regulate the activity of the enterprise, conditions for connection to district heating or hot water supply networks, strategic plans of the enterprise and the program of its modernization and reconstruction, results of scientific and technological research in the fields of economic activity of the enterprise, forms of contracts and other documents (statements , claims, acts, etc.) through which the company communicates with its customers and suppliers, news and press releases of the enterprise.
The mechanism for providing other external information flows is also proposed to be implemented through the electronic Internet networkwhich significantly accelerated and simplified the internal and external workflow. Such confidential workflow can be done through special sections of the aforementioned Web sites, which would be encoded by third parties, and each regulated user would receive information belonging to him, knowing the appropriate code. The mechanism by which work is performed on the formation of the planning system at the enterprise KP «HTM» is formed in the system itself, so it is not displayed from the outside.
Having defined the external interconnections of the planning system, let us examine its internal structure, which can be graphically represented through the decomposition diagram of the formation of the planning system (Fig. 2).
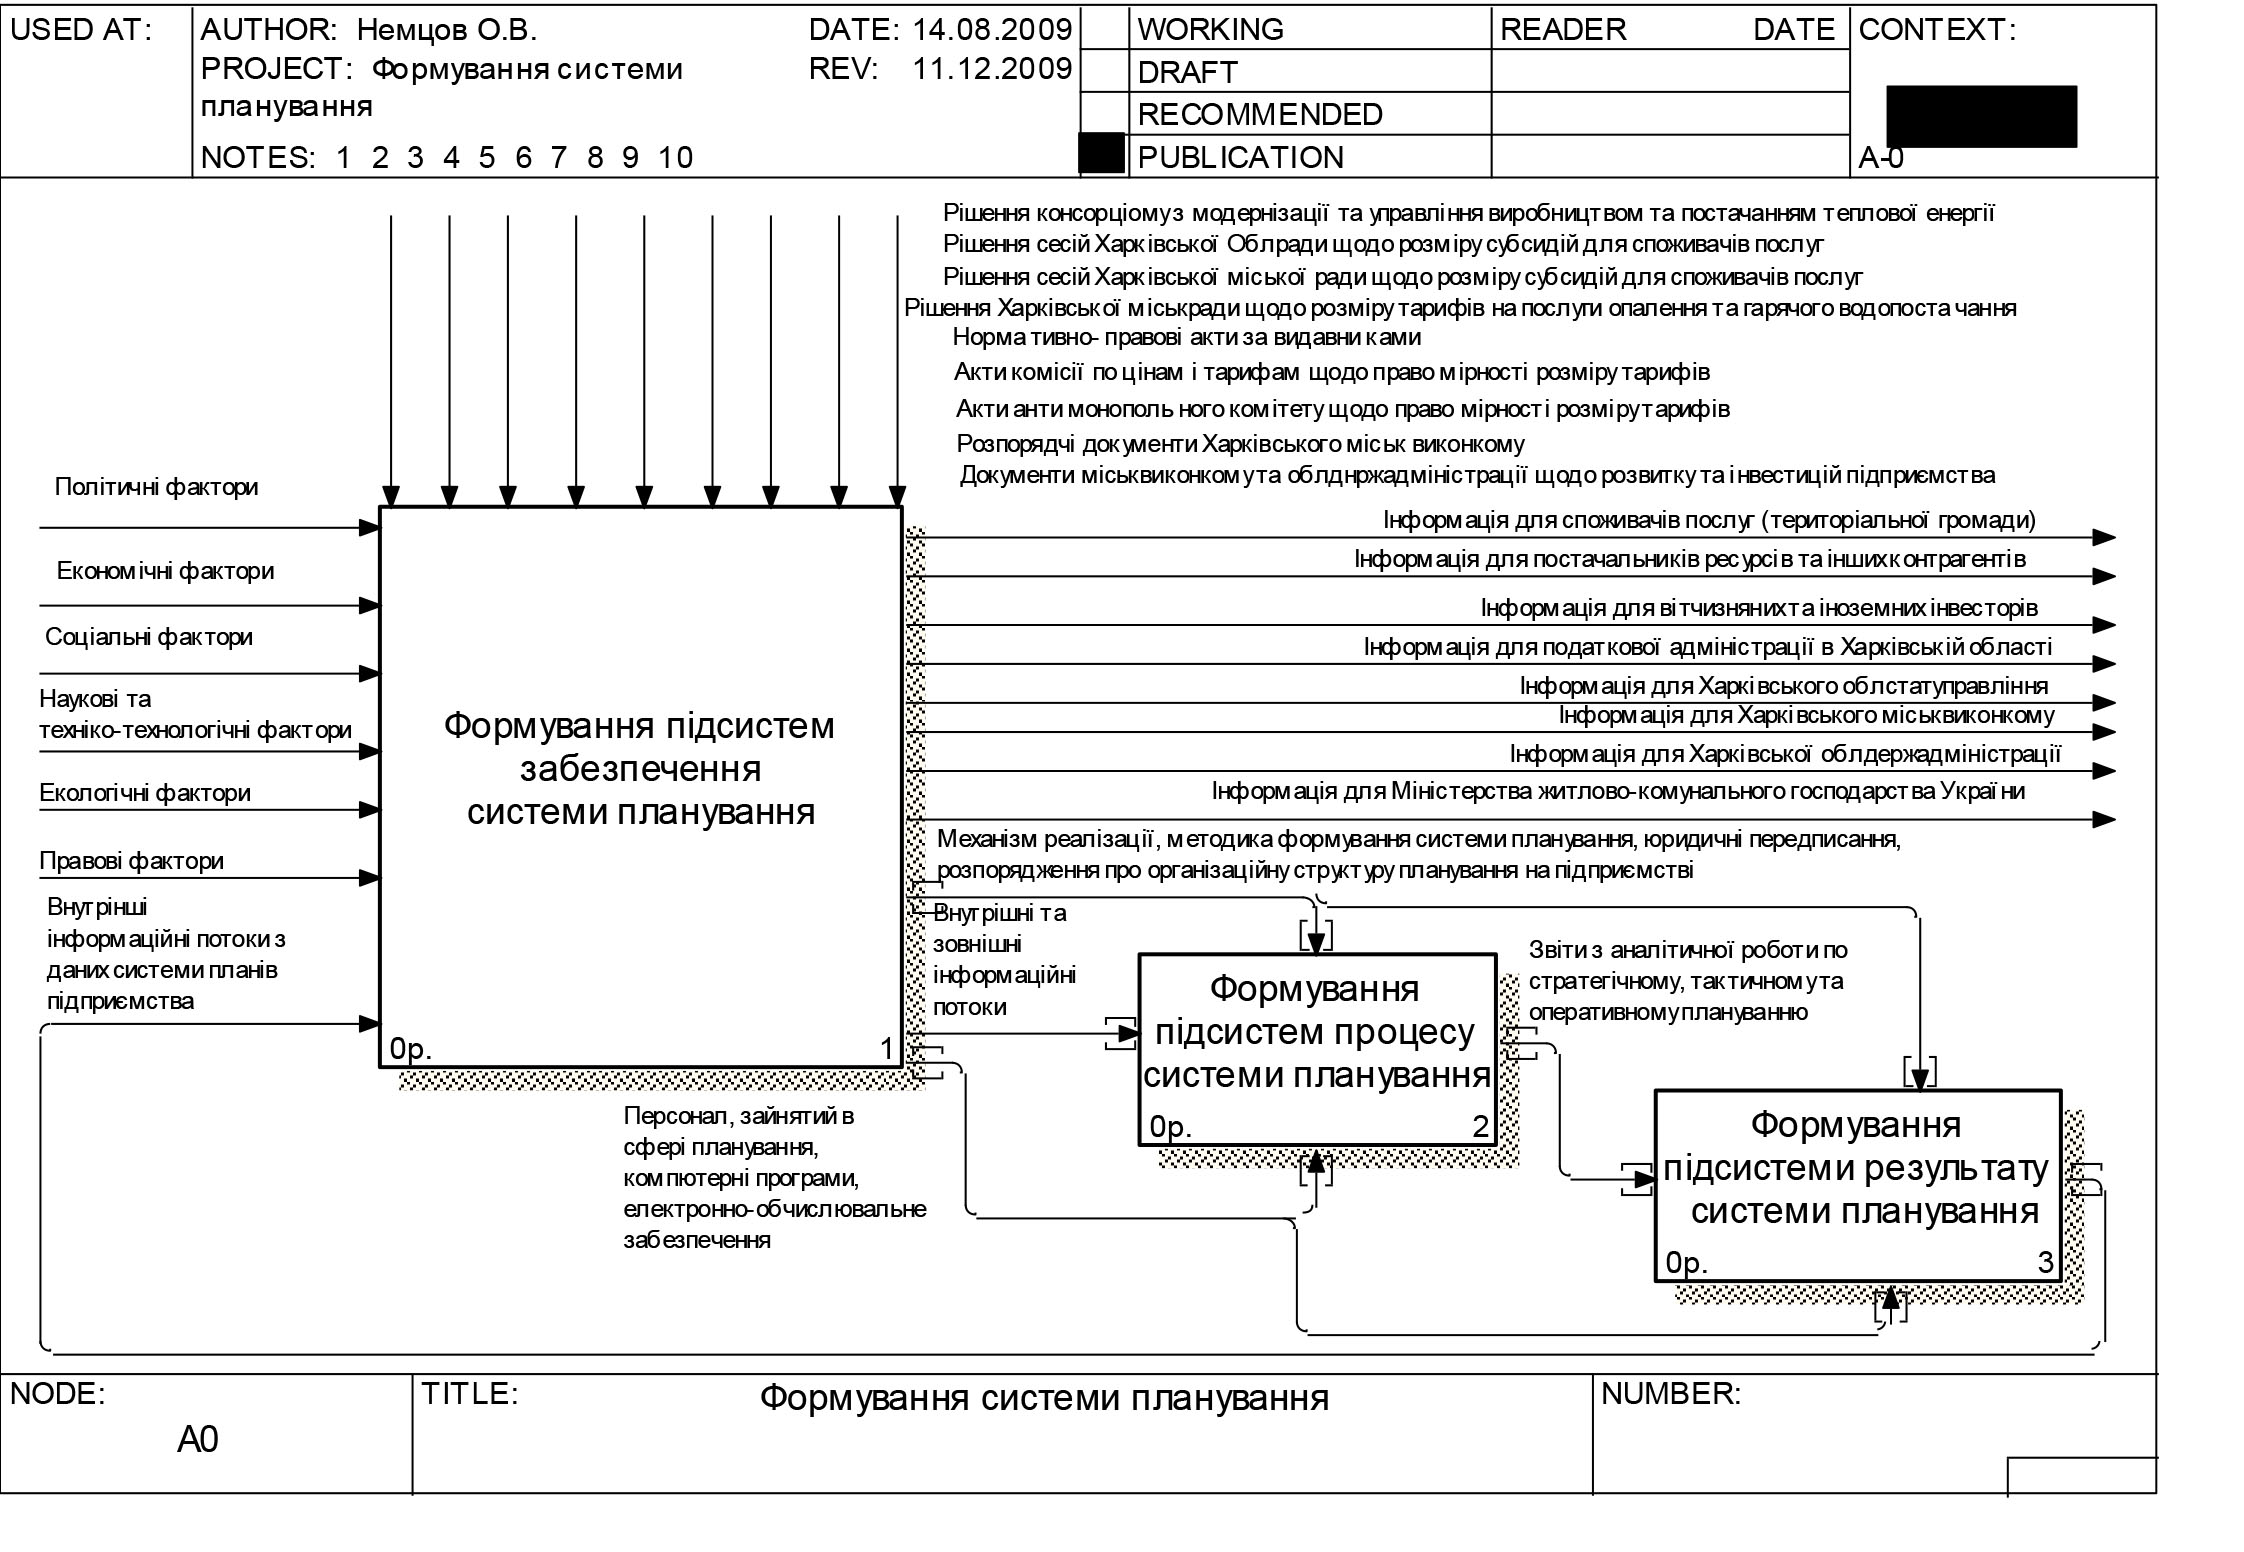
Figure 2 Decomposition diagram of the context diagram of the planning system formation at KTM enterprise The
structure of work on the planning system formation was constructed in accordance with the requirements of the system and process approaches, which allows not only to study the structure but also to understand the process of its formation. Under the subsystems of providing the system of planning (system input) we mean its various provision with the necessary resources: methodological, methodological, informational, personnel organizational, etc. Process subsystems (system converter) are interpreted by us as the process of converting inputs to a result or product of a system, which in our case is a strategic, tactical and operational planning. Outcome subsystem
is actually the result or product of a system ( system output ) that is a system of integrated and agreed plans .
Through the formation of the subsystems providing the planning system, communication with the external environment, as well as the mechanism by which the construction of subsystems of the process and subsystems of the result of the planning system. As a result of the work on the formation of the subsystems of security, managerial influences are also expressed, which are expressed in the mechanism of implementation and methodology of formation of the planning system, legal prescriptions, orders on the organizational structure of planning at the enterprise, which are controlled by the subsystems of process and result. Through subsystems of supply to the subsystems of the process flows information flows, which, firstly, come from the external environment, and, secondly, are formed in the middle of the subsystems of the supply and as a result of the data of the plan system (result subsystem).
By its structure, the work on the formation of the subsystems of the provision of the planning system consists of the works on the formation of the implementation mechanism, methodology, information support and IT technologies, human resources and other infrastructure support.
In the process of forming the mechanism of implementation, work is underway to identify the laws, principles and methodology of the planning system. According to their assertions and regulations, all other components of the supply and process and result subsystems are formed and function. Laws, principles and methodology are interconnected by systemic and cause-and-effect relationships.
Based on the developed mechanism of implementation, the formation of the methodology of the planning system begins, which begins with the analysis of the existing methodological support for planning, then — monitoring of the methodological support, which is generally known today in all industries and all countries, and finally — the reconciliation of the results obtained in the two previous stages, as a result of which methodological recommendations in the field of planning are formed.
The methodological recommendations in the field of planning and the mechanism of implementation regulate the order of implementation of work on the formation of information support and IT technologies. The information subsystem is central to others because it is through it that all information flows that flow into all other subsystems and their components. In this way, this subsystem performs the following basic functions: it is a clipboard and a huge data bank where all the information that is stored in the enterprise is stored, archived and organized.
The subsystem of other infrastructure provision is formed in accordance with the requirements set forth by the provisions of the implementation mechanism and methodological recommendations in the field of planning, exchanging information with a single enterprise information system. In this subsystem, ancillary support to the planning system is formed, but without which synergies and logical completeness cannot be achieved.
In the context of infrastructure provision, it is very important to form an organizational support for the planning system, since it defines the planning style used in the enterprise and its units, regulates the functional and informational links between them, establishes their rights, responsibilities and responsibilities. In our view, it is advisable to identify cost and revenue responsibility centers in the context of which enterprise planning would be carried out. These centers include, first, structural units of the enterprise, to which we include branches, boiler and heat power plants, functional departments and services of the enterprise. Secondly, the responsibility centers include business processes occurring at the enterprise, the main ones being heat supply for heating and hot water supply. Third, the centers of responsibility can be called functional areas of activity of the enterprise: marketing, marketing, production, financial, etc. Thus, planning in structural units can be carried out in a decentralized manner, business process planning — centralized, while planning functional areas would be a reconciling option between plans, regulated administration and plans put forward by middle management, whereby changes in business process plans were made. and plans of subdivisions of the enterprise. The organizational support is coordinated with the organizational structure of the personnel of the planning system through a single information system. structural unit planning can be decentralized, business process planning centralized, and functional area planning would be a co-ordinated option between plans regulated by the administration and plans put forward by middle management, whereby changes to business process plans and unit plans were made. enterprises. The organizational support is coordinated with the organizational structure of the personnel of the planning system through a single information system. structural unit planning can be decentralized, business process planning centralized, and functional area planning would be a co-ordinated option between plans regulated by the administration and plans put forward by middle management, whereby changes to business process plans and unit plans were made. enterprises. The organizational support is coordinated with the organizational structure of the personnel of the planning system through a single information system. accordingly, changes were made to the business process plans and enterprise subdivision plans. The organizational support is coordinated with the organizational structure of the personnel of the planning system through a single information system. accordingly, changes were made to the business process plans and enterprise subdivision plans. The organizational support is coordinated with the organizational structure of the personnel of the planning system through a single information system.
The personnel subsystem is built in accordance with the defined mechanism of implementation and according to the developed methodological recommendations, exchanging information with other subsystems and their components in a single information system, taking into account legal prescriptions, results of scientific researches and the order of organization of planning system at the enterprise.
When forming subsystems of the process according to the defined mechanism of implementation and methodological recommendations, legal prescriptions, orders on the organizational structure, the personnel involved in the field of planning, through computer and electronic-computing software, process the received external and internal information, resulting in the formation of certain alternative documents in strategic, tactical and operational planning.
The enterprise planning process consists of a strategic, tactical and operational level according to which process subsystems are formed. It is accepted and, if possible, even desirable to begin the planning process from the strategic level, but in reality, the planning process takes place simultaneously at all levels, since these processes are tightly interconnected and cannot be separated from one another. Thus, in the process of strategic planning goals, objectives and measures for their achievement are formed, perspective-oriented, the appearance of something new in the structure and functioning of the enterprise, which in the long run will give him competitive advantages. In the process of operational planning, there is daily support for the financial and economic activity of the enterprise, which is reflected in various balances, which are aimed at ensuring a continuous and sustainable operation. The tactical planning process is intended to balance the resource requirements for development and support of the enterprise in real time in the near future.
The planning documents and other information data developed in the subsystems of the process enter the subsystem of the result of the planning system — the system of plans. In this subsystem, according to the defined implementation mechanism and methodological recommendations, legal prescriptions, organizational structure orders, the personnel involved in the planning sphere, through computer and electronic computing, forms the final plans, which are prescriptive. The plans are formed in accordance with the centers of responsibility of the revenues and expenses defined in the organizationally provided planning system.
Such organization of plans at the enterprise allows to realize their target orientation, to fully cover the subject and object of planning, to clearly structure plans, to carry out the integration of goals, objectives and indicators of plans in space and time, to achieve the necessary degree of their transformability, to carry out comprehensive monitoring and control targeted spending and revenue generation, all of which will increase the efficiency of the enterprise.
Conclusions.The constructed model of the planning system of KP «KTM» allows not only to determine the composition of elements and the logic of their relationships, but also to study the process of their formation and functioning. This functional model of the planning system when integrating it with the enterprise databases creates the basis for the creation of an integrated automated control system at the enterprise. Another significant advantage is the ability to present a functional KTM KPM model built in AllFusion Process Modeler 7.1 as an imitation model in Arena BE 10.0. This will allow you to get the experimental results you can expect from the real world its introduction at the enterprise.
literature
1. I. Ansoff. Strategic management. M .: Economics, 1989 .— 520 p.
2. R. Akoff. Planning for the future of a corporation. M .: Progress, 1985 .— 328 s.
3. Khan D. Planning and control: the concept of controlling / Per with him: ed. and with the foreword. Turchak A.A., Golovach L.G., Lukashevich M.L. — M.: Finance and statistics. — 1997. — 800 c .
4. Bad EB Alignment of strategic and operational planning. // Management of the development . 2002. No. 1 . — P. 80 — 84.
5. Adaptive models in decision-making systems: Monograph / A28 Ed. ON THE. Kizima, T.S. Klebanova. — X .: Publishing House «ENGEC», 2007. — 368 p. Russian
6. Maklakov S.V. With Creating information systems to the AllFusion Modeling Suite . — 2nd ed., Rev. and add. — M .: Publishing house Dialog-MEPhI, 2007 — 400 p.
7. E.V. Minko, A.E. Minko. Theory of the organization of production systems: Textbook. allowance. — M .: CJSC «Publishing House» Economics «», 2007. — 493 p.
8. The study of control systems: a training manual / E.V. Freidin; under the editorship of Yu.V. Gusev. — Moscow: Omega-L, 2008. — 367 p.
9. Belyaev A.A., Korotkov E.M. Organization systemology. M .: INFRA-M, 2000.
PROBLEMS OF FORMATION OF METHODICAL APPROACH TO ESTIMATION OF EFFICIENCY OF ENTERPRISE PLANNING SYSTEM
published in 2011 — H .: NTU «KPI» — 2011 — S. 99 — 121, © Nemtsov O.V.
Annotation. In the state, we’ve grounded the systematic approach for appraising effective system planning. This systematic approach is based on the system’s exponents of effective, which is elaborating . Formulation of the problem in general.
The efficiency of the system has always been determined from the point of view of achieving its goals, which had the form of achieving certain quantitative or qualitative characteristics, the movement of the system along the previously specified trajectory and so on. Similarly, the properties of the system were considered, depending on its ability to move in a predetermined way or to meet predefined qualitative or quantitative criteria. Since the planning system is part of the management system and cannot be characterized by the actual results achieved by the enterprise, the question arises as to how one can determine the level of effectiveness of this first stage of the management process — planning, and accordingly the effectiveness of the planning system itself.
Analysis of recent research and publications.Scientists such as P.A. were engaged in studying the efficiency, effectiveness of the system and the effectiveness of the management system. Samuelson, V.D. Nordhouse, L. von Bertalanffy, N.I. Bukharin, OO Bogdanov, V.V. Yushmanov, A.V. Ignatieva, N.M. Maksimtsev, M. Markov, I.A. Markina, M. Maroshi, N.P. Buslenko, V.V. Kalashnikov, I.N. Kovalenko, OB Bad, T.Yu. Ivanova, S.G. Tyaglov, VI Prikhodko, MO Chernyshev.
The purpose and purpose of the article. Develop a system of performance indicators for the planning system and on that basis create a methodological approach to assessing its level of effectiveness.
Outline of the main research material.The planning system, as we noted in the first section, is a subsystem of the management system and only partially possesses the characteristics that the management system has. That is, such stages of the management process, such as the implementation of the planned actions, their control and analysis, go beyond the planning boundaries, and accordingly the results of the activity of the entity, caused by the implementation of the entire management process, can not reflect the effectiveness of the planning. The planning process at the enterprise, and accordingly the functioning of the planning system, can be set at a high level and the execution level — at a low level, that is, simply put, the plans developed at the enterprise may not be applied in the further management process. This all leads to the isolation of additional characteristics and the corresponding performance indicators of the planning system.
These characteristics can be called system properties, since both the structure and the relationships between the elements and other system parameters should be formed as far as possible according to the best criteria of these properties. By the way, proper efficiency is also one of the properties of a system that integrates all other properties. Other features of the system include balance, stability, adaptability, flexibility, reliability, viability and safety [8, 9, 10]. The best criteria for these properties are the quantitative expression of the indicators by which they measure these properties, which allows to achieve the main goal to the greatest extent due to the achievement of the more local tasks facing the system. Therefore, we present the main purpose, objectives and related indicators in Figure 1.
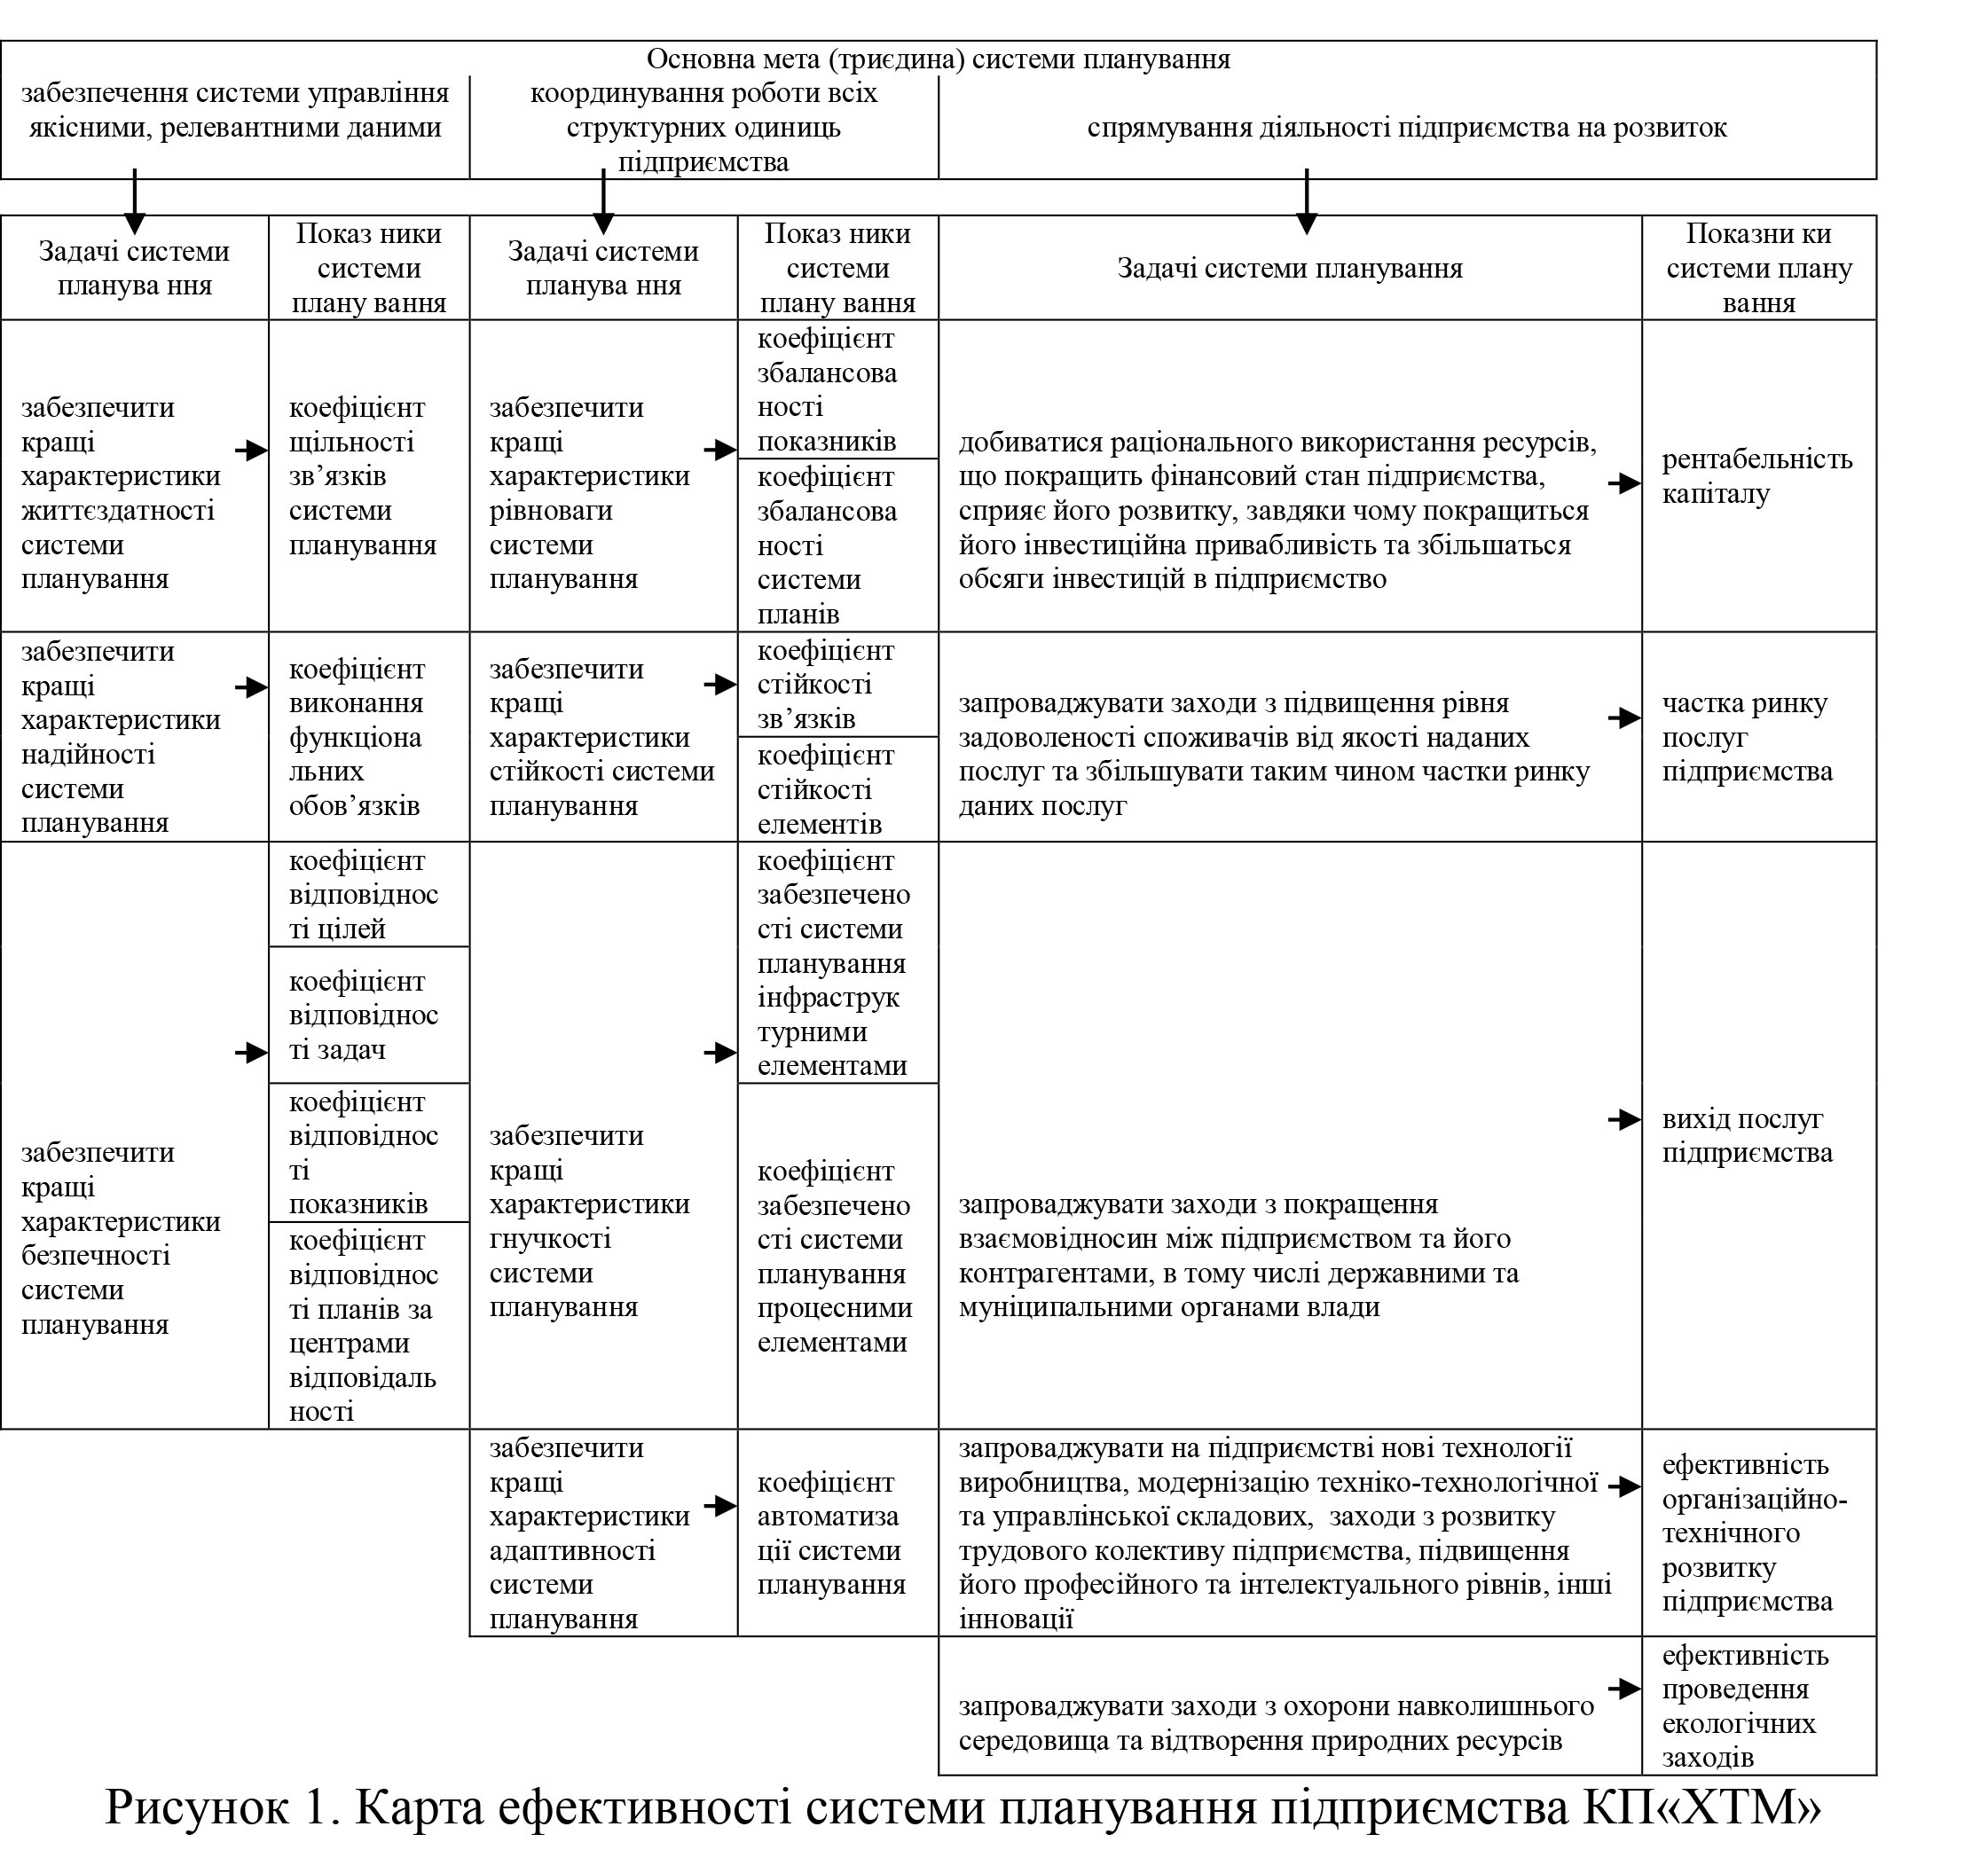
It should be noted that the procedure for the formation of performance indicators that reflect the system’s properties and meet certain objectives for coordinating activities and providing data, justification of their best criteria will be presented below after clarifying the basic requirements for their formation. In order to do this, it is necessary to determine the nature of each of the properties in accordance with our system of planning.
The formulas and procedure for calculating indirect indicators of the effectiveness of the planning system, ie those that reflect the result of the entire activity of the enterprise and meet the task of development, as well as justification of their best criteria will be given below.
It should also be emphasized that all indicators (direct and indirect) put forward by us for the planning system evaluation procedure are inherently qualitative, since they are intended to measure the quality of the planning system and, accordingly, to the selection of these indicators and to substantiate their quantitative characteristics, the methodology used in evaluating the quality of goods or services, in other words the methodology of qualimetry, may be applied. This means that the basic principles and methods used in the process of measuring the quality of a particular object or object, combined with the requirements for system evaluation, can be the basis for our methodical approach to assessing the effectiveness of the planning system.
Thus, based on the theoretical knowledge in the field, our logical conclusions and assumptions accordingly, based on their own practical experience and intuition, the author will offer as an expert his own view of the nomenclature of indicators, their quantitative evaluation, better characteristics and others. gradations, as well as the relationships between these metrics. In the future, our statements will be sent to other experts in the relevant field of knowledge, and after receiving our responses from these experts, a final decision will be made about the validity and the possibility of applying the ideas put forward to formulate a nomenclature of indicators of the effectiveness of the planning system, their quantitative evaluation and the relationship between these indicators.
Before proposing and justifying the indicators and their quantitative gradations, we note the following basic tenets:
1) Direct performance characteristics of the system will not always be used to measure performance indicators, but also indirect characteristics — where it is impossible to display direct, difficult or impractical (according to the thesis in source 8).
2) Grading metrics will be effective, moderately effective, ineffective, and ineffective, the logic behind which is that they are consistent with generally accepted quality estimates accepted in our space as excellent, good, satisfactory, and unsatisfactory for anything (source 11, 12 ).
3) Interval estimates (source 13) will be used to determine the best performance of the indicators (effective), with the difference between the lower and higher limits of such an interval set at 20% of the optimum point (source 11, 14).
4) Interval estimates will also be used to determine other gradations of indicators (moderately effective, ineffective, and poorly performing), based on the deviation of quantitative values from the above-mentioned better characteristics of indicators:
— if the value of the indicator differs from the better characteristic by <0% — ≥20 % — this indicator meets the criterion — moderately effective;
— if the value of the indicator differs from the better characteristic by <20% — ≥40% — such indicator meets the criterion — ineffective;
— if the value of the indicator differs from the better characteristic by more than <40% — this indicator meets the criterion ineffective.
5) 20% (error) were taken as a step within the confidence interval, as a margin factor, between the upper and lower point of such interval, which corresponds to the quantitative interval estimates of the gradations we have identified (source 11, 14).
6) If a corridor of optimal values is established for the performance indicators, then the difference in the aforementioned percentage is calculated from both the upper and lower bounds of such corridor.
7) The nomenclature of indicators, their quantitative characteristics according to certain gradations and the relationship between these indicators were confirmed by the expert survey.
We investigate indirect performance indicators for their formulation and better interval characteristics.
The return on capital is expressed by the following formula:
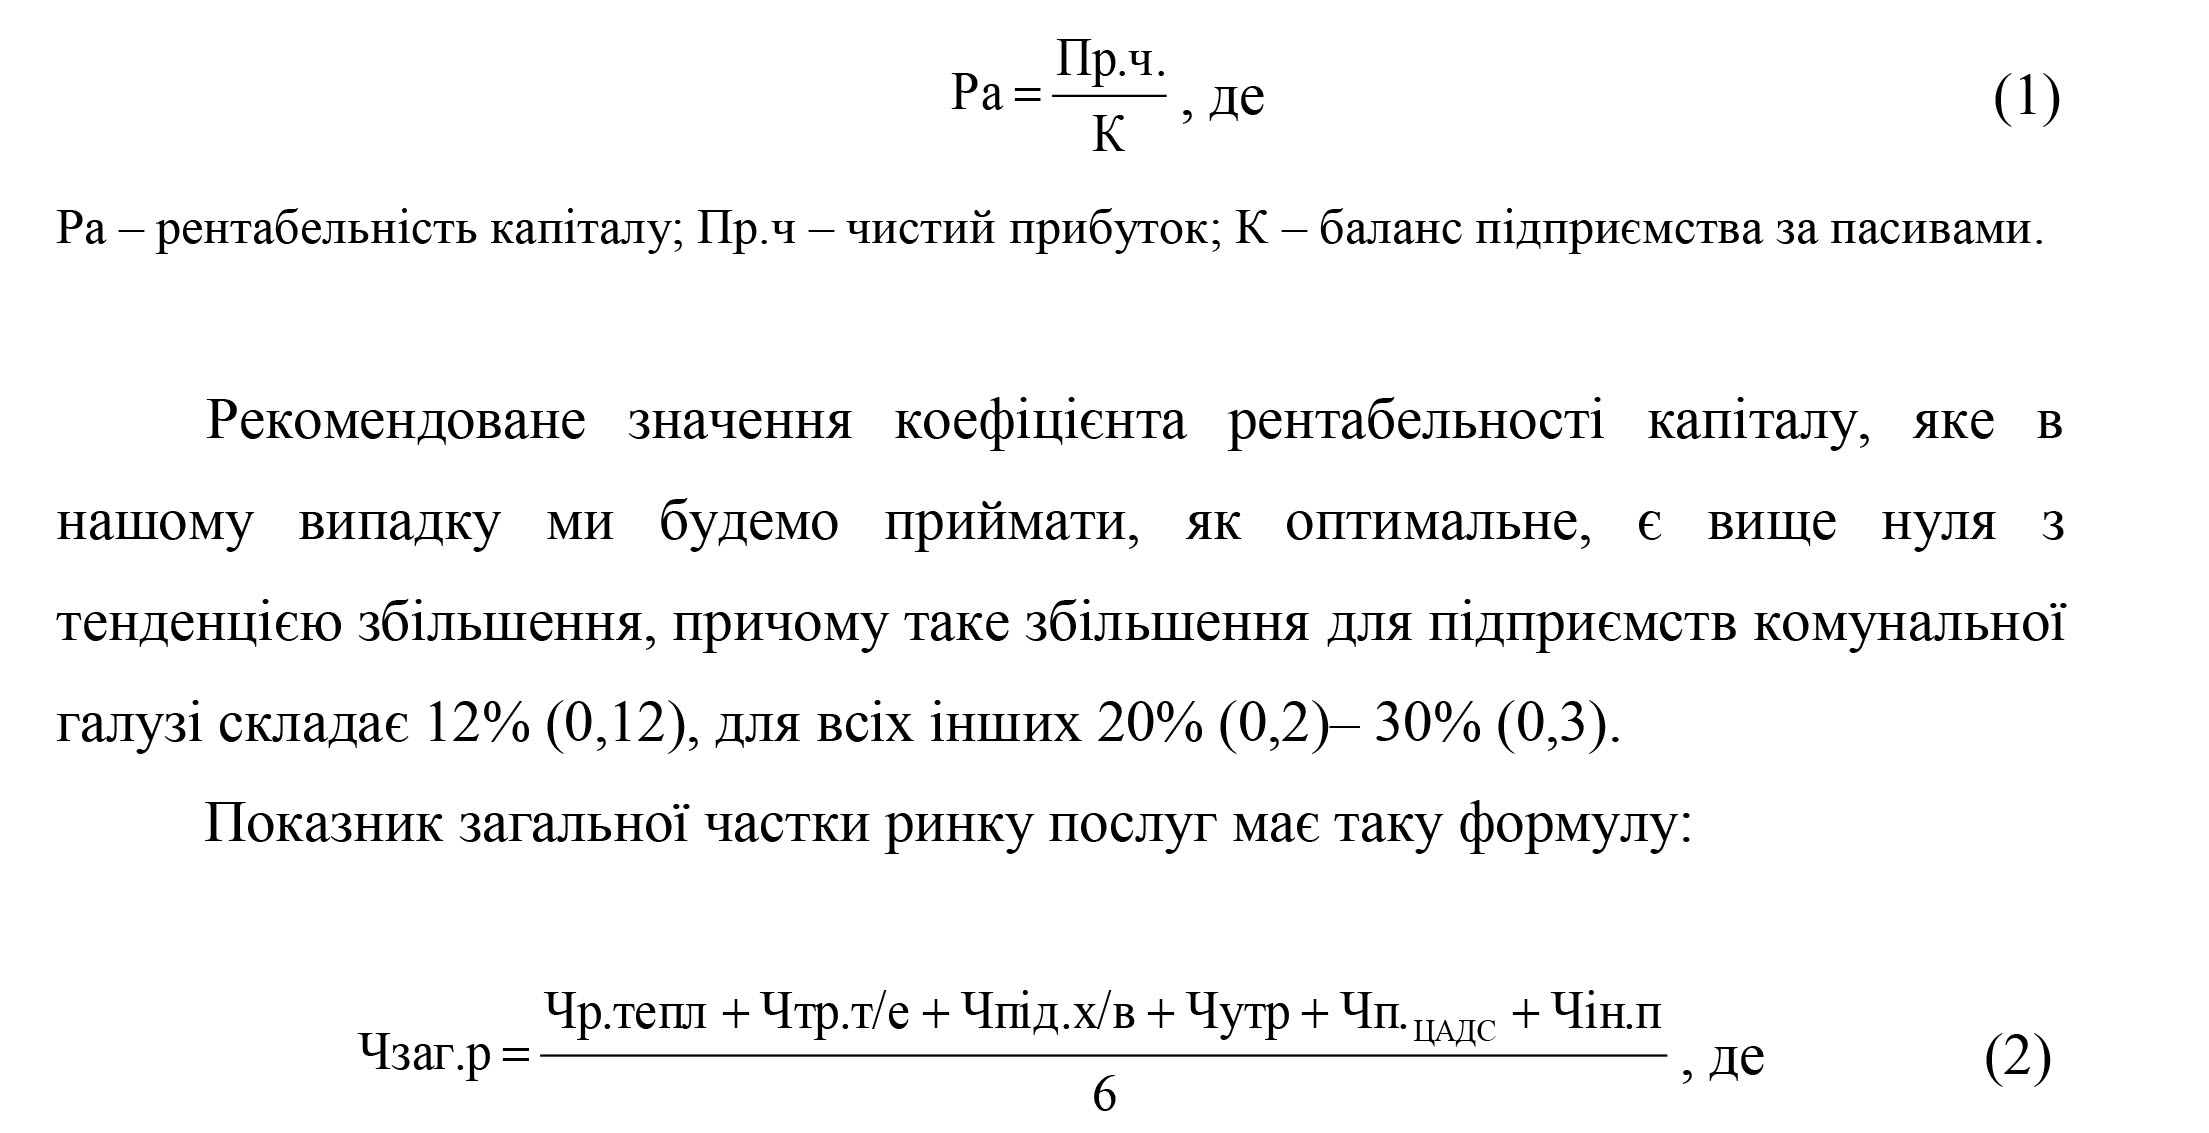
Zzag.r — total market share of services provided by the enterprise; Chr.tepl — share of the market of heat supply of the enterprise; Ctr.t / e — market share of heat energy transportation service; Chip.h / in — market share of cold water pumping service; Chutr — the market share of the service of maintenance of domestic home networks; FAQ CACS — the market share of emergency services. heat. networks; Chin.p — market times of other services provided by the company.
With regard to the indicator of the overall market share of services, it can be determined that the value of this indicator, the most appropriate criterion effective, is taken as the maximum possible value in the range 0 — 1, limited by the requirements of antitrust law, which provides that the share of one enterprise should not exceed 35% of the market of the given product or service. Based on this, and taking into account the 20% margin of error (error) of 35%, the best value of the interval of the total share of the service market is in the range 0.28 — 0.35. However, since KTM KTM, which we are investigating, refers to natural monopolies, and accordingly does not fall under the antitrust laws in the objection to exceed 35% of the market for services provided, we will consider the ratio of the total market share of services as such,

Exit rate services is interpreted as follows:
Pvyh.p. — service output indicator; DRt / e — income from the sale of thermal energy; Wt / e — costs from the sale of thermal energy; Dt.t / e — income from transportation of thermal energy; Vt.t / e — costs of transportation of thermal energy; DPh / in — income from cold water pumping; HP / h — costs of pumping cold water; Db.tr — income from the maintenance of internal house networks; Vrb.utr — costs of maintenance of internal house networks; Dvyk TSADS — income from performing emergency work; Vvyk TSADS — the cost to perform emergency work; Dean — income from other activities; It is the cost of other activities.
The indicator of output of services is intended to show the ratio of material costs with the volume of services to which these material costs were involved, and in our case, also the ratio of these material costs in value equivalent with the income from the provision of these services. In essence, it is a cost structure in the enterprise’s income, which consists of the full cost and value of profit. On this basis, we have to answer the question, what should be the ratio of costs to total costs? World practice and science show that in the cost structure, material costs should account for no more than 20% — 30% for conventional enterprises and 45% — 60% for resource-intensive enterprises in which the technological cycle is caused by such consumption (including for some utilities areas — natural monopolies, including heat supply companies). Hence, in the structure of total income, considering the amount of profit (limited by the legislation in the municipal sphere 12% of total cost) — no more than 39.6% — 52.8%. Thus, the best value of the interval of the output of services will be when the enterprise’s income will be 1.89 — 2.5 more than the material costs, with an upward trend.
The indicator of the effectiveness of organizational and technical measures has the formula:
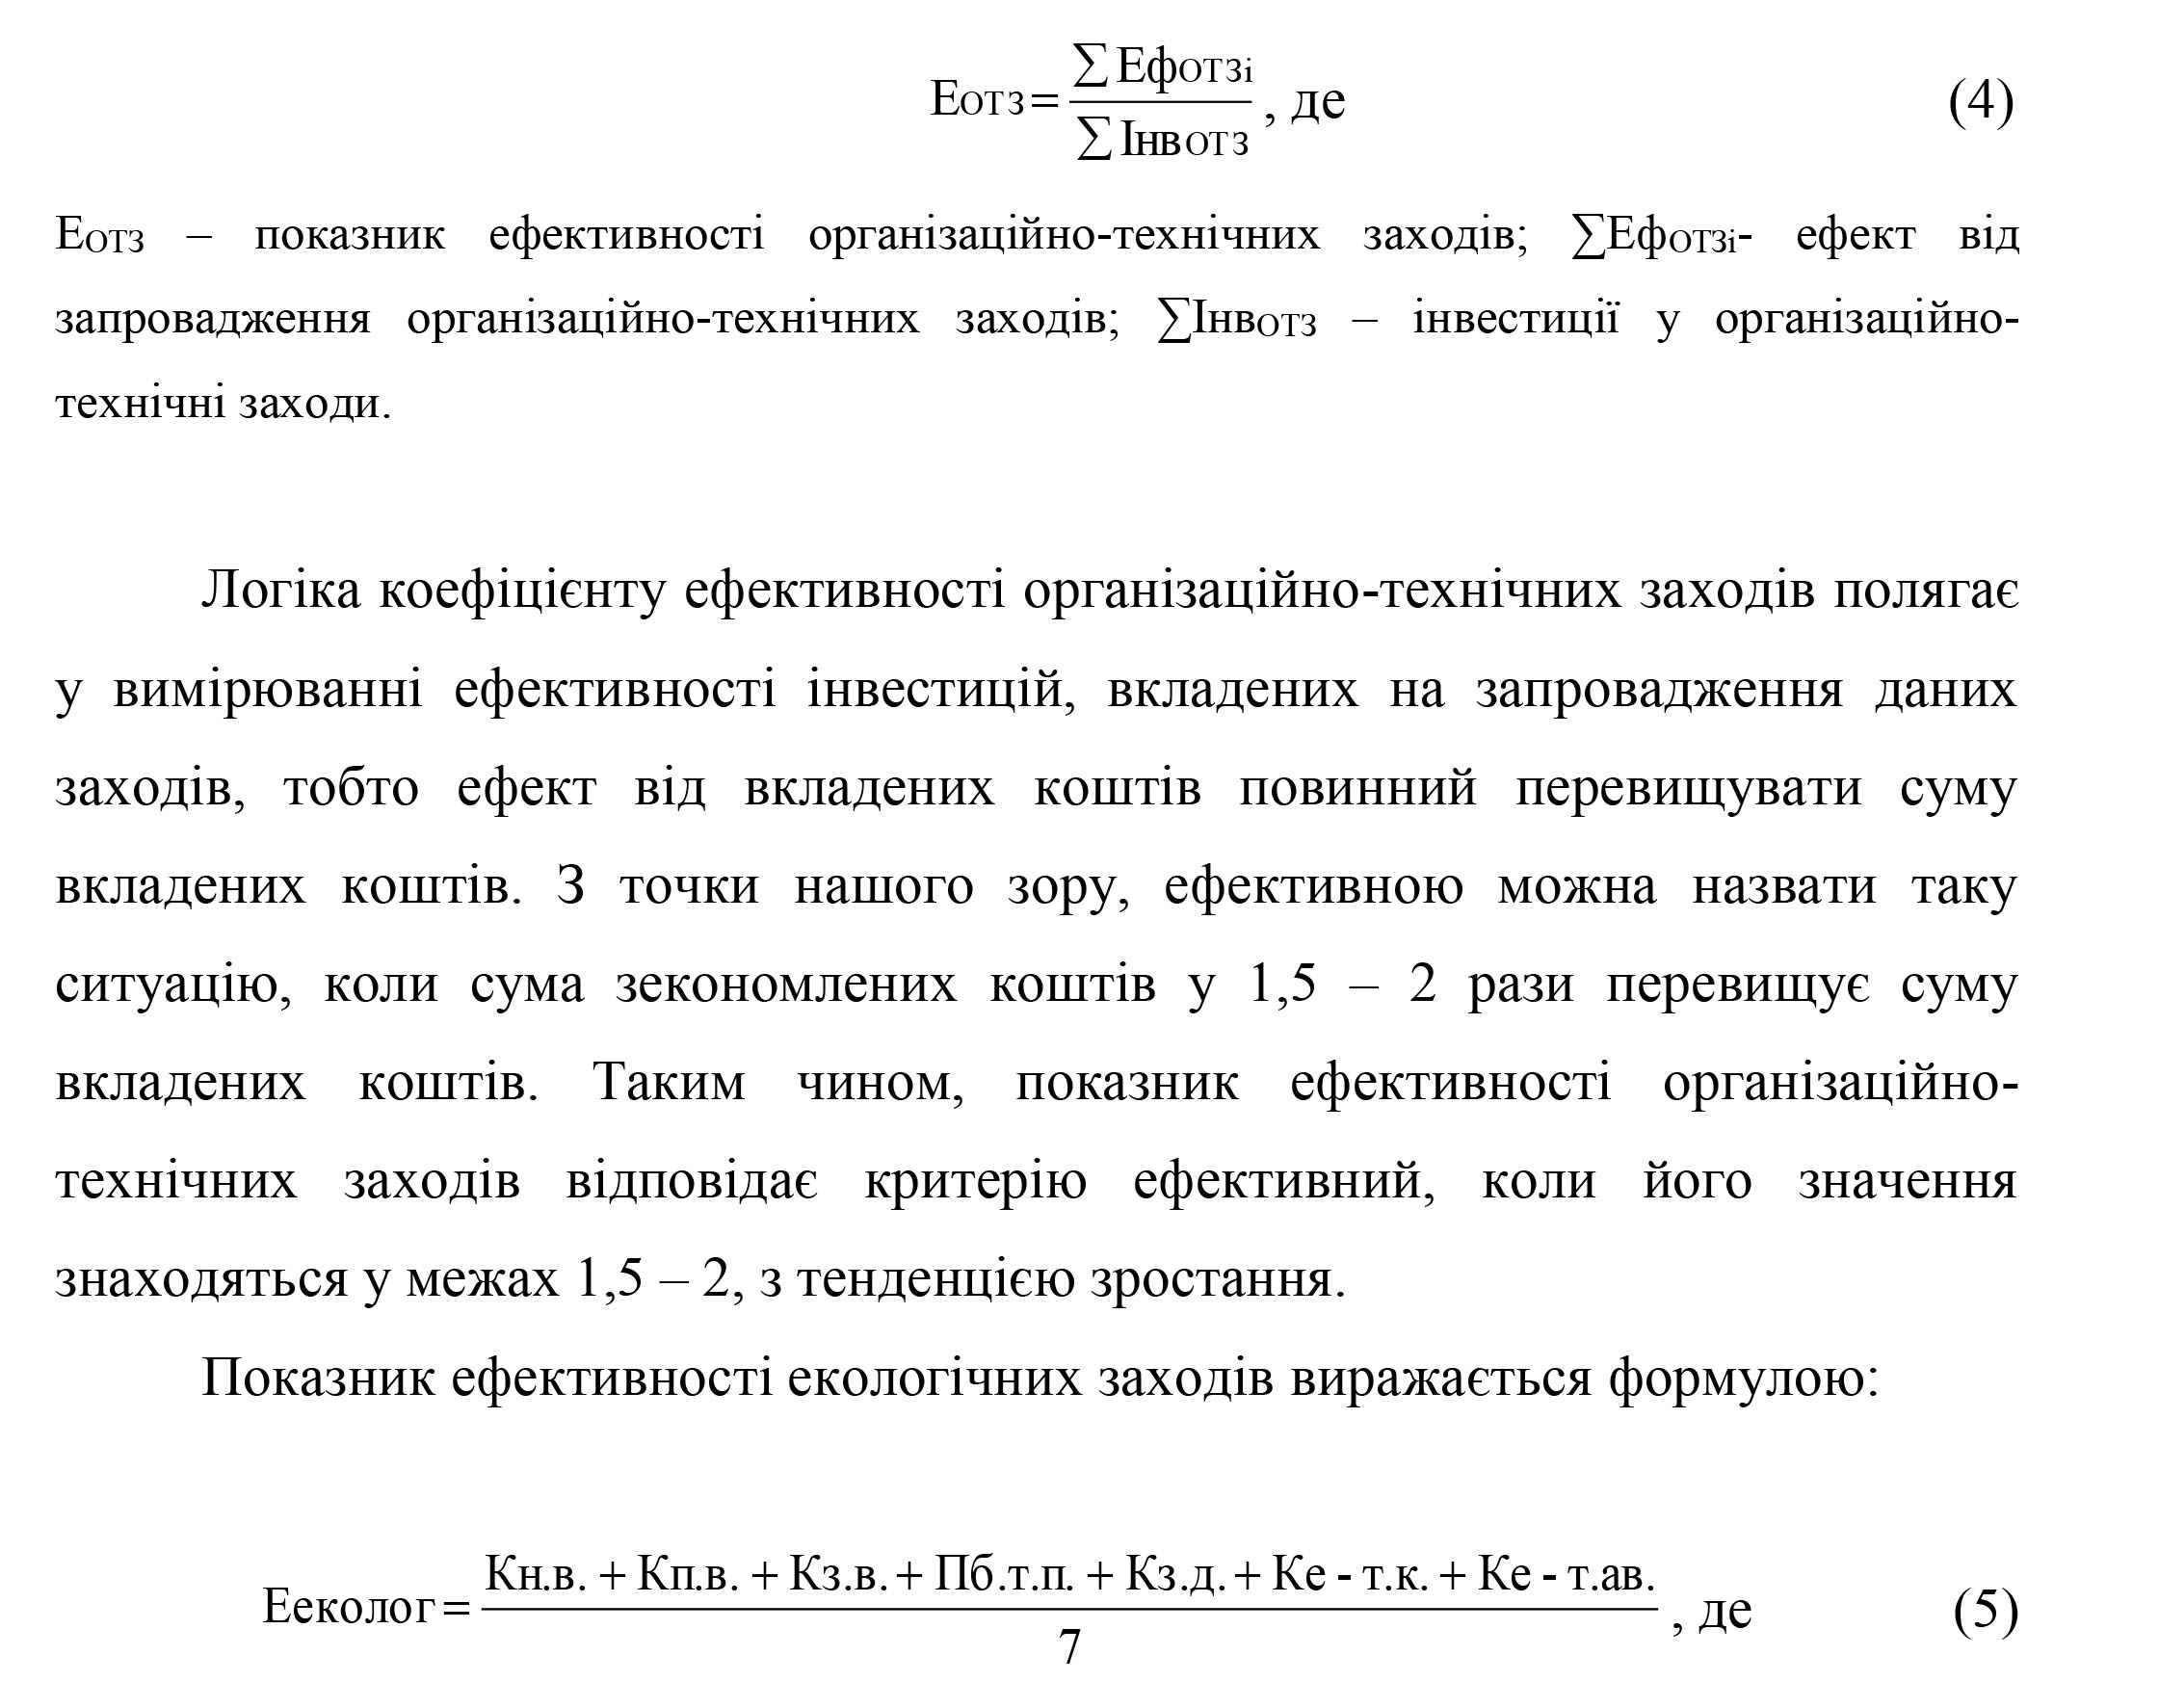
Ecologist — an indicator of the effectiveness of environmental measures; Book — coefficient of compliance with the standards of dangerous emissions into the air; Cp — to the coefficient of compliance with freshwater consumption standards; Kv.v — to the coefficient of compliance with the standards of discharge of polluted waters; Dp — to the index of waste of technological processes; Fr. — the coefficient of compliance with the standards of land contaminated with production waste; Because — to the coefficient of compliance with ecological and technological standards of boilers; Ke-so. — to the coefficient of compliance with the environmental and technological standards of vehicles.
The optimum status of an indicator of environmental measures occurs when up to 100% of the normative provisions that are in place in an organization or enterprise defined in environmental legislation are implemented. Considering a 20% error correction of 100% or 1, the best performance interval will be 0.8 — 1. We
examine the direct performance indicators for their nomenclature, better interval characteristics and the relationship between these indicators.
For the planning system, the property of equilibrium means the ability to maintain the mechanism of functioning between its elements, fulfilling the qualitative and quantitative characteristics defined in the plans of the enterprise. Therefore, this property of the planning system is characterized by the following indicators:
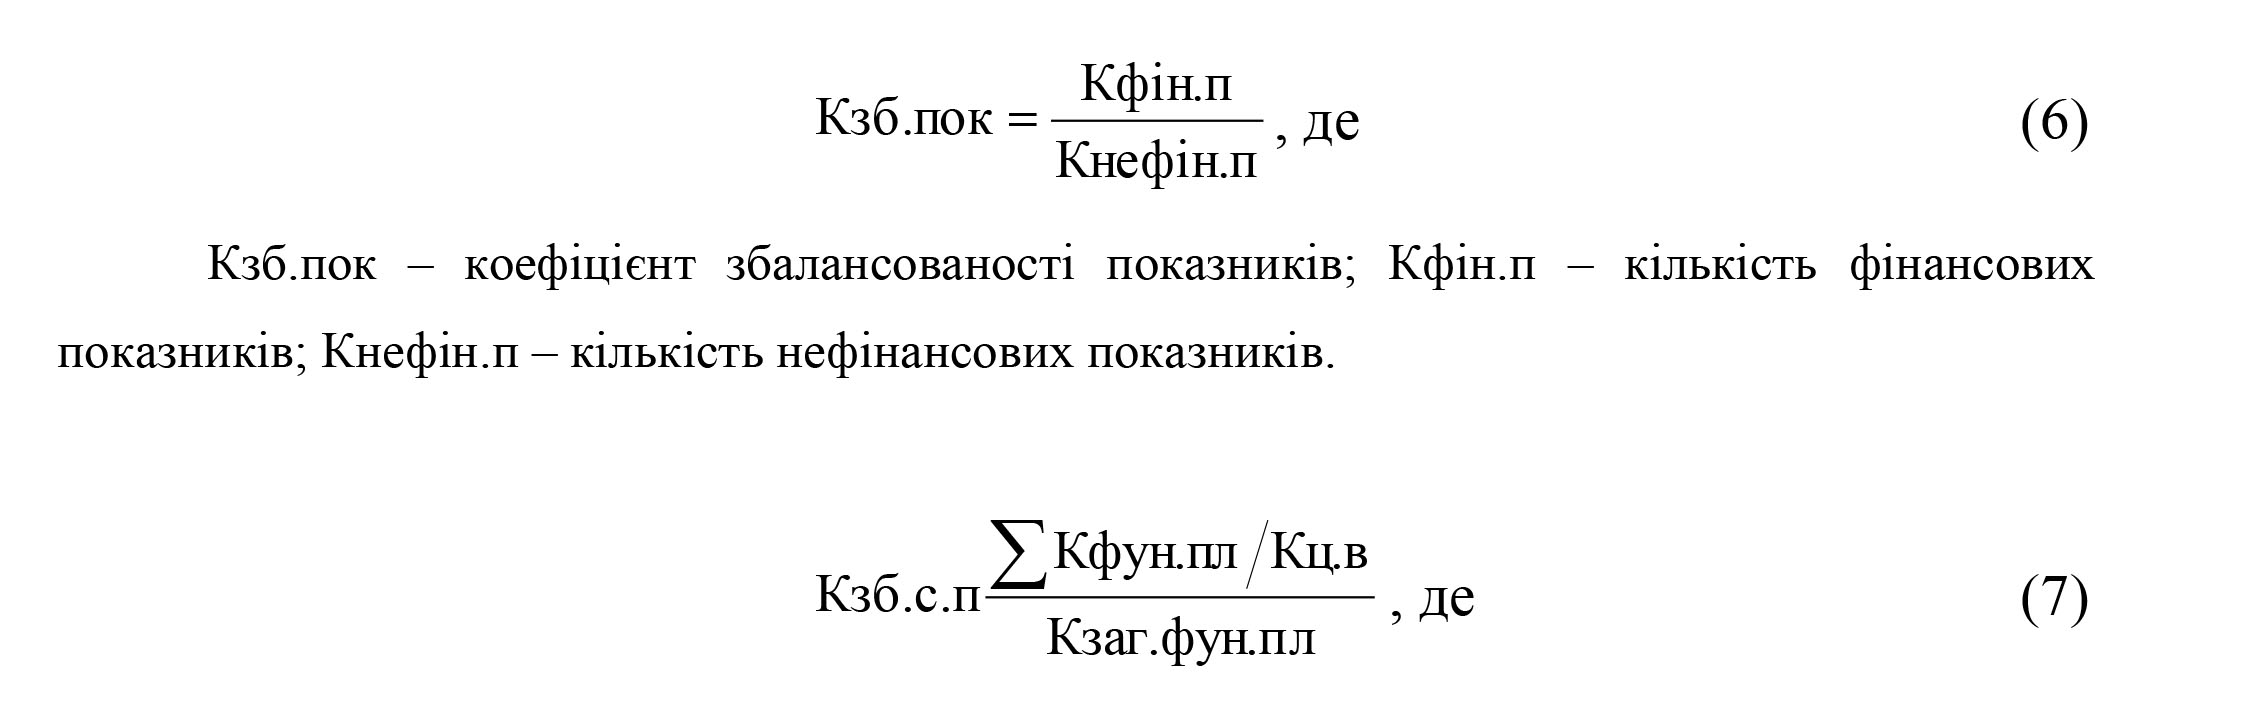
CCS — coefficient of balance of the plan system; Kfun.pl — number of functional plans of one structural subdivision of the enterprise; Kc.v — number of structural divisions of the enterprise; Kg.fun.pl — the total number of functional plans of the whole enterprise.
Only financial indicators can not characterize and multifaceted directions of development of the enterprise, as they essentially state the results of non-financial nature. Therefore, to ensure a balanced development of the company it is necessary to apply a number of non-financial indicators, which will allow to achieve a certain balance in the mechanism of functioning between the elements of the planning system. It is necessary to give him a quantitative description of his better condition, which is that one financial indicator should have from 2 to 5 non-financial indicators [15, 16, 17]. Based on this ratio, the interval corresponding to the best characteristic is 0.2 — 0.5.
The equilibrium effect of the mechanism of functioning between the elements of the planning system is fulfilled by the balance factor of the system of plans, since the separation of a certain number of centers of responsibility leads to the decentralization of management of the enterprise, and at the same time increases the responsibility of each such center of responsibility, which ensures the balance between rights, obligations and responsibility of all structural units in the enterprise. By this logic, each structural unit should strive for a situation of self-sufficiency and self-financing, that is, the services it provides must be in demand from other units, in other words they must be competitive in comparison with external enterprises and organizations that can provide the enterprise with identical services.
The next property of the planning system — sustainability, which together form such a popular phrase today as a stable equilibrium, which all businesses should strive for, is very related to the category of equilibrium. Therefore, the equilibrium in the planning system is when the unplanned actions of the contractors of the enterprise, its consumers, natural factors, the planning system retains all or part, but within acceptable limits, its structure and mechanisms of functioning of its elements. This property is identified by the following indicators:
Kst.zv — coefficient of stability of bonds; Book Call — the number of new connections that have emerged between the elements of the planning system; Kz.zv — the total number of links between elements of the planning system.


Kst.el — coefficient of stability of elements; Kn..el — the number of new elements that have arisen in the planning system; Kg.el — the total number of elements in the planning system.
The introduction of these coefficients is due to the need to monitor changes occurring in the planning system as a result of actions on it by external factors. In our opinion, the situation when all the elements and the relations between them are in the unaltered state is impossible and possibly impractical, since the planning system belongs to the class of socio-economic systems, and therefore it is inherent in both dynamism, variability and stochasticity. that are prerequisites for constant change in it. Moreover, over-resilience adversely affects system properties such as adaptability and flexibility, which in this case are the antithesis of stable equilibrium, since they imply changes but which are subject to certain limitations.
In determining the quantitative characteristics, we take into account the notion of stable equilibrium given by Kurbatov and Ugolnytsky, which distinguishes, in accordance with the equation of the derivative function of zero, a trivial, asymptotically stable and stable state [18]. And OS Stoyanova, using the statistics apparatus, «uses as a parameter of stability a coefficient of variation equal to the ratio of the mean square deviation to the mathematical expectation, namely … if ν ≤10%, then the system can be attributed to stable with weak variability of parameters if ν = 10 — 30%, then the system… can be considered as relatively stable or critically stable… variability… moderate, if ν> 30%, then the system is unstable and variability… strong ”[9, S. 207, 208]. If you apply the analogy method to the scheduling system, it turns out that the best interval, which characterizes the stability of both bonds and elements will be equal to 10 — 30% or 0,1 — 0,3. However, it should be noted that these elements and links should not be system-forming.
However, the system is not always able to achieve its tasks without changing some of its characteristics, namely structural, parametric, algorithmic, in other words adapt. An adaptation to a planning system is its ability to modify its structure, the links between the elements, and the mechanism of operation to accomplish the tasks specified in the plans. We will interpret this property with the help of indicators that indirectly define it, that is, the following indicators make it possible to determine the conditions without which it is not possible to carry out the adaptation of the system:
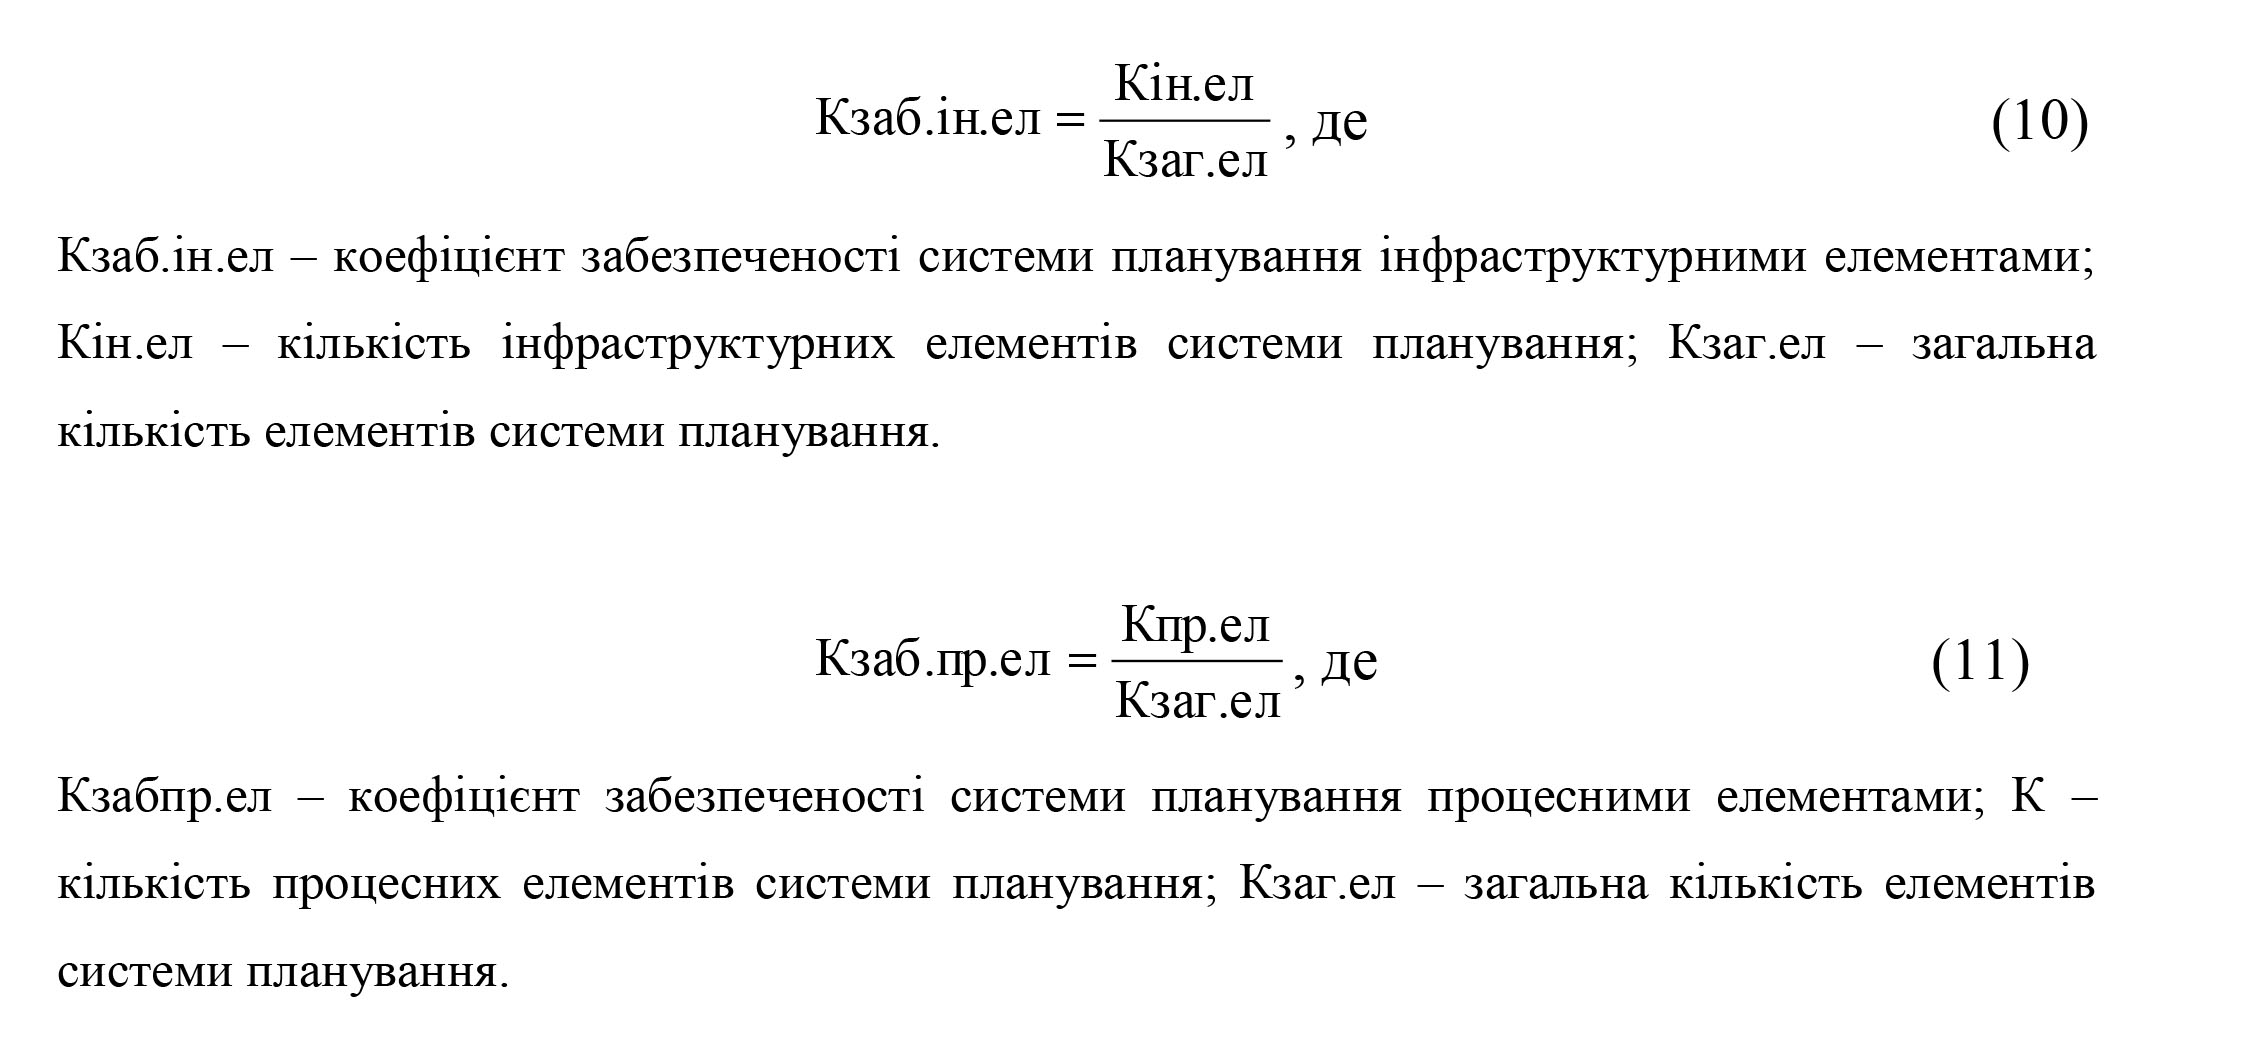
Kzabpr.el — coefficient of security of the system of planning by process elements; K — the number of process elements of the planning system; Kg.el — the total number of elements of the planning system.
The planning system must consist of providing, process and resultant elements, so the presence of supporting and process elements is a prerequisite for the effective functioning of the system; Therefore, it becomes necessary to carry out the planning, namely, to maneuver the structure, the links between the elements and the mechanism of operation in order to fulfill the tasks specified in the plans, . Based on the theoretical merits of this problem, there must always be three process elements for effective planning: strategic, tactical, and operational planning, as well as the relevant three processes, in terms of strategic, tactical and operational plans. The number of security elements may vary depending on the decryption of such element as other infrastructure provision: from 5 to 8 elements. Accordingly, the following ratios occur: 5/3/3; 8/3/3, and the total number of elements ranges from 11 to 14. These ratios form the interval corresponding to the best characteristic, which is:
— for the coefficient of security of the planning system by infrastructure elements 0.45 (5/11) — 0.57 (8/14);
— for the factor of safety of the system of planning by process elements 0,21 (3/11) — 0,27 (3/14).
The next property of flexibility is tightly coupled with adaptability and is characterized by the ability of the planning system to change its structure, elemental relationships and mechanism of operation as quickly as possible. We will also quantify this property by means of an indicator that indirectly defines it, that is, the following indicator gives an idea of how automated management processes are, which indirectly affects the speed of response to changes occurring in the planning system in the direction of its significant increase:

Cavt pl — coefficient of automation of the planning system; Cavt.op.op — the number of management operations performed using an automated control system; Kg.upr.op — the total number of management operations.
Today, it is very difficult to build any system, including a scheduling system, without the use of computer hardware and IT, since, first, its integrity will in many cases be of a nominal nature and, secondly, its execution time own functions will be unjustifiably large. Therefore, in the process of development of computer software, which makes it possible to change the previously developed algorithms and mechanisms without any additional effort, it becomes possible in the shortest possible time to make the necessary changes in an automated control system that meets the requirement of system flexibility. Based on the above, we believe that the option is that all management processes are performed automatically. Given a margin of error of 20% from 100% or 1, our best interval will be 0.8 — 1.
The vitality of a planning system is characterized by its ability to efficiently change its structure, the links between elements, the mechanism of operation, while achieving the set goals in the plans and aiming at a higher level of development. The viability of the scheduling system is reflected by the following indicator:

Kshchiln.zv — coefficient of link density of the planning system; Calling — the number of external links of the planning system; Quarterly — the number of internal links of the planning system.
In order for the system to exist as such and to be separated from another super-system or chaos, a prerequisite is the occurrence of force between the elements forming the system, higher than with the other elements surrounding the system and, in fact, are external to the system to her. Thus, it is obvious that the system must have more internal connections, which will increase the strength of the interconnection of its elements, on the other hand, the system must respond to the changes that occurred in its external environment, and adapt to them. Therefore, the link density factor should not be higher than 1, since it will be direct proof of system failure and its distribution to other systems of the supersystem, and should be set to 0, as it will indicate that the system is in isolated or artificially created environment or is the highest supersystem, which cannot be, because such a system is the universe. Thus, the number exceeding zero is optimal, that is, when at least one external connection appears. Given a 20% margin of error (error) of zero, the interval corresponding to the best estimate will be <0 — 0.2.
The planning system works reliably, provided that its elements and the bonds that unite them in a particular set, function for a certain period of time, without going beyond the regulatory limits of the tasks defined in the plans. Reliability is identified by the following indicator:

Kvik.fo — coefficient of performance of functional duties; Kel., Ph.D. — The number of elements and relationships that have ensured the fulfillment of their functional responsibilities; Kg.el., sv — the total number of elements and links.
Each element of the planning system must clearly fulfill its functional tasks, and the connections that link them must ensure the continuity, continuity, clarity of work. The quality of the planning process and its outcome depends on it, since any delay or failure in the system where sometimes immediate decisions are needed can have quite negative consequences in the form of loss or competitive advantage or direct monetary loss. Therefore, the situation is best when the elements and connections of the planning system perform their functions 100% perfectly. Given a 20% error of 100% or 1, we obtain the best interval of the coefficient of performance of functional duties: 0,8 — 1.
The security of the planning system is manifested when its basic elements, the links between them and the logic of the mechanism of functioning remain unchanged under the influence of internal and external influences of the control system, as well as when the activity of the planning system itself does not change the basic elements, relations between them and the logic of the mechanism. functioning of the management system. Planning system security can be represented by the following indicators:
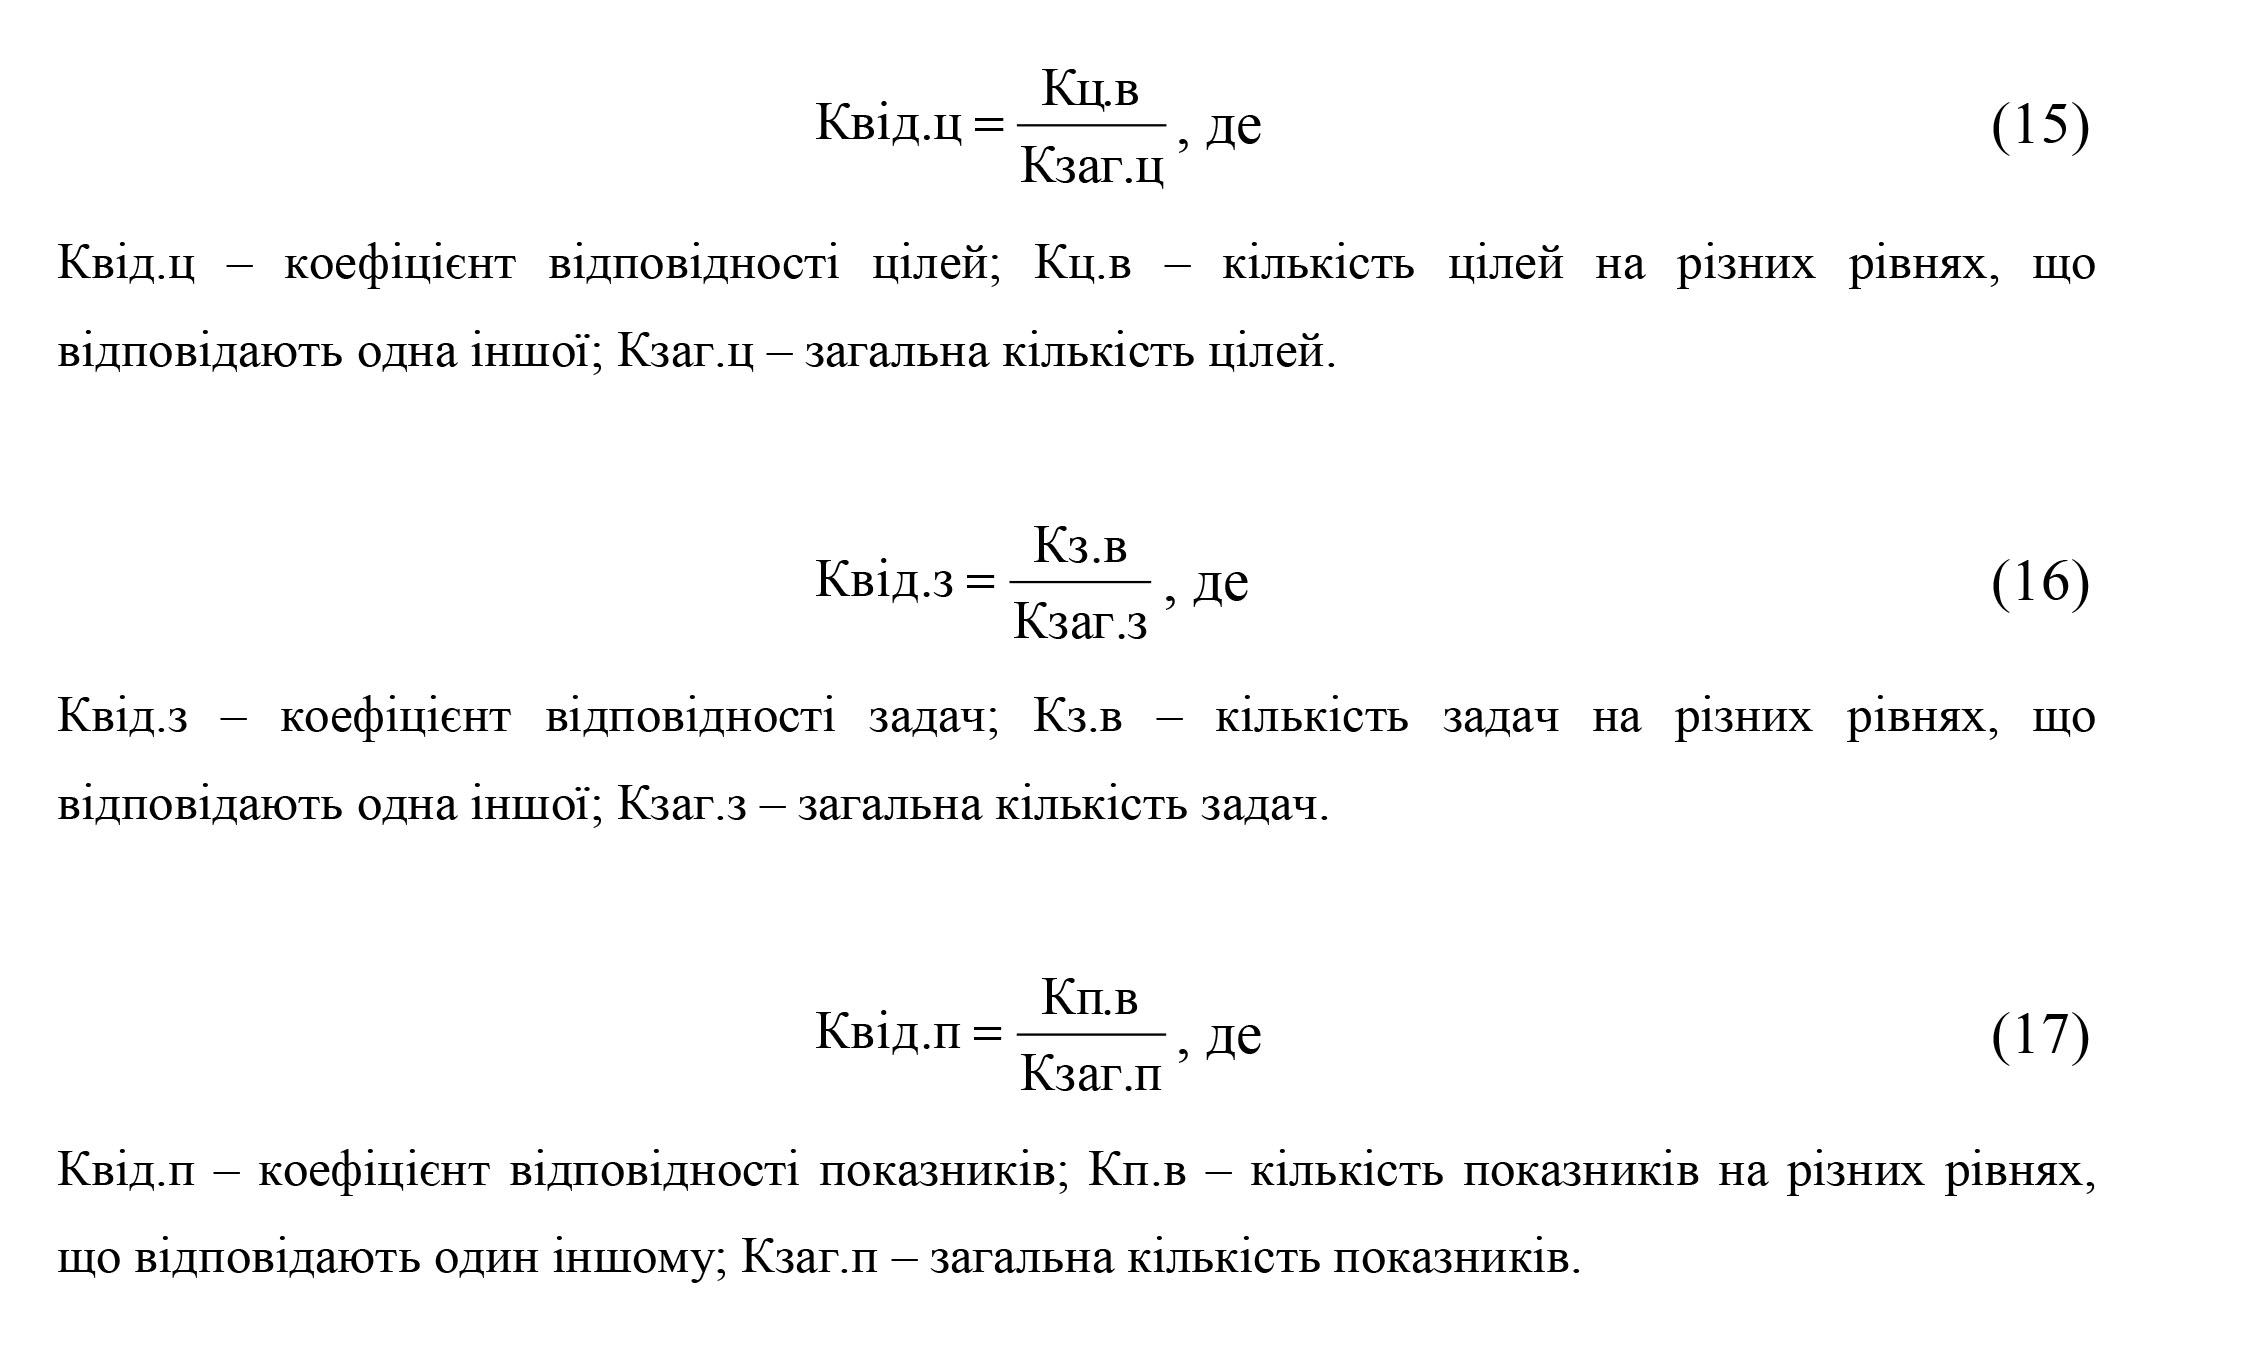
All of the above categories, namely goals, objectives and metrics, are interrelated, so we will determine the explanations and performance criteria right away for all of these factors. Therefore, all these categories must not only correspond to each other at the strategic, tactical and operational levels within each category, but must also correspond to one category (goals), second category (objectives), but also to the third category (indicators). From this, one can determine that the state of affairs is optimal when 100% of goals, objectives and indicators are coordinated at strategic, tactical and operational levels. Given a margin of error of 20% from 100% or 1, we define the interval corresponding to the best estimate: 0.8 — 1.

Quid.c.v — compliance ratio of plans by responsibility centers; Kpl.ts.v.v — number of plans of responsibility centers that correspond to each other; Kgpl.ts.v — total number of plans by responsibility centers.
The balance and co-ordination of the plans of the enterprise must be maintained at all the centers of responsibility we have identified. Therefore, the functional plans of the enterprise must 100% correspond to the relevant plans of the structural units and calculations of business processes. Therefore, the compliance ratio of the plans for the responsibility centers, taking into account the margin of error (error) of 20% from 100% or 1, the interval of its best characteristics will be 0.8 — 1.
On the basis of the best interval (effective) characteristic of the values of the performance indicators and their other gradations (moderate-efficient, low-efficient and low-efficient state), we calculate a reference table of the values of the coefficients according to their performance criteria (Table 1).
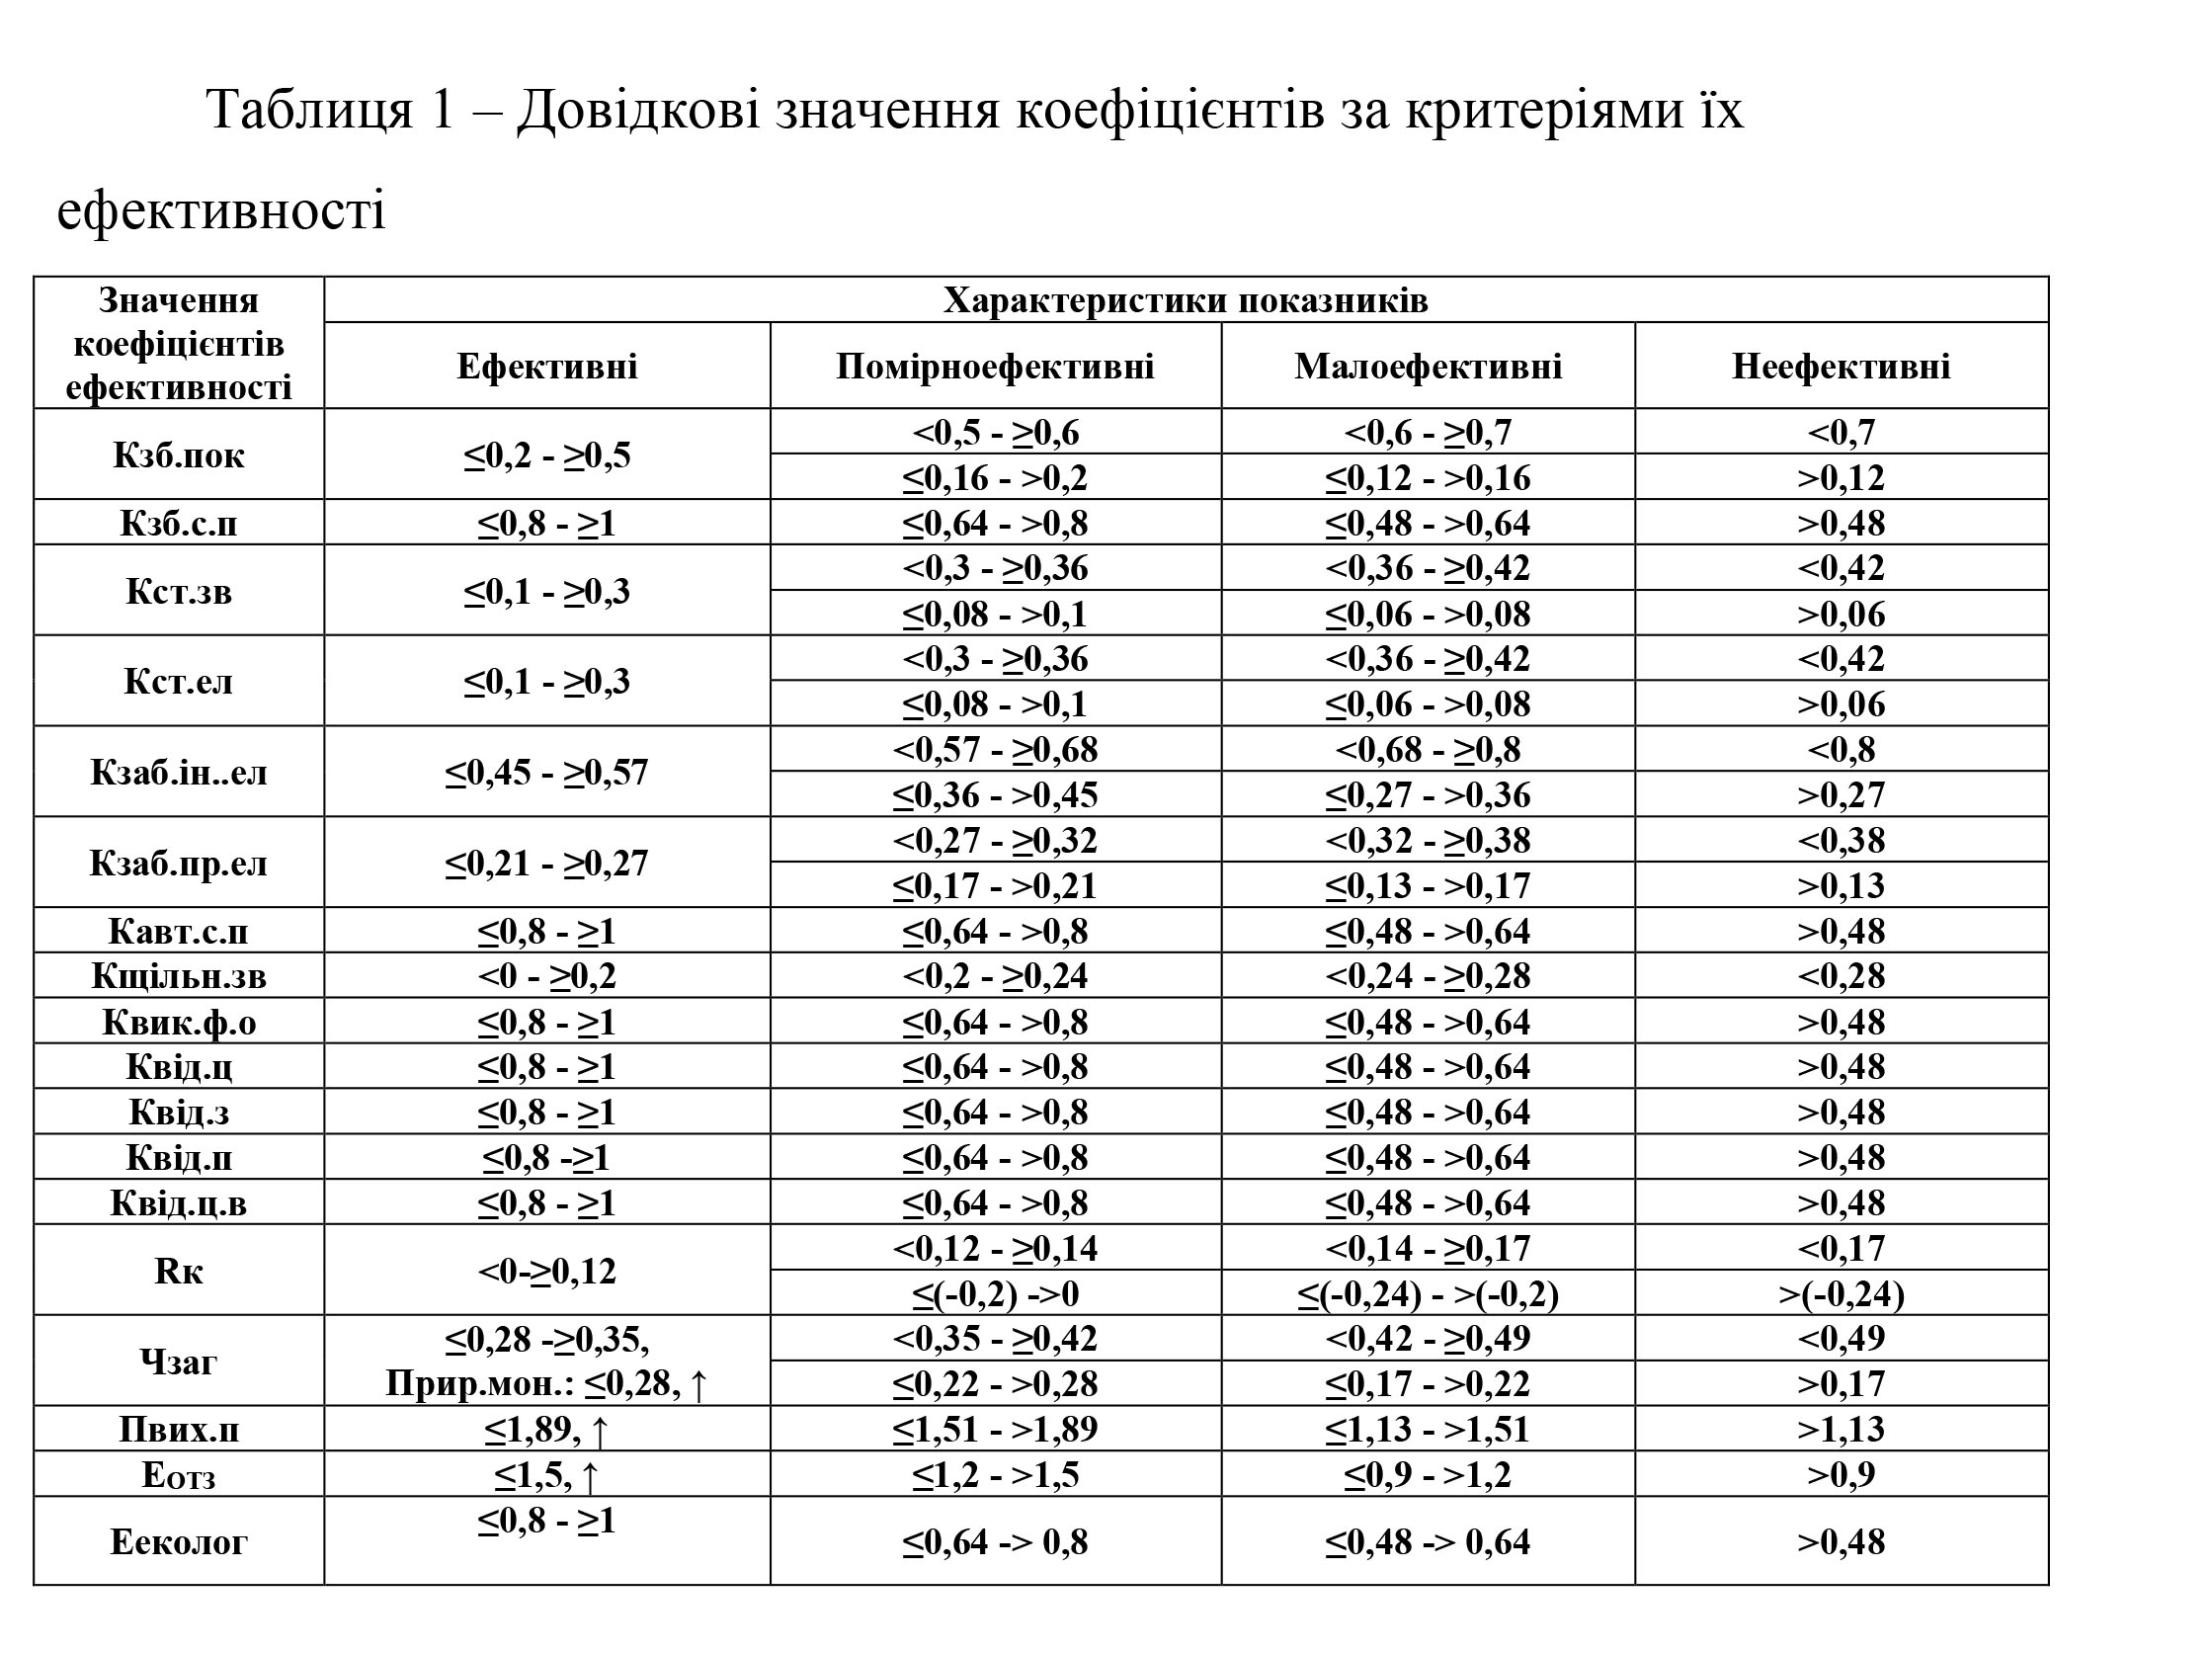
Having determined the composition of the indicators that characterize the effectiveness of the planning system and their criteria, it must be said that from our point of view, we understand the effective planning system and determine the mechanism for evaluating its effectiveness.
An effective planning system is the result of planning, which is expressed in the construction, on the basis of a system of laws, principles and methods, of a set of subsystems of assurance, process and performance, which are divided into components, and then the elements, which are interconnected with the main purpose, constitute one subordinate structures act as a whole, separated from each other based on the functions they are supposed to perform, enabling them to function more efficiently and to meet the best criteria equilibrium, sustainability, adaptability, flexibility, reliability, viability and security, as well as mediating the success of the entire management process, which is expressed in profitability, investment attractiveness, competitiveness, modernization, innovation,
You can evaluate the effectiveness of a planning system on the basis of the quantitative criteria of the above performance indicators, which can be used in aggregate, on the basis of a matrix approach, or summarize them into a single integrated performance measure. To do this, we group groups of direct and indirect indicators into the corresponding integral indicators and build a performance matrix on their basis.
We summarize direct performance metrics into integral direct performance metrics and indirect performance metrics into integral indirect performance metrics. Because integral data components (direct and indirect performance metrics) have quite a different range of values, it can lead to non-validation of indicators with a smaller range of values over higher value ranges, which will not properly reflect the quantitative characteristics of the integral metrics data. Moreover, the direct performance metrics presented by us are not a clearly good trend, as there is only a small range of values where the efficiency is greatest, and in the case of a decrease or increase from that range.
Therefore, we introduce a measurement point scale for the proposed integral indicators. At the heart of this scale will be the above ranking of indicators included in the integral, namely their distribution into effective, moderately effective, inefficient and inefficient. Thus, for each indicator, if its state is effective it will be assigned 1 point, if moderately effective — 0.75 points, if ineffective — 0.5 points and if poorly effective — 0.25 points. The formulas for these two integral performance measures are presented below.
IPE = Bcc b + Bcc b + Bcc b + Cc b + Cc b + Cc b + Cc b +
Kschiln.zv + b + Kvyk.f.o b + Kvid.ts b + Kvid.z b + Kvid.p b + Kvid.ts.v be , where (19)
IPE is an integral direct indicator of efficiency; Bkp b — coefficient of balance of indicators, translated into points (hereinafter referred to as b / w); BPS b — coefficient of balance of the plan system, b / w; Kst.zv b — coefficient of stability of bonds, p / b; Kst.el b — coefficient of stability of the elements, p / b; Kzab.in.el b — coefficient of security of the planning system with infrastructure elements, b / w; Kzab.pr.el b — coefficient of security of the system of planning by process elements, b / w; Cavs b — coefficient of automation of the planning system, b / w; Kshchiln.zv b — coefficient of communication density of the planning system, b / w; Quic.fo b— coefficient of performance of functional duties, p / b; Quid.c b — coefficient of compliance of goals, p / b; AQ with b — coefficient of compliance of tasks, p / b; Apt b — coefficient of conformity of indicators, b / w; Quid.c.v b — coefficient of compliance of plans by responsibility centers, p / b.
IOPE = R to b + Chzag b + Pvih.p b + E OTZ b + Ecologist b , de (20)
IOPE is an Integrated Indirect Performance Indicator; R to b — return on equity, b / w; Chzag b — share of enterprise services market, b / w; Piv.p b — output of enterprise services, p / b; Е ОТЗ b — efficiency of organizational and technical development of the enterprise, b / w; Ecologist b — the effectiveness of environmental events, p / b.
We consider it advisable to introduce 4 matrix fields — an efficient, moderately efficient, poorly performing and poorly performing planning system according to the distribution of performance indicators. Based on this, in summarized form, the set of indicators that effectively evaluate, form an effective planning system, the set of indicators that measure well, form a moderately effective planning system, the set of indicators that meet the assessment satisfactorily, form a poorly performing planning system, and a set of indicators that meet poorly form a low-performing planning system. However, a set of performance metrics may also be more diverse, that is, a compilation of several types of performance metrics. So first of all,
Since the integral direct indicator of efficiency includes 13 direct indicators of efficiency, its highest value cannot be greater than 13. For the same reason, the highest value of integral indirect indicator of efficiency cannot be higher 5. These two indicators will form the axes of the matrix: according to vertically, an integral direct performance indicator will be displayed vertically, an integral indirect performance indicator. These axes will be broken down into four equal intervals, corresponding to the effective, moderately effective, ineffective, and inefficient state of the integral direct and indirect performance indicators. In addition, the same intervals will correspond to the above ideal position when all performance indicators are the same quality state: or only effective,
At the intersection of straight lines drawn through points on the vertical and horizontal axes, matrix fields corresponding to the characteristics of the two integral indicators are formed. In this way, 16 matrix fields are formed, showing correlation of qualitative characteristics of integral indicators. However, in the general form, the matrix will be reduced, as already mentioned, to four common fields that will comprehensively reflect the state of the system (Fig. 2).
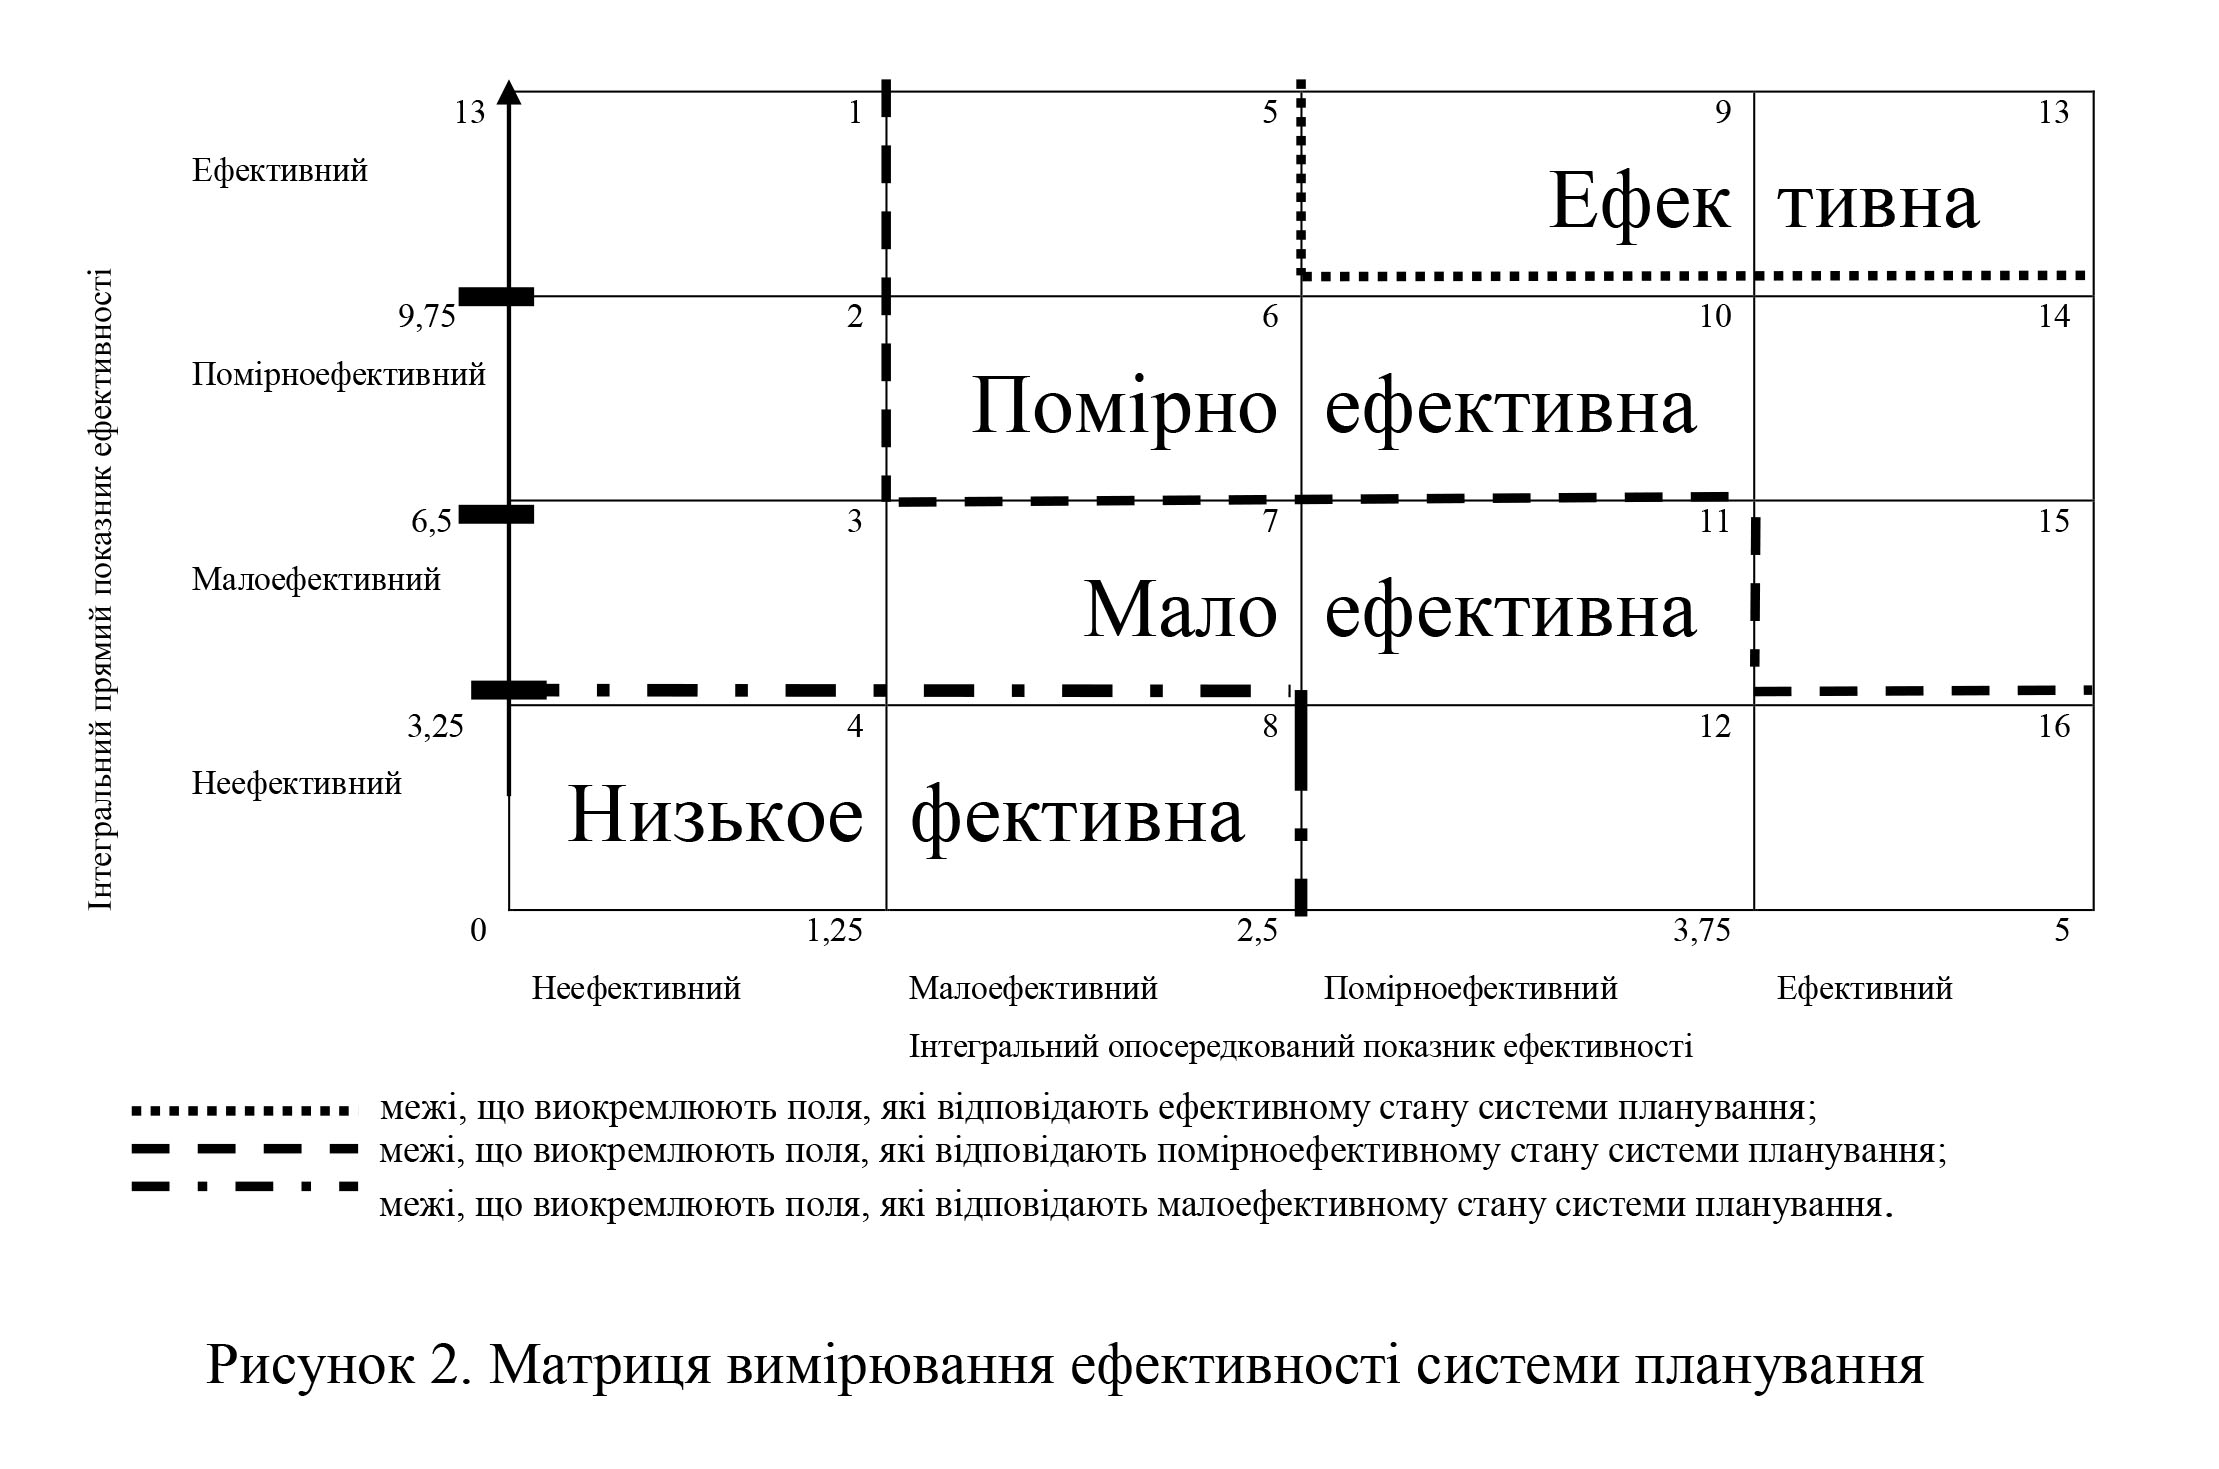
This reduction of 16 fields to 4 main fields of the matrix is due to the fact that it is necessary to provide a generic characteristic of the planning system, that is, to evaluate it by the criteria previously presented. The availability of these 16 fields of the matrix is due to the fact that it clearly shows which subsystems and to what extent the problems occur, and then, analyzing the composition of an integral performance indicator, to identify the bottlenecks at the expense of which such a condition was obtained .
The assignment of one or other of the main 16 fields of the matrix to each more aggregated, derived 4 fields is based on the economic logic and intuitive experience of the author. As noted earlier, the state of the indicators corresponds to the generally accepted score of excellent, good, satisfactory and unsatisfactory, or 5, 4, 3, 2. Accordingly, by calculating the arithmetic mean of the two integral performance scores, we can obtain an average score that will determine the overall state of the system planning. However, in our view, the significance of these integral indicators is not uniform, since only one of them directly characterizes the efficiency of the planning system itself, while the other only indirectly characterizes the planning system as one of the subsystems of the management system. Therefore, for a more accurate characterization of the planning system, it is necessary to weigh the integral indicators by inputting a weighting factor for each of them. Thus, for the integral direct performance indicator such coefficient is equal to 1, and for the integral indirect performance indicator — 0.8. Therefore, the general state of the planning system will be determined by calculating the arithmetic mean by the following formula:

Their — weighted arithmetic mean; N is the number of variables in a series of observations, x i is the i-th random variable in a series of observations; ω and is the weighting factor of the ith variable.
Based on the preliminary calculations 4, 8 the field corresponds to the unsatisfactory state of the planning system; 1, 2, 3, 7, 11, 12, 16 fields — poorly performing state; 5, 6, 10, 14, 15 fields — moderately effective state; 9, 13 fields — effective state.
The mechanism of using the matrix of evaluation of the efficiency of the planning system is as follows:
1) calculate the quantitative characteristics of the efficiency coefficients;
2) divide them by types and performance criteria;
3) assign to each efficiency factor an appropriate rank score and calculate integral direct and indirect performance indicators;
4) determine on the axes of the coordinates of the matrix the values of the calculated integral direct and indirect performance indicators, we draw through the points tangent at the intersection of which forms a point that falls into a particular field of the matrix, thus determining the state of the system.
Assessing with the help of this matrix and the indicators included in its composition, the effectiveness of the planning system should outline some limitations on its use:
1) all indicators, as well as the methodical approach indirectly characterize the effectiveness of planning, due to the high complexity of single process — planning, overprocess management;
2) such separation of management planning is artificial, which cannot be practically encountered, since it can be fairly arbitrarily divided when the planning process ends and the implementation process begins, and then, in turn, control and analysis processes — they go through different objects sometimes in parallel, sometimes in series;
3) however, such a section of management, in the form of planning, is very useful for a thorough understanding of the nature and content of planning, clearly identified problems and places of their formation;
4) in general, this approach is about the degree of formalization of planning, since it is only by such indirect characteristics that it is possible to determine its presence and quality level, and if it is not formalized, then where can it be known at all, therefore, it exists only in the human mind ;
5) the quality of the planning system as a matter of principle and the planning itself can only be judged from formalized sources available to us, although the planning process at the subconscious level is inherent to each individual, however, only highly qualified specialists can formalize it accurately;
6) assessment of the quality of the planning system is based on the presence of completeness of elements and relationships between them, the presence of all necessary processes;
7) planning reflects unformalized thinking in the form of a certain superstructure in the human mind, so it may be that the de facto planning system is de juro (in the form of symbols on any material medium), so by our criteria it turns out, that such a system is inefficient and, in fact, contains all the necessary criteria, only they are known to one or more professionals engaged in management activities at the enterprise;
8) however, the case referred to in the previous paragraph can only occur in small enterprises, where a relatively small group of people can make such plans orally, in large enterprises this is not feasible, since the size of the enterprise increases the complexity of managing and coordinating it. activities between his workers, and therefore carry all the nuances in his mind becomes impossible, so it becomes necessary to formalize them.
Conclusions.The introduction of direct and indirect indicators of the effectiveness of the planning system has allowed a comprehensive and correct assessment of its effectiveness. This eliminated the situation, when the effectiveness of the planning system was equated with the effectiveness of the entire management system, allowed to isolate and distribute the problems of planning and problems of other stages of management, which positively affected the management activity of the enterprise, because it allowed to clearly identify at what stage of management there are problems and correct precisely that stage, as well as clearly assessing the actions of employees of one or another stage of management, thereby motivating them to responsibility and disciplinary accuracy . However, this set of performance metrics is inexhaustible and may change and be modified or modified over time,
References :
1. I. Ansoff. Strategic management. / Igor Ansoff — M .: Economics, 1989 .— 304 p.
2. R. Akoff. Planning for the future of a corporation. /AckoffRonald -M .: Progress, 1985 .— 328 s.
3. D . Benveniste. Mastering the planning policy. [Trans. from English / under. ed. Kalantarova]/Guy Benveniste — M: «Progress» «Univers» — 1994 — 304.
4. Markina I.A. Methodological issues of management effectiveness / Markina IA // FU. — № 6. -2000. — 24 — 32 p.
5. Samuelson PA. Economy. Ed. 15th. [Trans. from English Quotes] / Samuelson P.A., Nordhaus V.D. — M .: 1997. — 487p.
6. Markov M. Technology and the effectiveness of social management [TRANS. with bulg. / Ed. T.V. Kerimova] / Markov M — M .: Progress. — 1982. — 48 p .
7. Maroshi M. Organization, stimulation, efficiency [Translated from Hungarian.] / Maroshi M — M.: Economics. — 1981. — 208 c .
8. E.V. Minko. The theory of the organization of production systems : at cheb. n special / E.V. Minko, A.E. Minko. — M .: CJSC «Publishing House» Economics «», 2007. — 493 p.
9. E.V. Freudin . The study of management systems: a training manual / E.V. Freidin [ed. Yu.V. Guseva] — Moscow: From Omega-L, 2008. — 367 p .
10. Buslenko N.P. Lectures on the theory of complex systems / Buslenko N.P., Kalashnikov V.V., Kovalenko I.N. — M .: Publishing house «Soviet Radio». — 1973. — 441 p.
11. Reichman EP Expert methods in assessing the quality of goods / Raikhman E.P., Azgaldov G.G. — M .: Economics, 1974. — 151 p.
12. Khamkhanova D.N. Fundamentals of qualimetry: a training manual / Khamkhanova D.N. — Ulan-Ude: Publishing House of VSTU, 2003 — 142 p.
13. V.N. Eitingon. Methods of organizing the examination and processing of expert assessments in management: a training manual / V.N. Eitingon, M.A. Kravets, N.P. Pankratova. — Voronezh, 2004 — 44 p.
14. Uzbekistan Agency of Communications and Informatization, Center for Scientific, Technical and Marketing Research, Basic Metrological Service “Information and Reference System”. [Electronic resource] / Access mode to the site: http://metrolog.aci.uz/book_4.5.htm
15. M .O. Kizim. Balanced Scorecard: Monograph. / MO Kizim, AA Pilipenko, VA Zinchenko — X .: INZHEK — 2007. — 192 p.
16. Kaplan R. Strategy-oriented organization. How organizations using a balanced scorecard succeed in the new business environment / Kaplan Robert S .., Norton David P. — M.: Olymp-Business — 2005. — 416 p.
17. Kaplan R. Strategic maps. Transformation of intangible assets into tangible results / Kaplan Robert S. — M.: Olymp-Business — 2005. — 512 p.
18. Kurbatov V.I. Mathematical methods of social technologies: a training manual / Kurbatov V.I., Ugolnitsky G.A. — M .: 1998. — 256 p.
GENERATING E PLANNING SYSTEM PROMOTES INNOVATION AND SUSTAINABLE DEVELOPMENT OF THE ENTERPRISE
section of the monograph were published in 2013 — Kh — 2013 — 210, © AV Nemtsov.
The introduction of innovation contributes to the sustainable development of the enterprise, for which it is necessary to create the appropriate conditions (infrastructure) that arise, including due to the implementation of the planning process at a high level. Important here is the development and application of such theoretical and methodological support, which will allow the formation of the structure of the planning system on the above principles.
The basis of any theoretical and methodological support is the highest form of scientific knowledge — theory. In addition to the theory in the field of scientific research, a hypothesis, an axiom, a concept are identified, which are revealed in the totality of laws and laws, principles, methods and means, the latter being the basis of methodological support.
As the eminent scientist Albert Einstein writes: “Science has no lifelong theories. Any theory has its own period of gradual development and triumph, after which it can come to an early sunset. … the creation of a new theory is like climbing a mountain, which opens up new and wide views, showing unexpected connections between our starting point and its diverse environment ”[15, P.265]. Developing the above thought, deep in content, researcher E.V. Freidina writes: “The history of the development of science indicates that a new scientific theory, no matter how subverting it may seem, does not deny the completely old theory, but gives a deeper, more complete and unified explanation to a wide range of phenomena and processes, interprets them in a new way and includes previous results as a special case. … Science is not a warehouse of ready-made and comprehensive truths, and the process of achieving them, moving from limited knowledge, approximate, to an increasingly general, deep, accurate. This process is limitless ”[7, P.45].
So from the previous statement, as well as the practice of being, we can conclude that theories interact with each other, and even the most contradictory do not completely exclude one another. Moreover, many theories from various branches of knowledge that have their own points of contact have appeared and continue to appear in the world today. Today it is impossible to investigate a particular process, object or phenomenon using one theory, because in this case we deliberately impoverish the multidimensionality and versatility of the subject, deliberately simplify it, as a result of which we have incorrect, fragmented knowledge, which leads to a misconception about the subject research, wrong conclusions, and as a result of wrong actions. So, for example, the scientist L.A. Krivtsun, studying the problem of structural shifts in nonequilibrium systems, applies a set of theories to study this process: the theory of economic dynamics, the theory of chaos, the theory of growth, the equilibrium theory, synergetic theory, the theory of unbalanced economic growth, the theory of systems, economic theory, etc. [9, 65 — 95 p.]. And J. K. Laft, studying the theory of organization, directly applies the imperatives of systems theory in the form of a systematic approach to the study of any organization from the point of view of its construction as a system [10, 88 — 96 p.]. Thus, we have all the powers and capabilities to study the process of forming the enterprise activity planning system, applying the provisions of several theories. At the very least, we should use the theory of dialectics, general economic theory, systems theory, management theory, organization theory. Their fundamental relationship is presented in Figure 1.
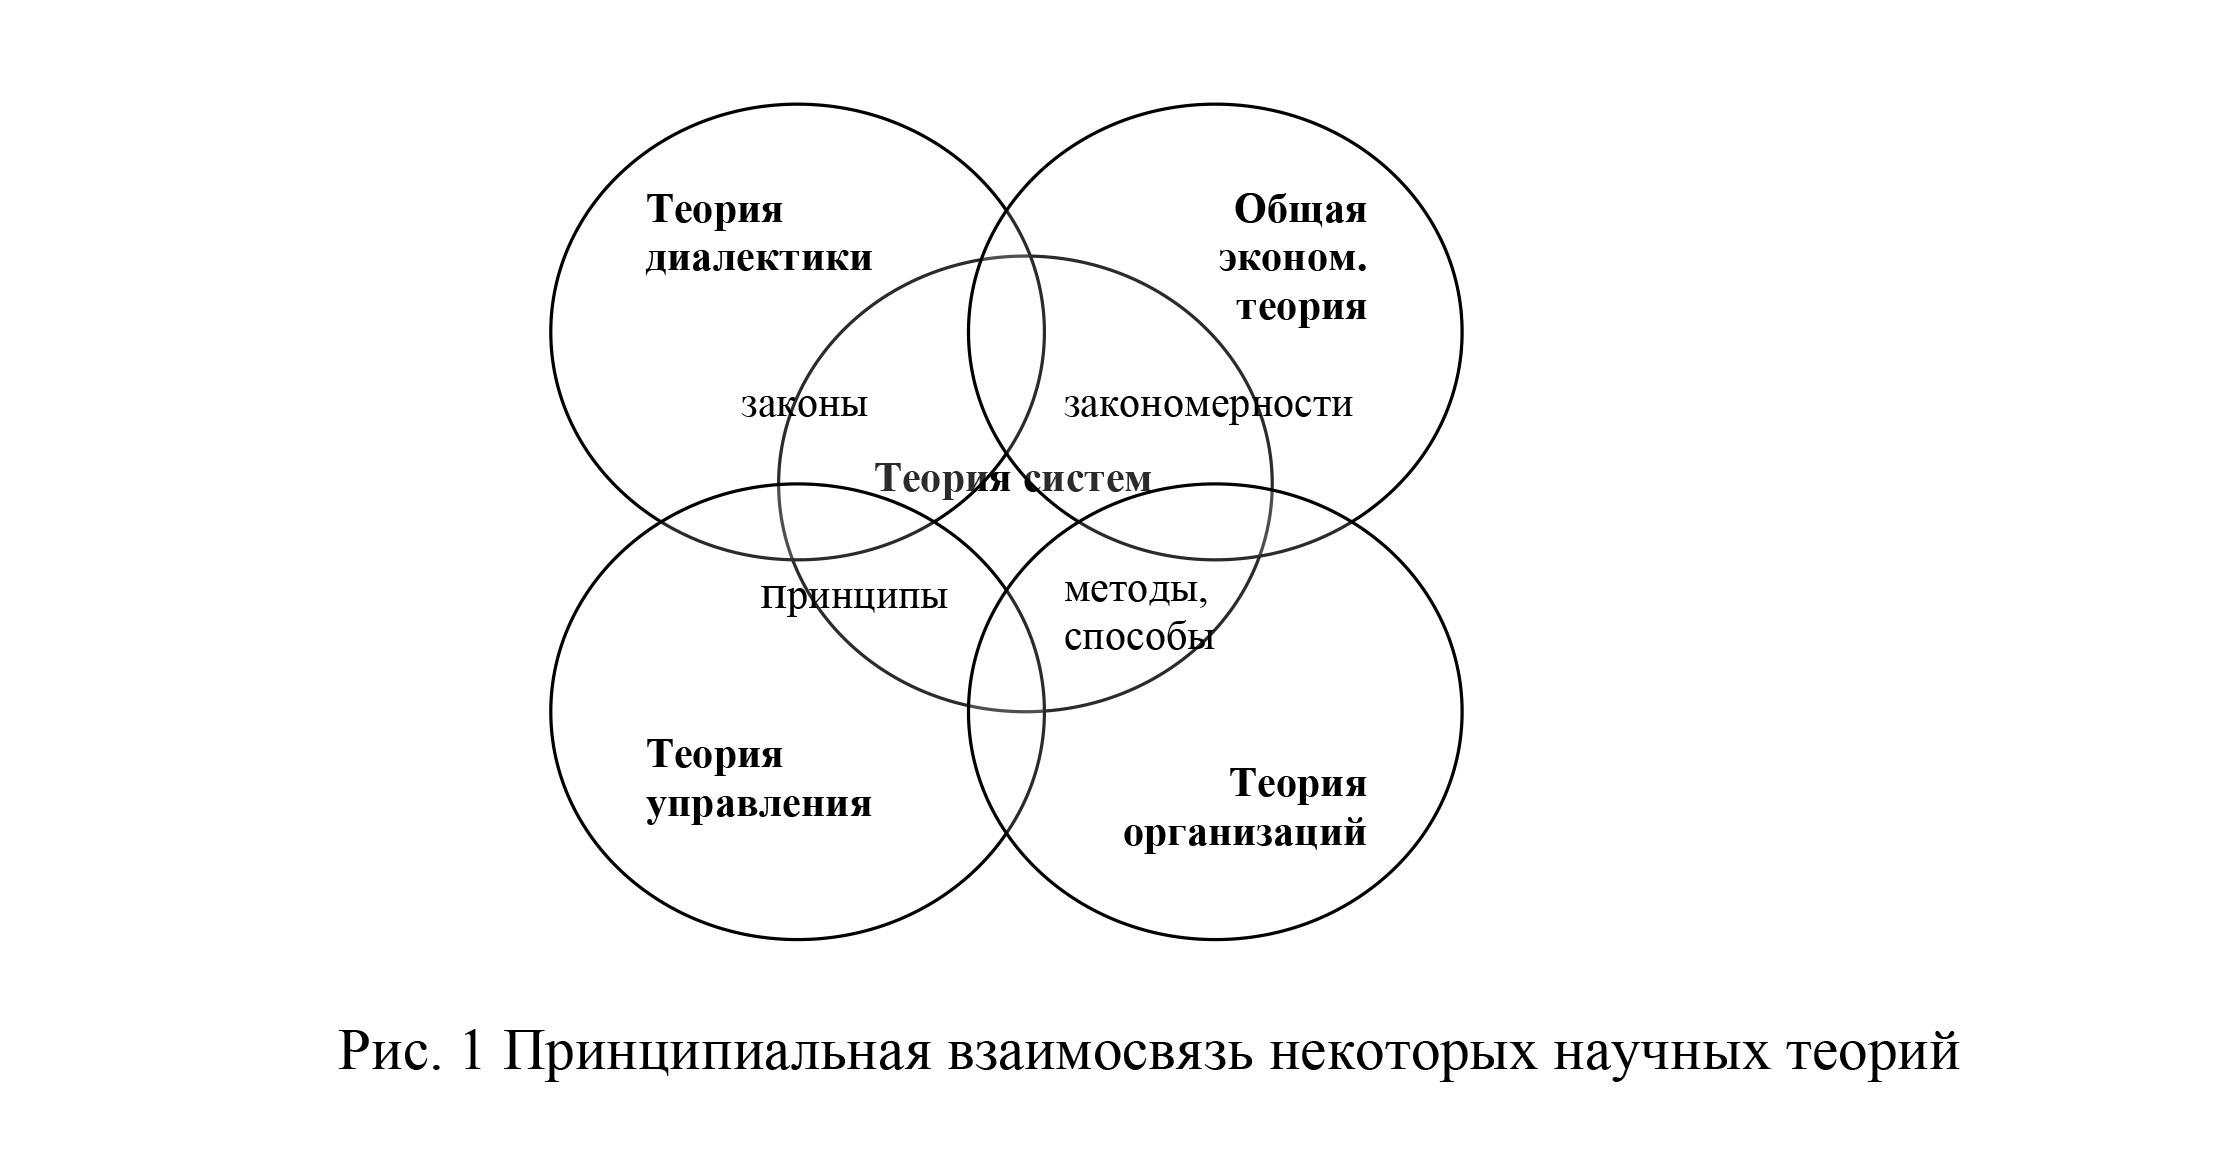
Conventionally, we assume that the central theory among the aforementioned is the theory of systems, since it carries general knowledge about the structure of the universe, and all other theories are built on the principles of systemicity (intuitively before formalizing this Bertalanffy theory and, obviously, after that).
As mentioned above, theories are revealed in the totality of laws and laws, principles, methods and means. Since we are investigating the process of building a system that is economic, as a result of which a certain organizational structure is created, where the managerial process then begins to be implemented, it becomes necessary to apply the laws, laws, principles, methods and methods of all theories we have identified, and in a certain structural , logical, hierarchical relationship and sequence. A harmonious combination of the above theoretical and methodological tools provides the opportunity for the correct construction and further effective functioning of the planning system.
So, the system approach is central here. Its main meaning is to represent the object, subject, process, phenomenon, substance in the form of a system, that is, distributed to certain elements connected by direct and feedback connections (moreover, they are stronger inside this system than outside) and which are its interconnections with other systems of the same level or a supersystem of a higher level. A more detailed description of the systematic approach to planning is to perceive it as a process with an emphasis on training and development, the possibility of conducting not only a qualitative, but also a quantitative assessment, and the ability to solve unstructured problems. Therefore, the use of a systematic approach to the planning process involves, first of all, the formation of a planning system, which boils down to:
1) systematization of theoretical and practical knowledge of planning;
2) the definition of the stages of planning;
3) the definition of the relationship of planning with other economic processes;
4) analysis of the methodological support of the planning process;
5) analysis of the structure of the planning system (planning process) in enterprises;
6) analysis of the system of plans of enterprises;
7) the formation of the implementation mechanism: laws, principles and methods;
8) designing the structure of a quality (effective) enterprise planning system;
9) creating the structure of a system of plans;
10) the selection of indicators of the system of plans of enterprises and their coordination among themselves;
11) the creation of a system of indicators for assessing the effectiveness of the enterprise planning system.
I study more deeply the problem of constructing an effective planning system, first of all, it is necessary to understand the essence of the planning process and the management process, which are often identified, but are nevertheless different, both part to the general and planning is only part of the management, in which also includes implementation (motivation, organization), control (accounting) and analysis (on the one hand, the planning process precedes, on the other, it follows immediately after the control). As the experience of especially domestic enterprises shows, planning is often at a fairly good or even good level, but the implementation of the planned, their concrete implementation is at a very poor level, which mainly explains the large discrepancy between the planned indicators as the main indicators of the planning process, with actual indicators, as the main indicators of the management process. Such a deep understanding of planning as part of management gives an idea of the basic theoretical and methodological postulates on which an effective planning system should be formed.
As the analysis of the scientific literature and the regulatory support of planning shows, there is no methodology that would reflect the process of creating a planning system, as an enlarged, global with respect to its components, superstructure. We offer a methodological approach to the analysis of the formation of the planning system, which we formed on the basis of the IDEF0 methodology (Fig. 2).

This language of business process modeling was proposed in the 70s of the 20th century by Douglas Ross and was called in those days — SADT (Structured Analysis and Design Technique). Using a subset of SADT, the US military modeled processes for implementing projects under the ICAM (Integrated Computer-Aided Manufacturing) program, after which this format became the US federal standard called IDEF0.
In the IDEF0 standard, the system that is being modeled is considered a subset of the universe. The researcher determines whether an object will belong to the components of the system, or it will be identified by us as an external influence, which largely depends on the point of view on the system itself. Thus, the system has a boundary that separates it from the whole other Universe. The relationships that arise in the system with the external environment are described by its input, output, control and mechanism. An input represents certain categories that a system converts, an output is the result of the activity of this system, management is characterized by those strategies and procedures by which the work of converting input streams to weekend is carried out, and the necessary resources for carrying out this work can be called a mechanism.
The system in IDEF0 is depicted as a set of related works or functions, which allows more clearly simulate the logic and interaction of enterprise processes. Under the work refers to the named processes, functions or tasks that occur in a certain time period and have certain results. IDEF0 notation provides for the construction of a model as a set of hierarchically ordered and interconnected diagrams: contextual, decomposition, and tree nodes. The context diagram, which is the top of the tree structure of diagrams, usually describes the system and its interaction with the external environment. After the context diagram is described, its functional decomposition is carried out, as a result of which a zero-level decomposition diagram is formed, that is, the main work is presented in the form of large robot fragments,
The presented methodological approach to the analysis of the formation of the planning system allows us to identify the main problems in its structure, which creates the prerequisites for a better construction of this structure. Thus, the effectiveness (quality) of the planning system lies in its structural formation (architecture), which will make it possible to more fully integrate between strategic, tactical and operational planning, thereby contributing to the actual implementation of the plan, as well as the emergence of a positive synergistic effect.
The studied literature showed that the authors basically reduce the planning system to a system of plans [2, P. 39; 6, p. 108; 12, p. 39], although some other elements were highlighted in some works [4 P.127; 5, p. 197; 8, p. 11; 11, p. 78; 14, P. 46], however, they were not structured, and presented not in the form of a system, but as a simple set of elements. The architecture of the planning system that we propose suggests that its elements are structured, the relationships between them are defined, and they are presented in the form of a process system. With this structure of the planning system, the supporting elements are clearly delineated, which included the components of personnel, theoretical and methodological support, methodological support, information support and IT technologies, and other infrastructure support. Other infrastructure support included organizational, legal, scientific, research support. Strategic, tactical and operational planning processes are clearly identified as components of the process subsystem. As a result of the interaction of these processes, a system of plans is formed, consisting of strategic, tactical and operational plans. Thus, the above structure of the planning system, which involves the allocation of infrastructural, process and resulting subsystems, gives a clear understanding of the causal, logical relationship between them. As a result of the interaction of these processes, a system of plans is formed, consisting of strategic, tactical and operational plans. Thus, the above structure of the planning system, which involves the allocation of infrastructural, process and resulting subsystems, gives a clear understanding of the causal, logical relationship between them. As a result of the interaction of these processes, a system of plans is formed, consisting of strategic, tactical and operational plans. Thus, the above structure of the planning system, which involves the allocation of infrastructural, process and resulting subsystems, gives a clear understanding of the causal, logical relationship between them.
The logical continuation of the formation of such an architecture of the planning system is the introduction of a specific organizational structure at enterprises. Responsibility centers are introduced at the level of structural divisions, business processes and the enterprise as a whole. The basis of relations between all centers of responsibility is a decentralized form of management, independence is encouraged, self-financing between structural units is introduced. All this is connected, first of all, with the personnel culture (corporate culture), as well as its competencies. Such changes are strategic, that is, their implementation contributes not only to obtain a one-time gain in money, but also to extend the life cycle of the enterprise, increase its competitiveness and viability.
The main attention in the implementation of planning should be focused on a relatively new trend today — analysis and optimization of business processes. In fact, business processes are primary, and a digital array that sets the desired result or measures its achievement is secondary. That is, digital data reflect the activities of the enterprise as the main control points of measurement, and do not allow either to analyze the mechanism of the processes or adapt them, although these issues are the basis of the final results of the enterprise, expressed in digital form.
A prerequisite for the implementation of effective planning is both the high competencies of the planning and economic apparatus, and the competencies of all employees of the enterprise, because one way or another all of them take or must take part in this process at their level.
One of the main elements of effective planning is information support, the tool of which is an automated information system for enterprise management, which is designed to administer the information flows that come to and from the enterprise. The first step towards creating an information system is to create an informational functional model of the business planning process. The second step is the creation of such models for the processes of analysis, implementation and control. The third step is the creation of enterprise database models for developed business processes and their combination, as a result of which all information will be automatically distributed and redistributed according to those relationships and elements that were identified in the models of management processes (analysis, planning, implementation and control). The fourth step may be the integration of an automated enterprise management information system and an automated enterprise process control system into a single automated enterprise management system. The formation of an automated enterprise management information system involves the creation of its single database, where all existing and incoming information will be located. This purely technical process can only be carried out at the enterprise, since all information is only with them and should be integrated on their servers. The formation of an automated enterprise management information system involves the creation of its single database, where all existing and incoming information will be located. This purely technical process can only be carried out at the enterprise, since all information is only with them and should be integrated on their servers. The formation of an automated enterprise management information system involves the creation of its single database, where all existing and incoming information will be located. This purely technical process can only be carried out at the enterprise, since all information is only with them and should be integrated on their servers.
The creation of automated elements of the information system should improve the course of the managerial process at the enterprise, since it will be much less time spent by its staff on the search for the information it needs. It will also facilitate the communication process between the enterprise and other stakeholders, the main of which are consumers of products (works, services), since this system assumes some open information, as a result of which fewer questions will come from consumers and other interested parties, which will allow staff enterprises do not deal with the answers to them, but with their immediate functional responsibilities. As a result of this, it is primarily expected to save time, for the calculation of which it is necessary to carry out timekeeping of personnel search for information and compare this with the technical capabilities of the designed automated enterprise management system, which, among other things, depends on the qualification level of enterprise programmers or other developers. It should be noted that this is not just a quantitative change, it brings the company to a new higher quality level.
The information system receives information data and managerial influences from the external environment, which enter or are carried out from certain sources. Their specific impact is reflected in the order of conducting business processes at the enterprise and, as a result, on the numerical values of the integrated system of indicators of the enterprise plan system. Thus, some primary indicators, as well as other informational data (textual, symbolic, others) come to the enterprise from the external environment: higher authorities, regulatory authorities, consumers, media, etc. Then the personnel of the enterprise carry out their intellectual processing, as a result of which a system of indicators of the enterprise plan system appears or individual indicators of this plan system are adjusted.
The main problem in the activities of modern enterprises, we see the poor implementation of plans, their existence only on paper and their inapplicability in the implementation of real economic activity, the attitude to planning as an activity that is associated with the bureaucratic tradition of a planned economy, an unnecessary application that exists only because that such a tradition has developed is necessary. However, there are some reasons in the planning mechanism, its methodology and methodology, including through which this process is perceived. A rather weak connection between planning documents, and sometimes its absence, poses various tasks, or tasks that are inconsistent with each other in time. Such a course of events predetermines other disruptions in the plans of the enterprise and gives rise to a negative synergetic effect, which necessitates their study for consistency. It becomes possible to analyze the degree of integration of planning documents with the help of a methodological approach to assessing a system of plans (Fig. 3), which focuses on the interdependent and interdependent arrangement of a set of plans, which meets the basics of an interactive planning concept. The essence of this methodological approach is to determine the level of consistency, coincidence, consistency of planning documents, which may take the form of plans, programs, projects, business plans, costing, etc. It becomes possible to analyze the degree of integration of planning documents with the help of a methodological approach to assessing a system of plans (Fig. 3), which focuses on the interdependent and interdependent arrangement of a set of plans, which meets the basics of an interactive planning concept. The essence of this methodological approach is to determine the level of consistency, coincidence, consistency of planning documents, which may take the form of plans, programs, projects, business plans, costing, etc. It becomes possible to analyze the degree of integration of planning documents with the help of a methodological approach to assessing a system of plans (Fig. 3), which focuses on the interdependent and interdependent arrangement of a set of plans, which meets the basics of an interactive planning concept. The essence of this methodological approach is to determine the level of consistency, coincidence, consistency of planning documents, which may take the form of plans, programs, projects, business plans, costing, etc.
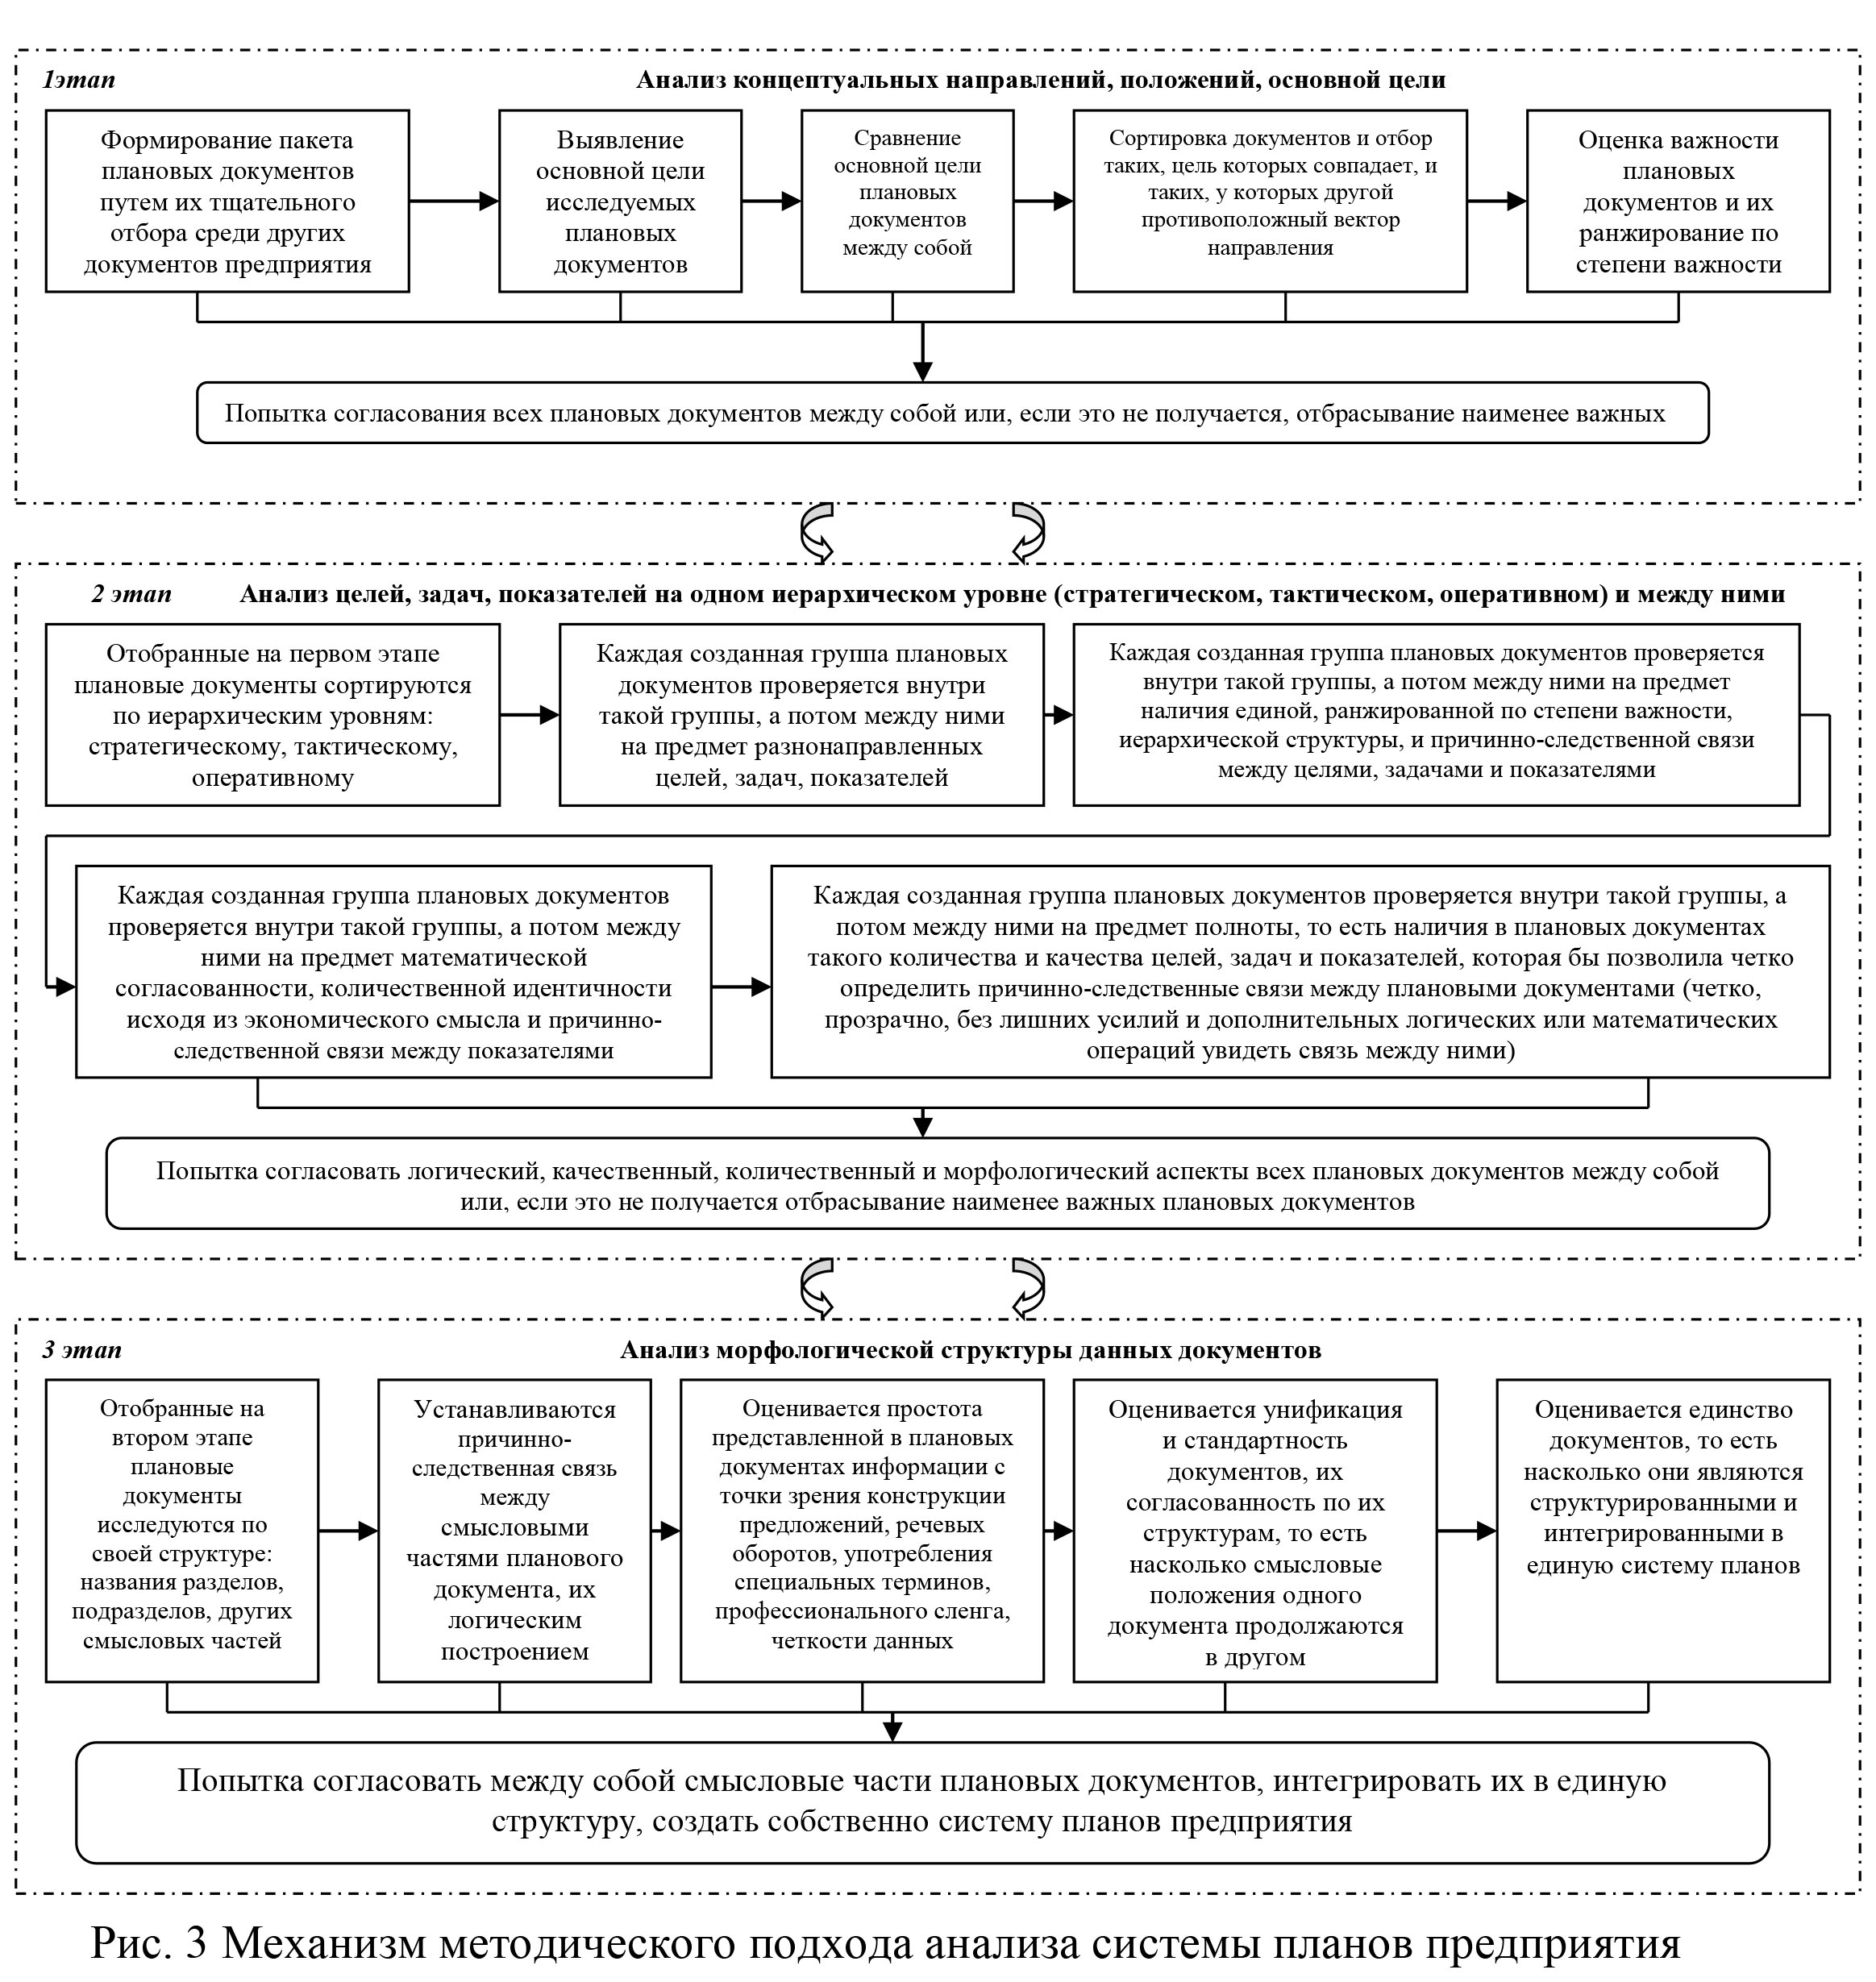
The use of this methodological toolkit will create the prerequisites for the construction of a monitoring system. First of all, this becomes possible due to the introduction of a comprehensive system of indicators, which allows us to analyze all resources and optimize them, in turn, the information subsystem allows us to accumulate useful, new information databases, which makes it possible for company personnel to own the current situation.
At a more aggregated level, the prerequisites for the implementation of a monitoring system appear due to the creation of a comprehensive system of indicators of the effectiveness of the planning system, which distinguishes between the problems of planning itself and the problems of other processes for managing the enterprise.
In the case of the implementation of all measures for the formation of the planning system, and most importantly, a change in the culture of staff interaction between themselves, which is an integral element of all the proposed innovations, without which the rest cannot work out, it will be possible to solve the following basic issues:
1) a clear regulation of the strategic, tactical and operational planning processes at the enterprise, on the basis of their integration;
2) the creation of a comprehensive system of indicators of the enterprise plan system based on their causal relationship;
3) the creation of understandable and specific recommendations on the formation of personnel, organizational, scientific, motivational, legal, methodological, informational support of the planning process at the enterprise;
4) creating the infrastructural opportunity of the enterprise to introduce innovations and thereby steadily develop.
List of used literature:
1. Bashnyanin GI Economic systems: Monograph. [T.2] / Ed. GI Bashnyany. — Lviv: Publisher of the Commercial Academy, 2011. — 496 p.
2. Beltyukov EA Planning the activity of the enterprise: a textbook / EA Beltyukov, AA Brevnov, VN Parsiak — X: Odyssey — 2006 — 384 p.
3. Bertalanffy L. History and status of general systems theory / Ludwig von Bertalanffy // System Studies: Yearbook. M.: Science — 1973 — 56 p.
4. Bogdan AI Strategic planning systems. / A.I. Bogdan // Bulletin of Khark. state. Polytechnic Univ. Collection of Sciences. wash. 90. — Kharkiv: KHPU — 1999. — P. — 126 — 132.
5. Voronkova VG Planning and forecasting in a market environment: a textbook. / per row Ph.D., prof. V.G. Voronkova — To: VD «Professional», 2006 — 608s.
6. Bilan OS Investment planning system at an industrial enterprise. / OS Bilan // Current problems of economy. — 2006. — No. 7 (61). — P. 107 — 112.
7. Freudin EV Management systems research: a textbook / EV. Fredina [ed. Yu.V. Guseva] — Moscow: Omega-L, 2008. — 367 p.
8. Ilyin AI Enterprise planning. Tactical planning. Part 2. [Tutorial in Part II.]; under common. ed. A.I.Ilyina / A.I. Ilyin, LM Sinitsa — Mn .: New Knowledge, 2000. — 416 p.
9. Krivtsun LA Structural shifts in nonequilibrium economic systems: monograph / L.A. Krivtsun. — Kharkiv: NTU «KPI» — 2007 — 428 p.
10. Loft JK The theory of organization: textbook. allowance. / JK Lafta — M.: TC Velby, Issue Prospect — 2003. — 416 p.
11. Bad E.B. Analysis and Evaluation of the Effectiveness of the Functioning of the Planning System / Elena Pooraya // Economics: Problems of Theory and Practice. — Dnepropetrovsk: DNU, 2002. — Vyp. 139. — P. 78 — 82.
12. Polishchuk NV Planning the performance of the enterprise. / NV Polishchuk // FU. — 2001. — № 04. — P. 39 — 44.
13. Tarasyuk G.M. Management of enterprise activity planning: theoretical and practical aspects [Text]: monograph / GM Tarasyuk; Zhytomyr. state. technol. Univ.- Zhytomyr: [ZhDTU], 2010. — 290 p.
14. Khan D. Planning and control: the concept of controlling [Translated from German: ed. and with the foreword. Turchak A.A., Golovach L.G., Lukashevich M.L.] / D. Khan– M .: Finance and statistics. — 1997. — 800 c.
15. Einstein A. Physics and reality. / A. Einstein. — M: Science — 1965.
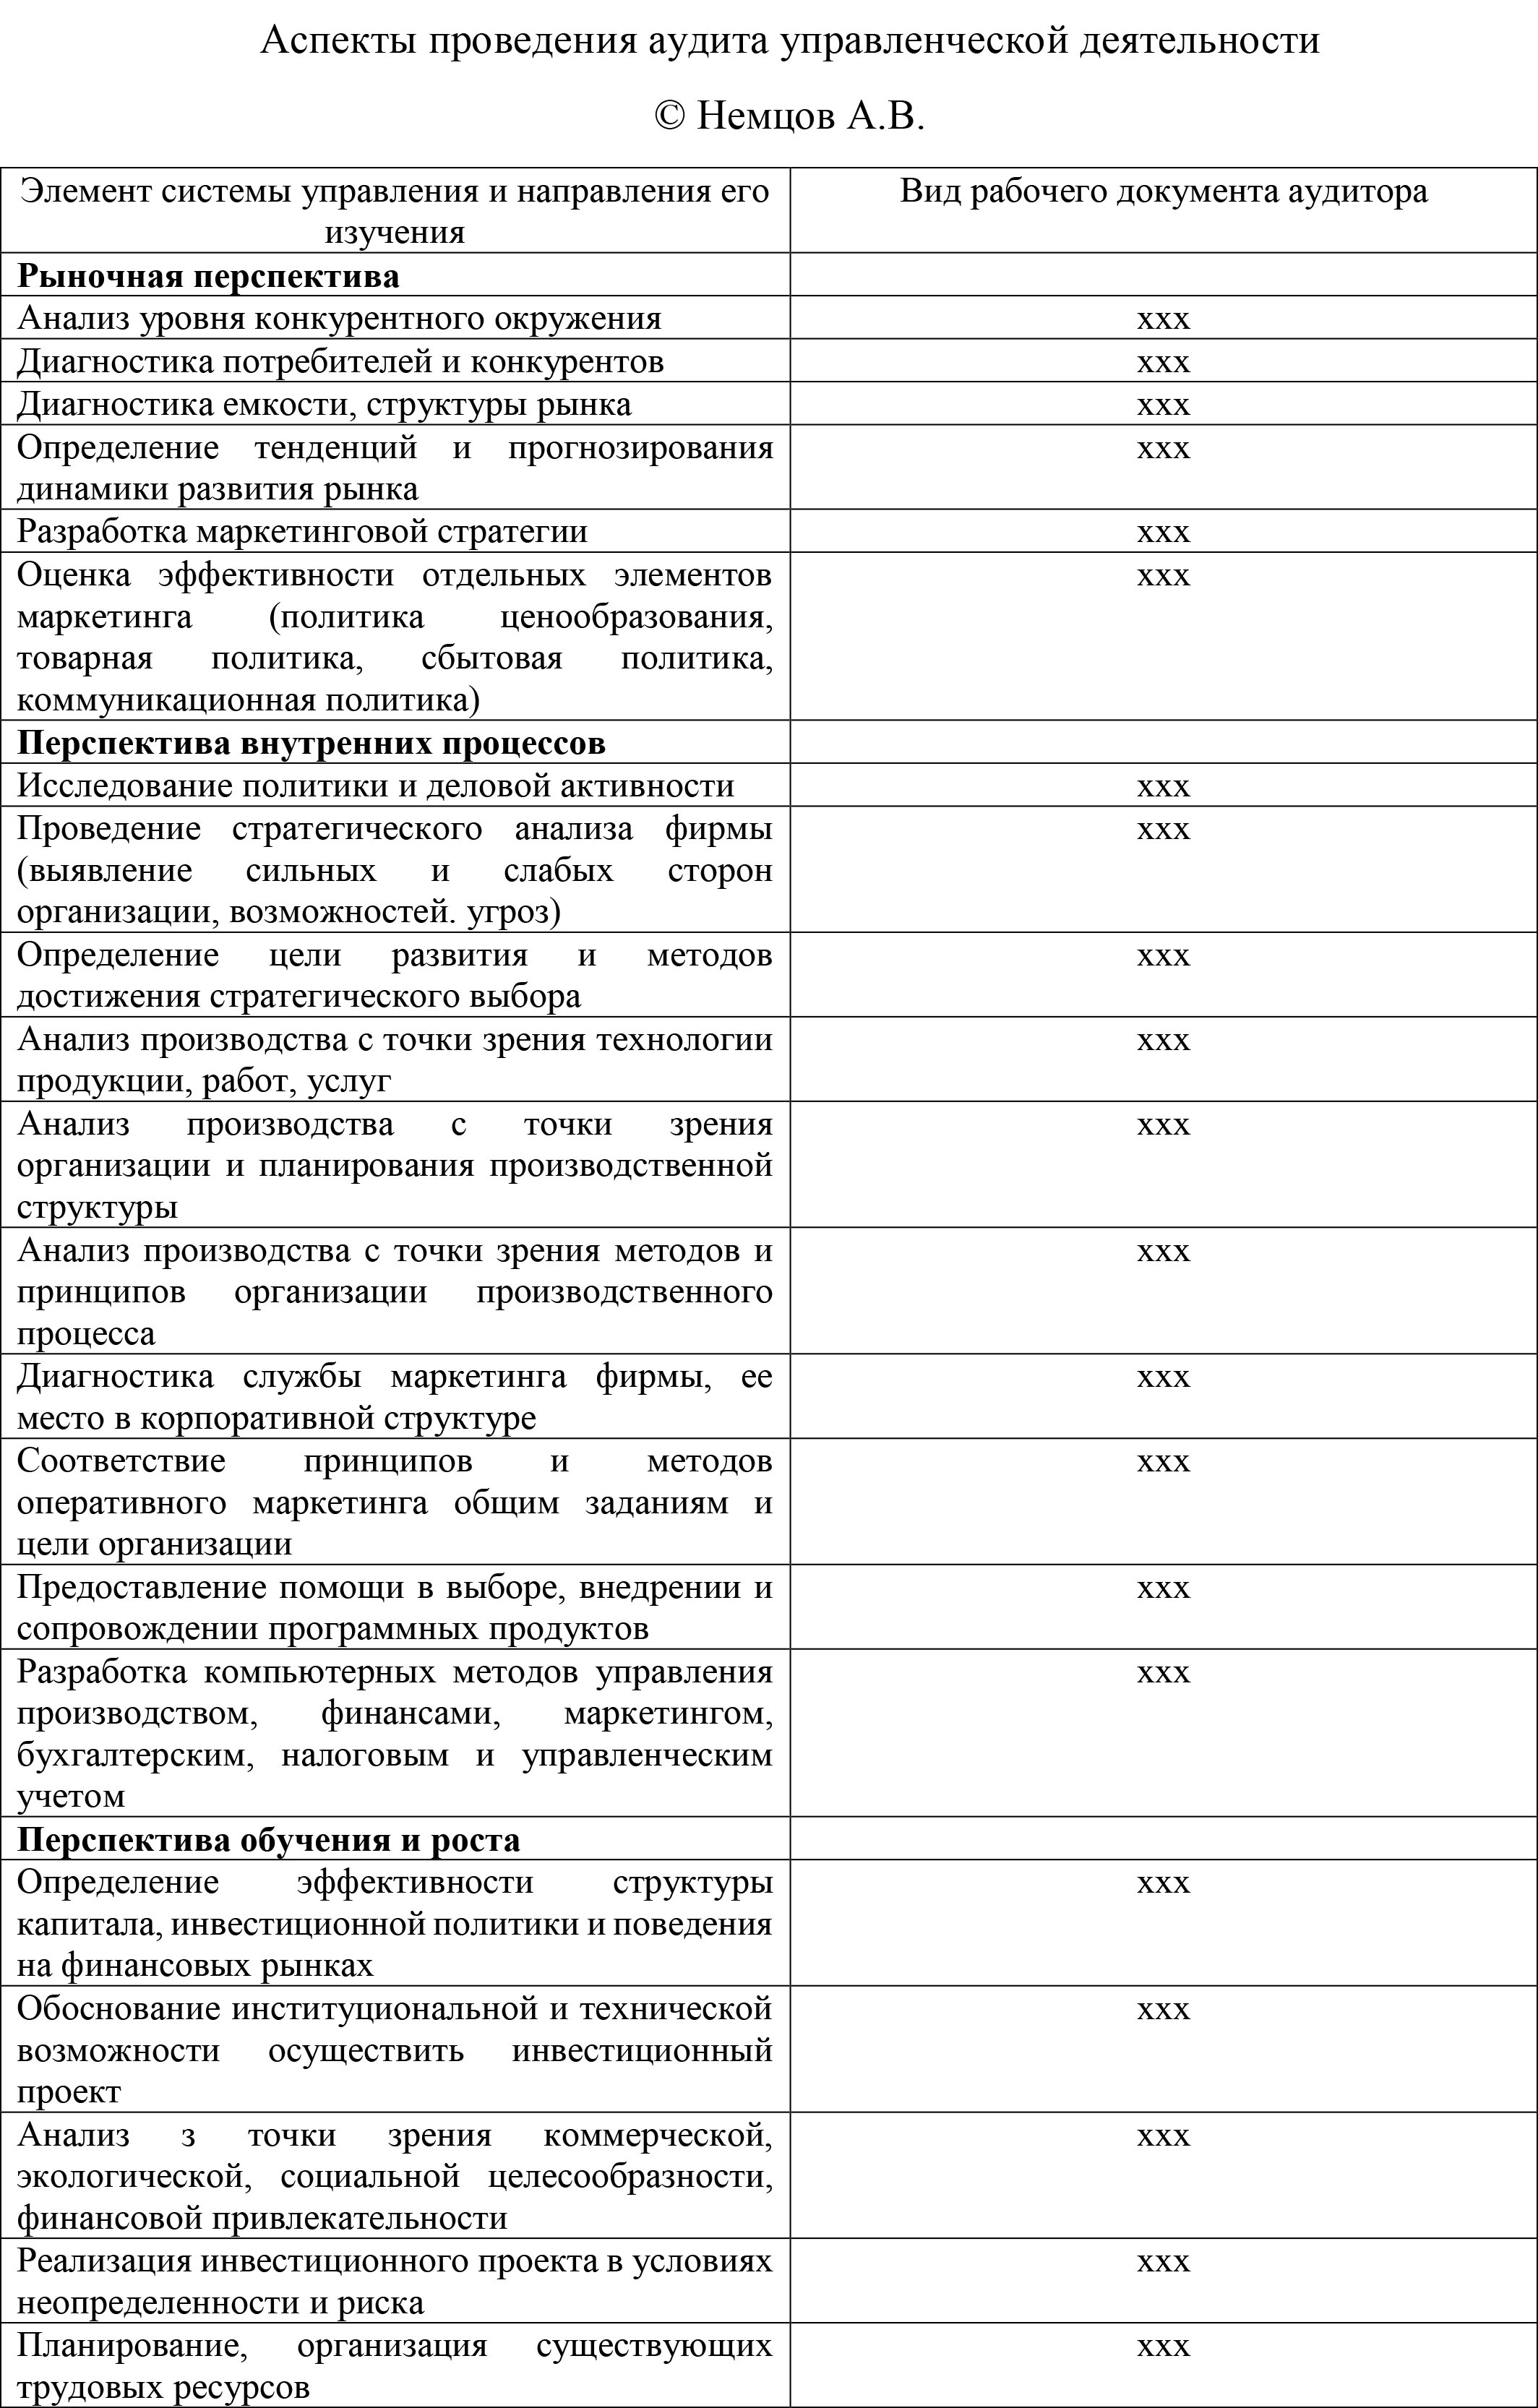
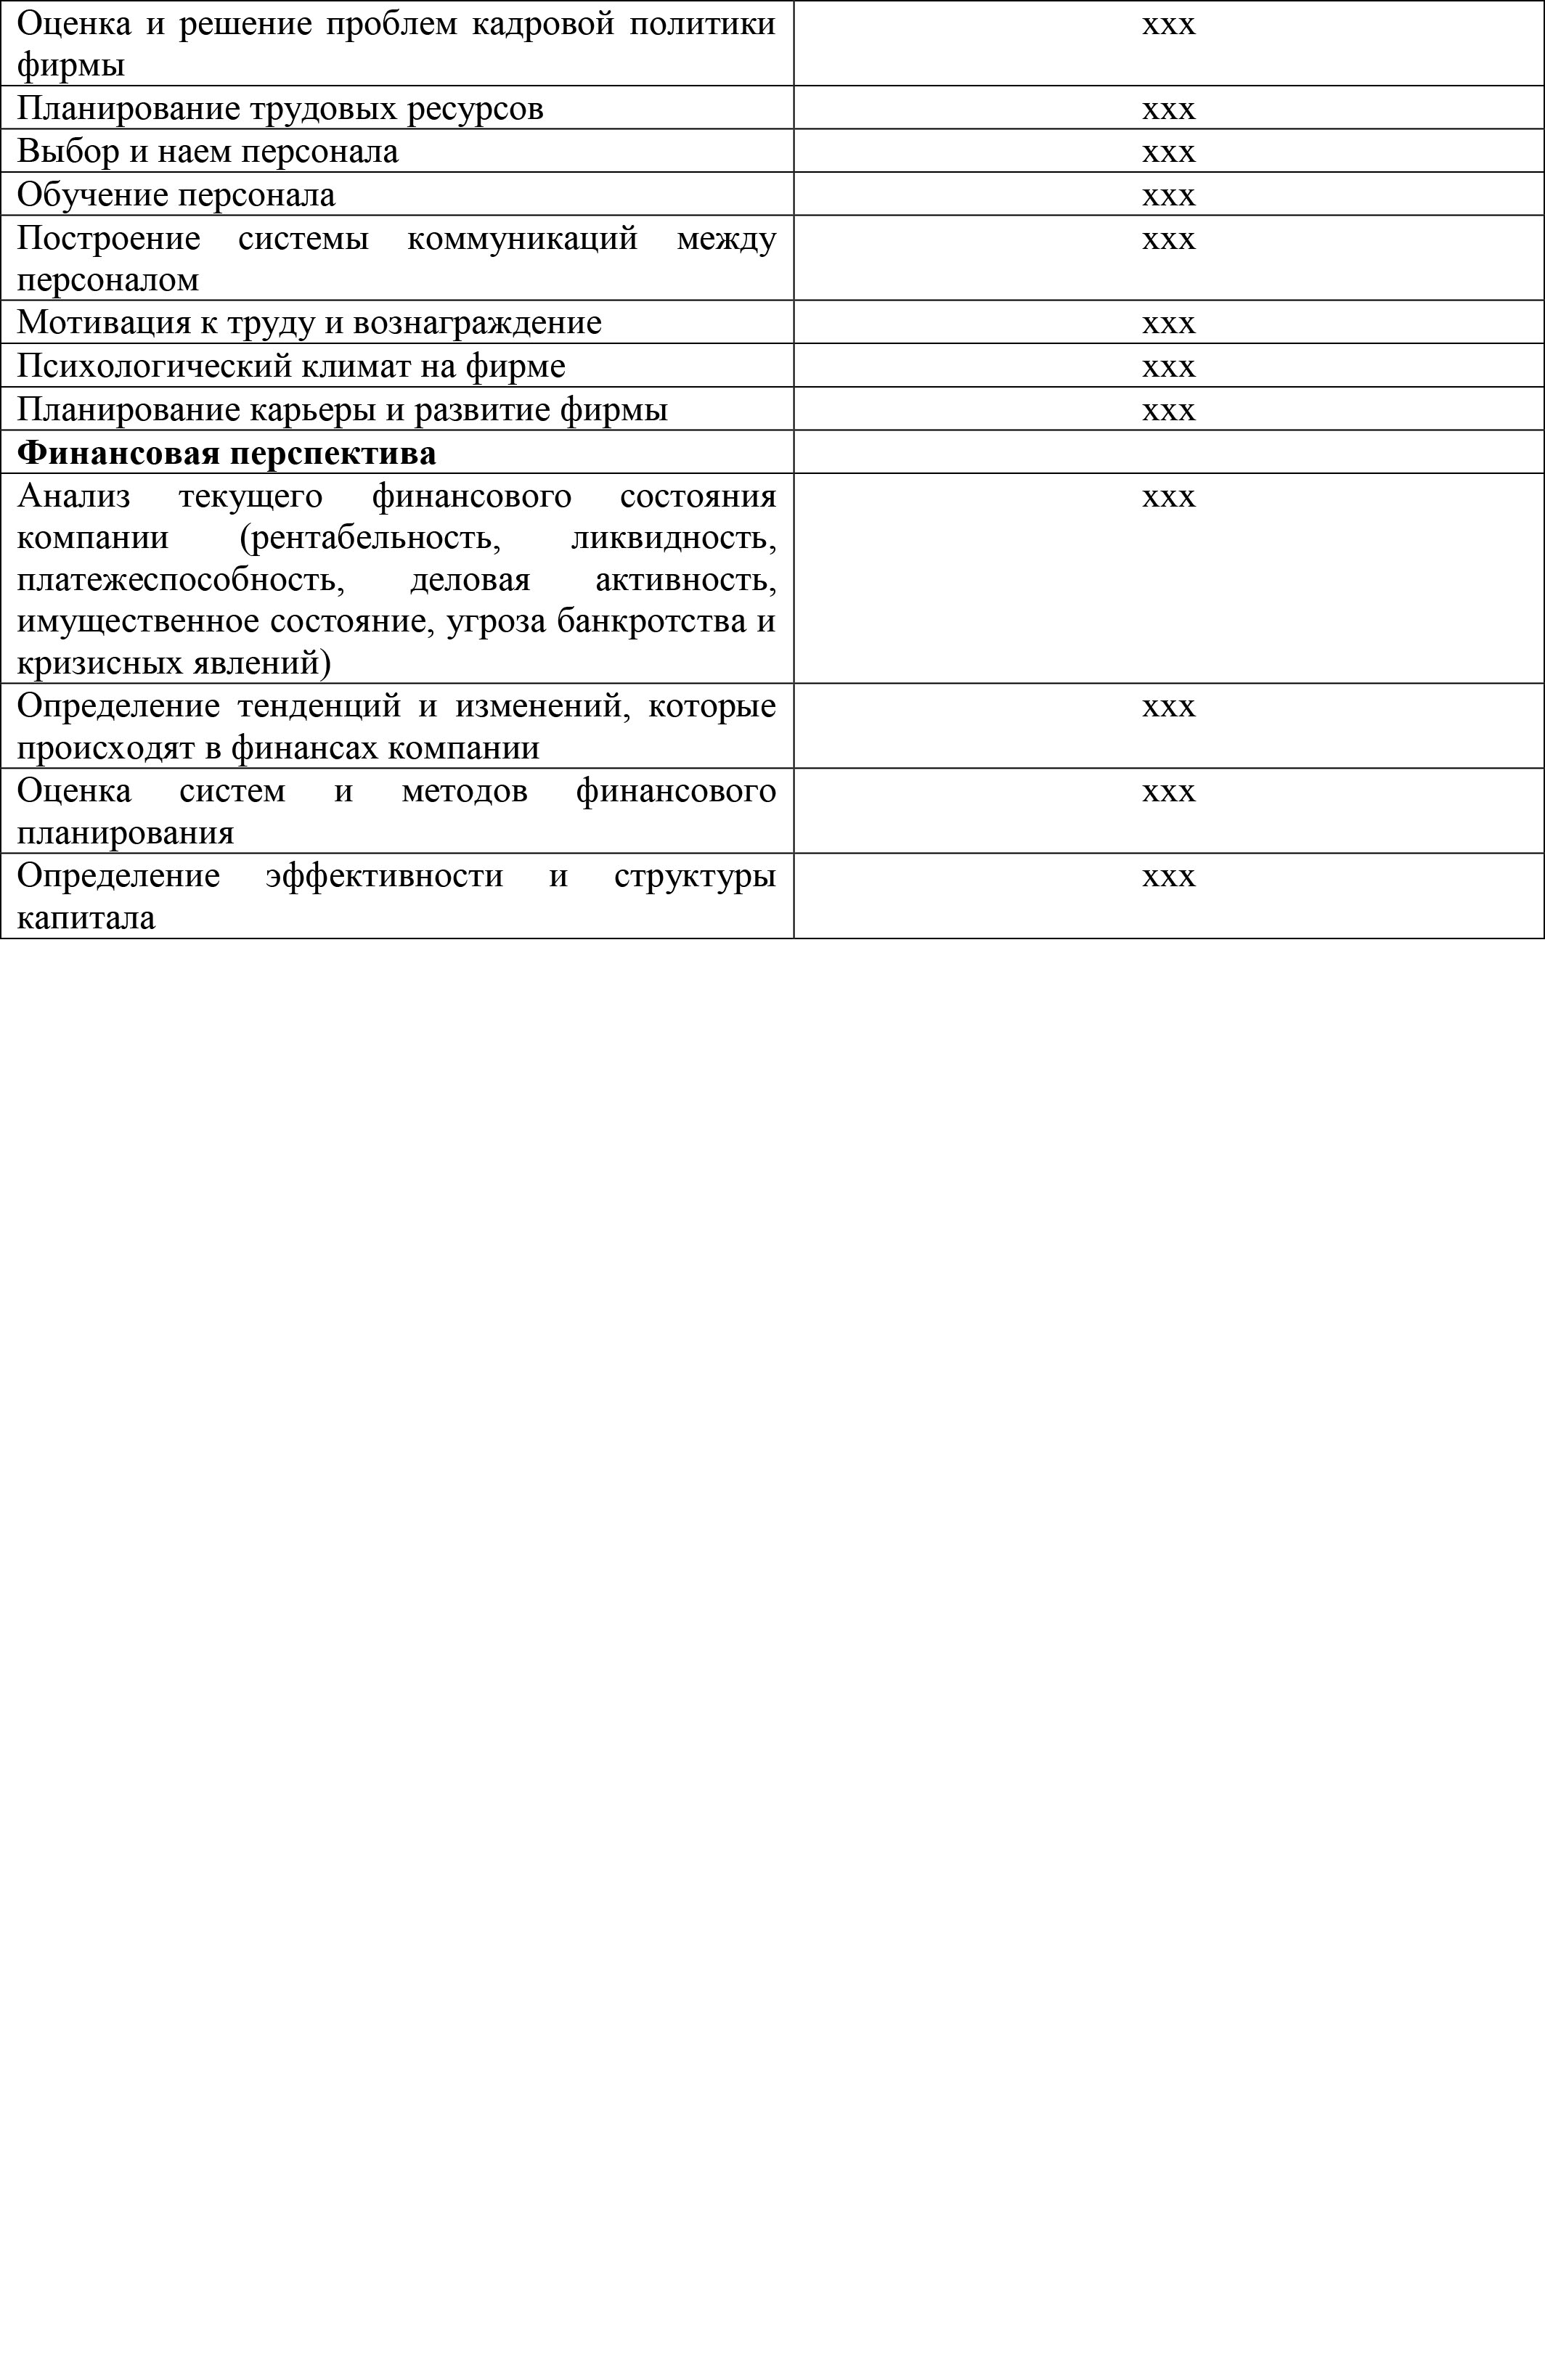
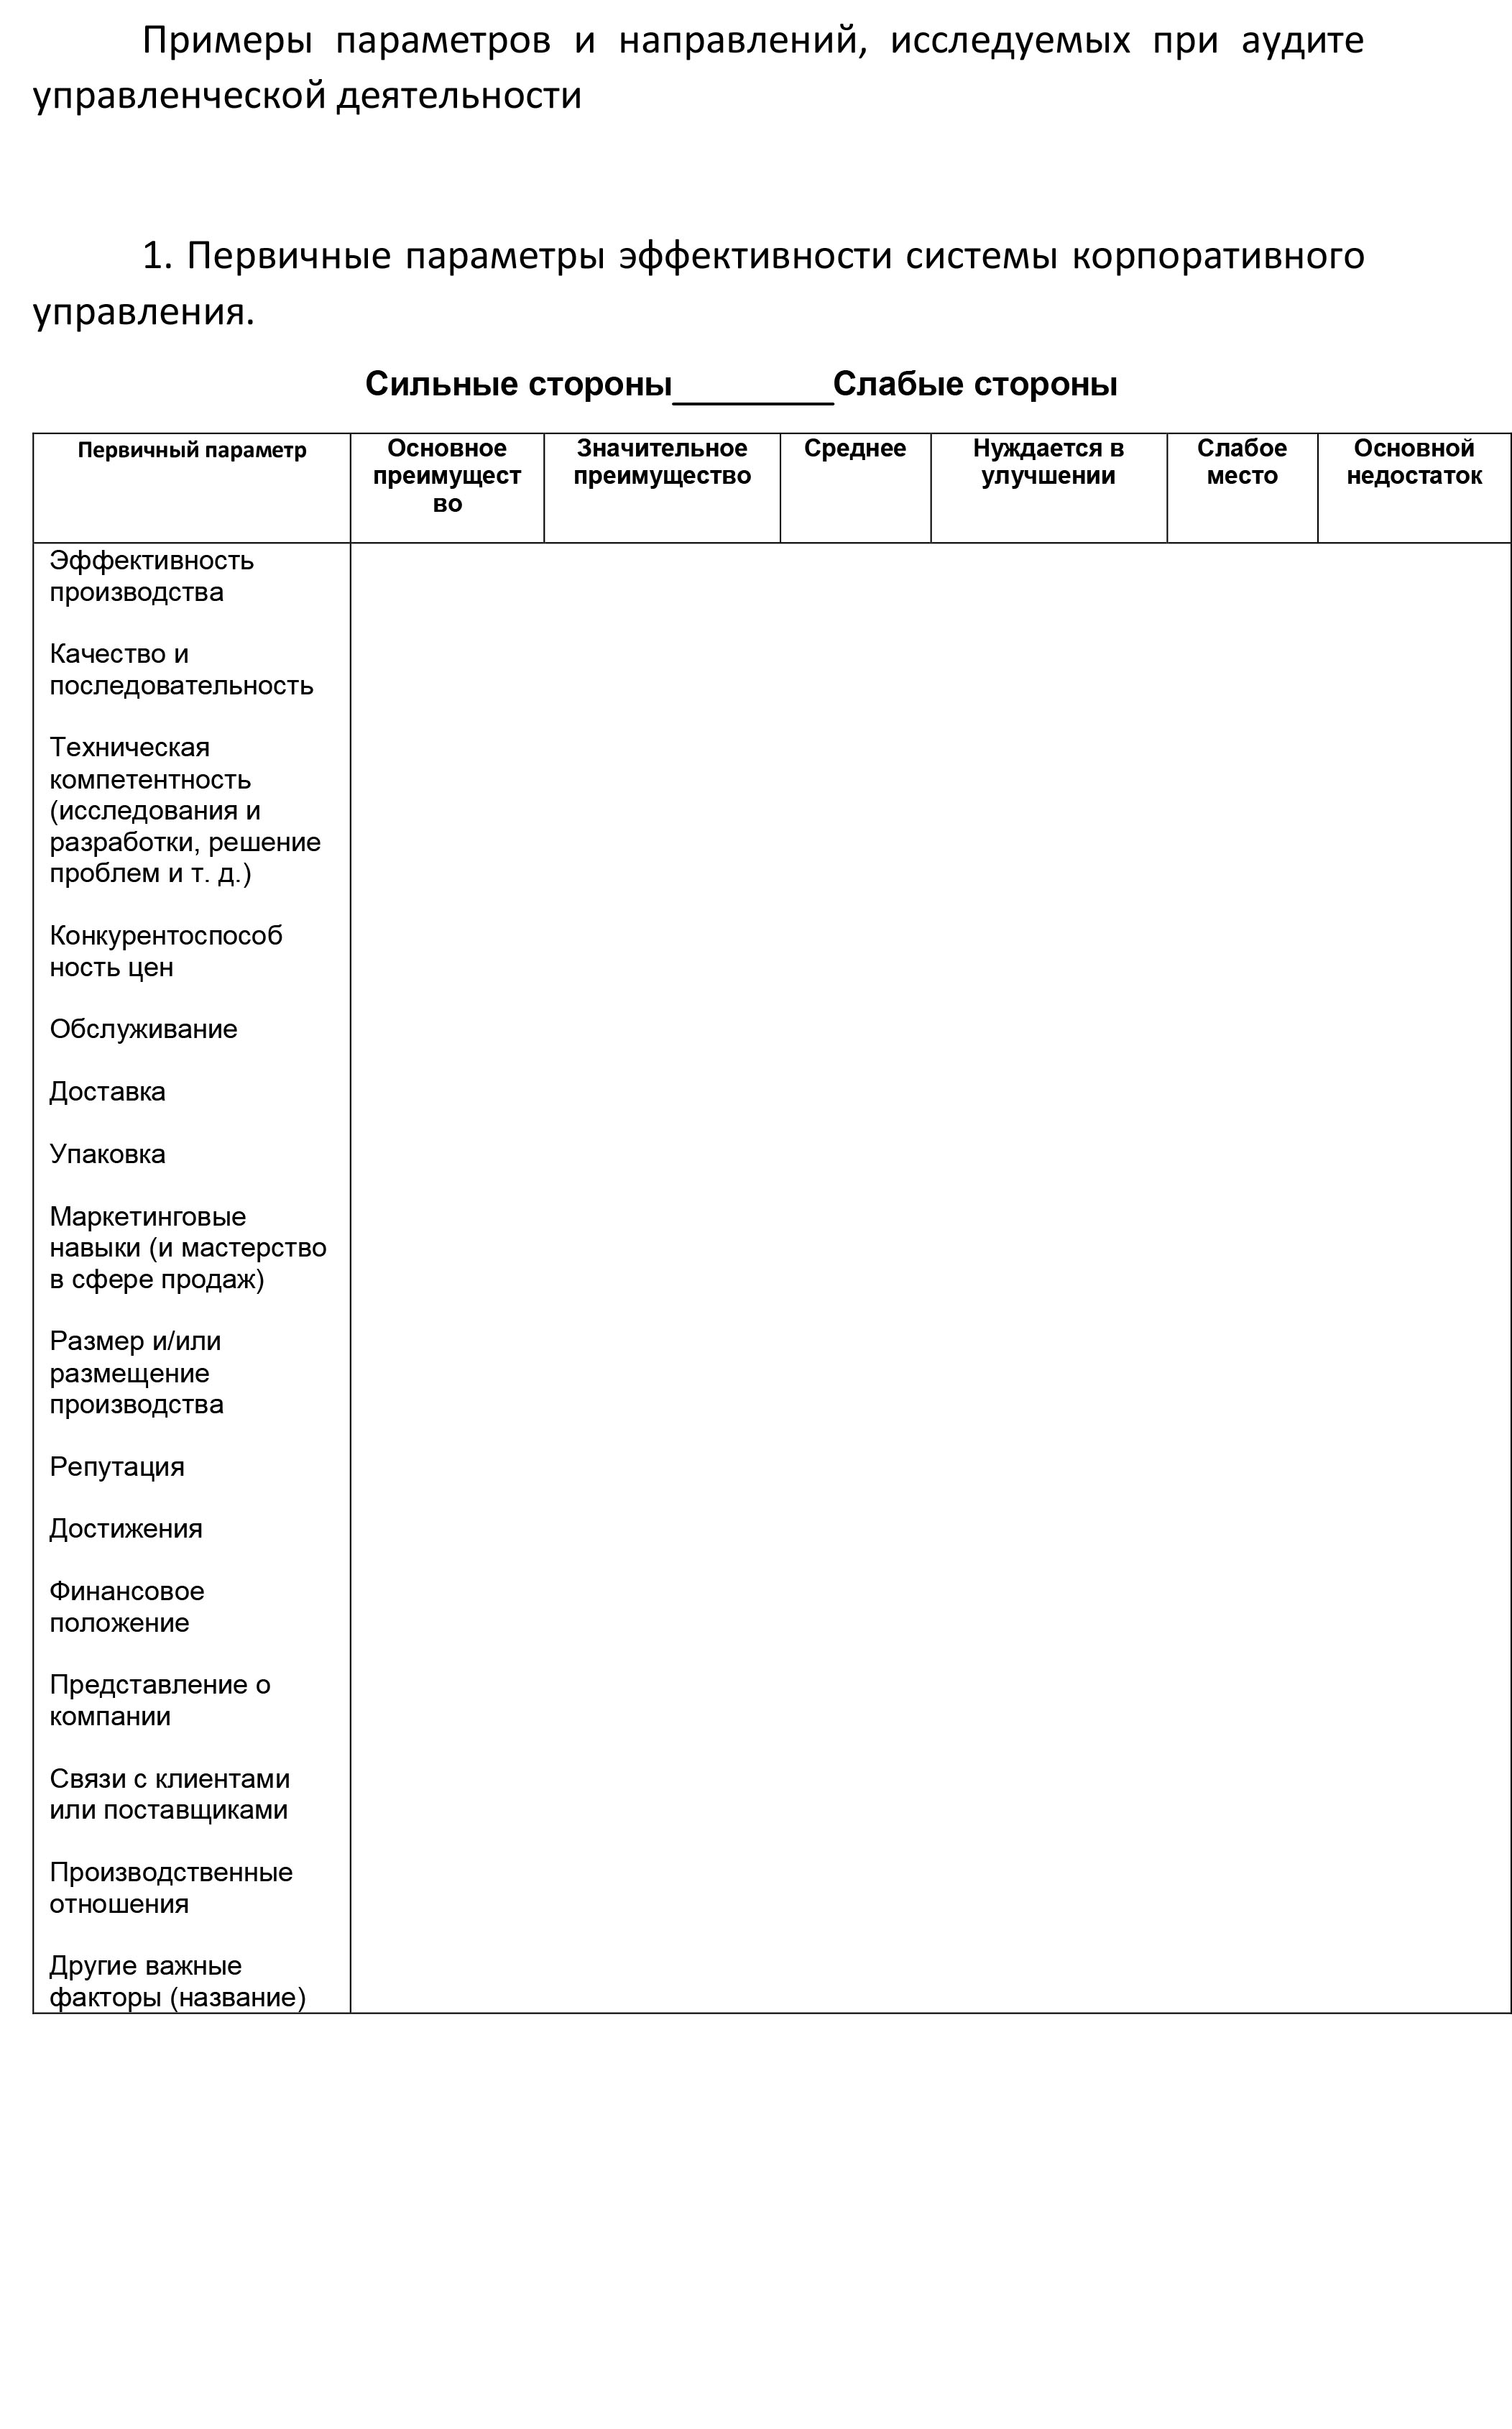
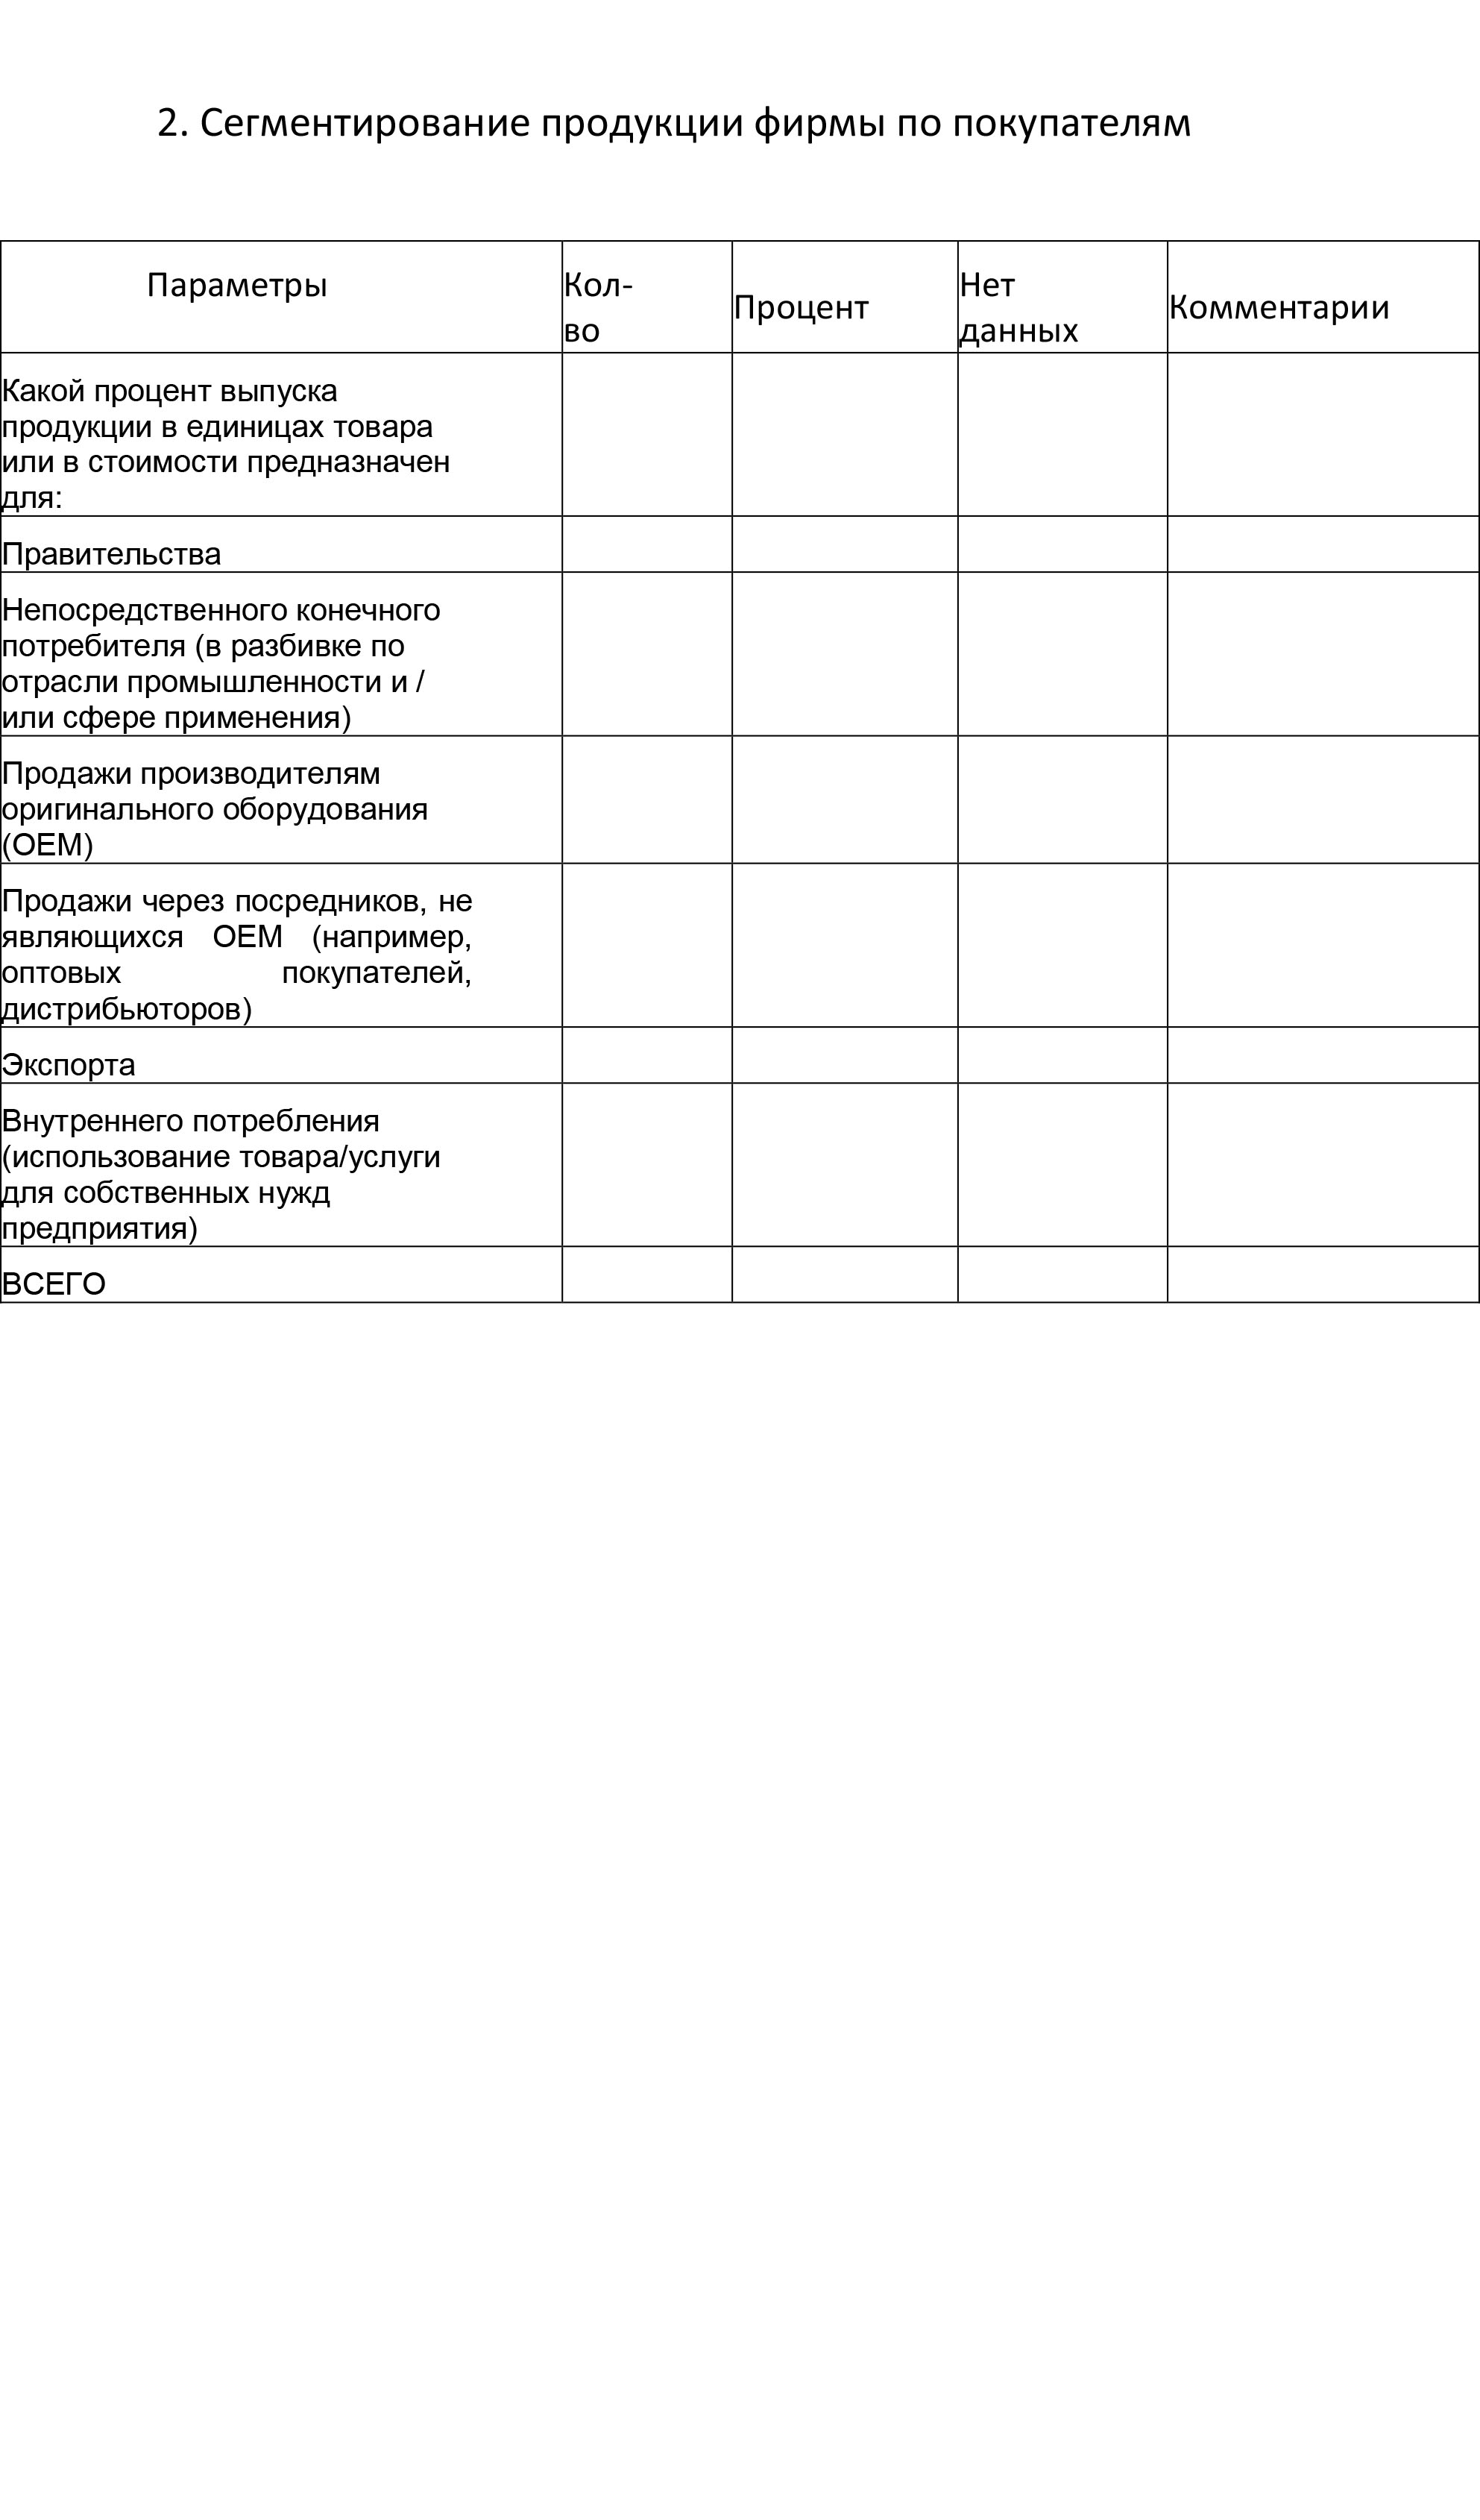

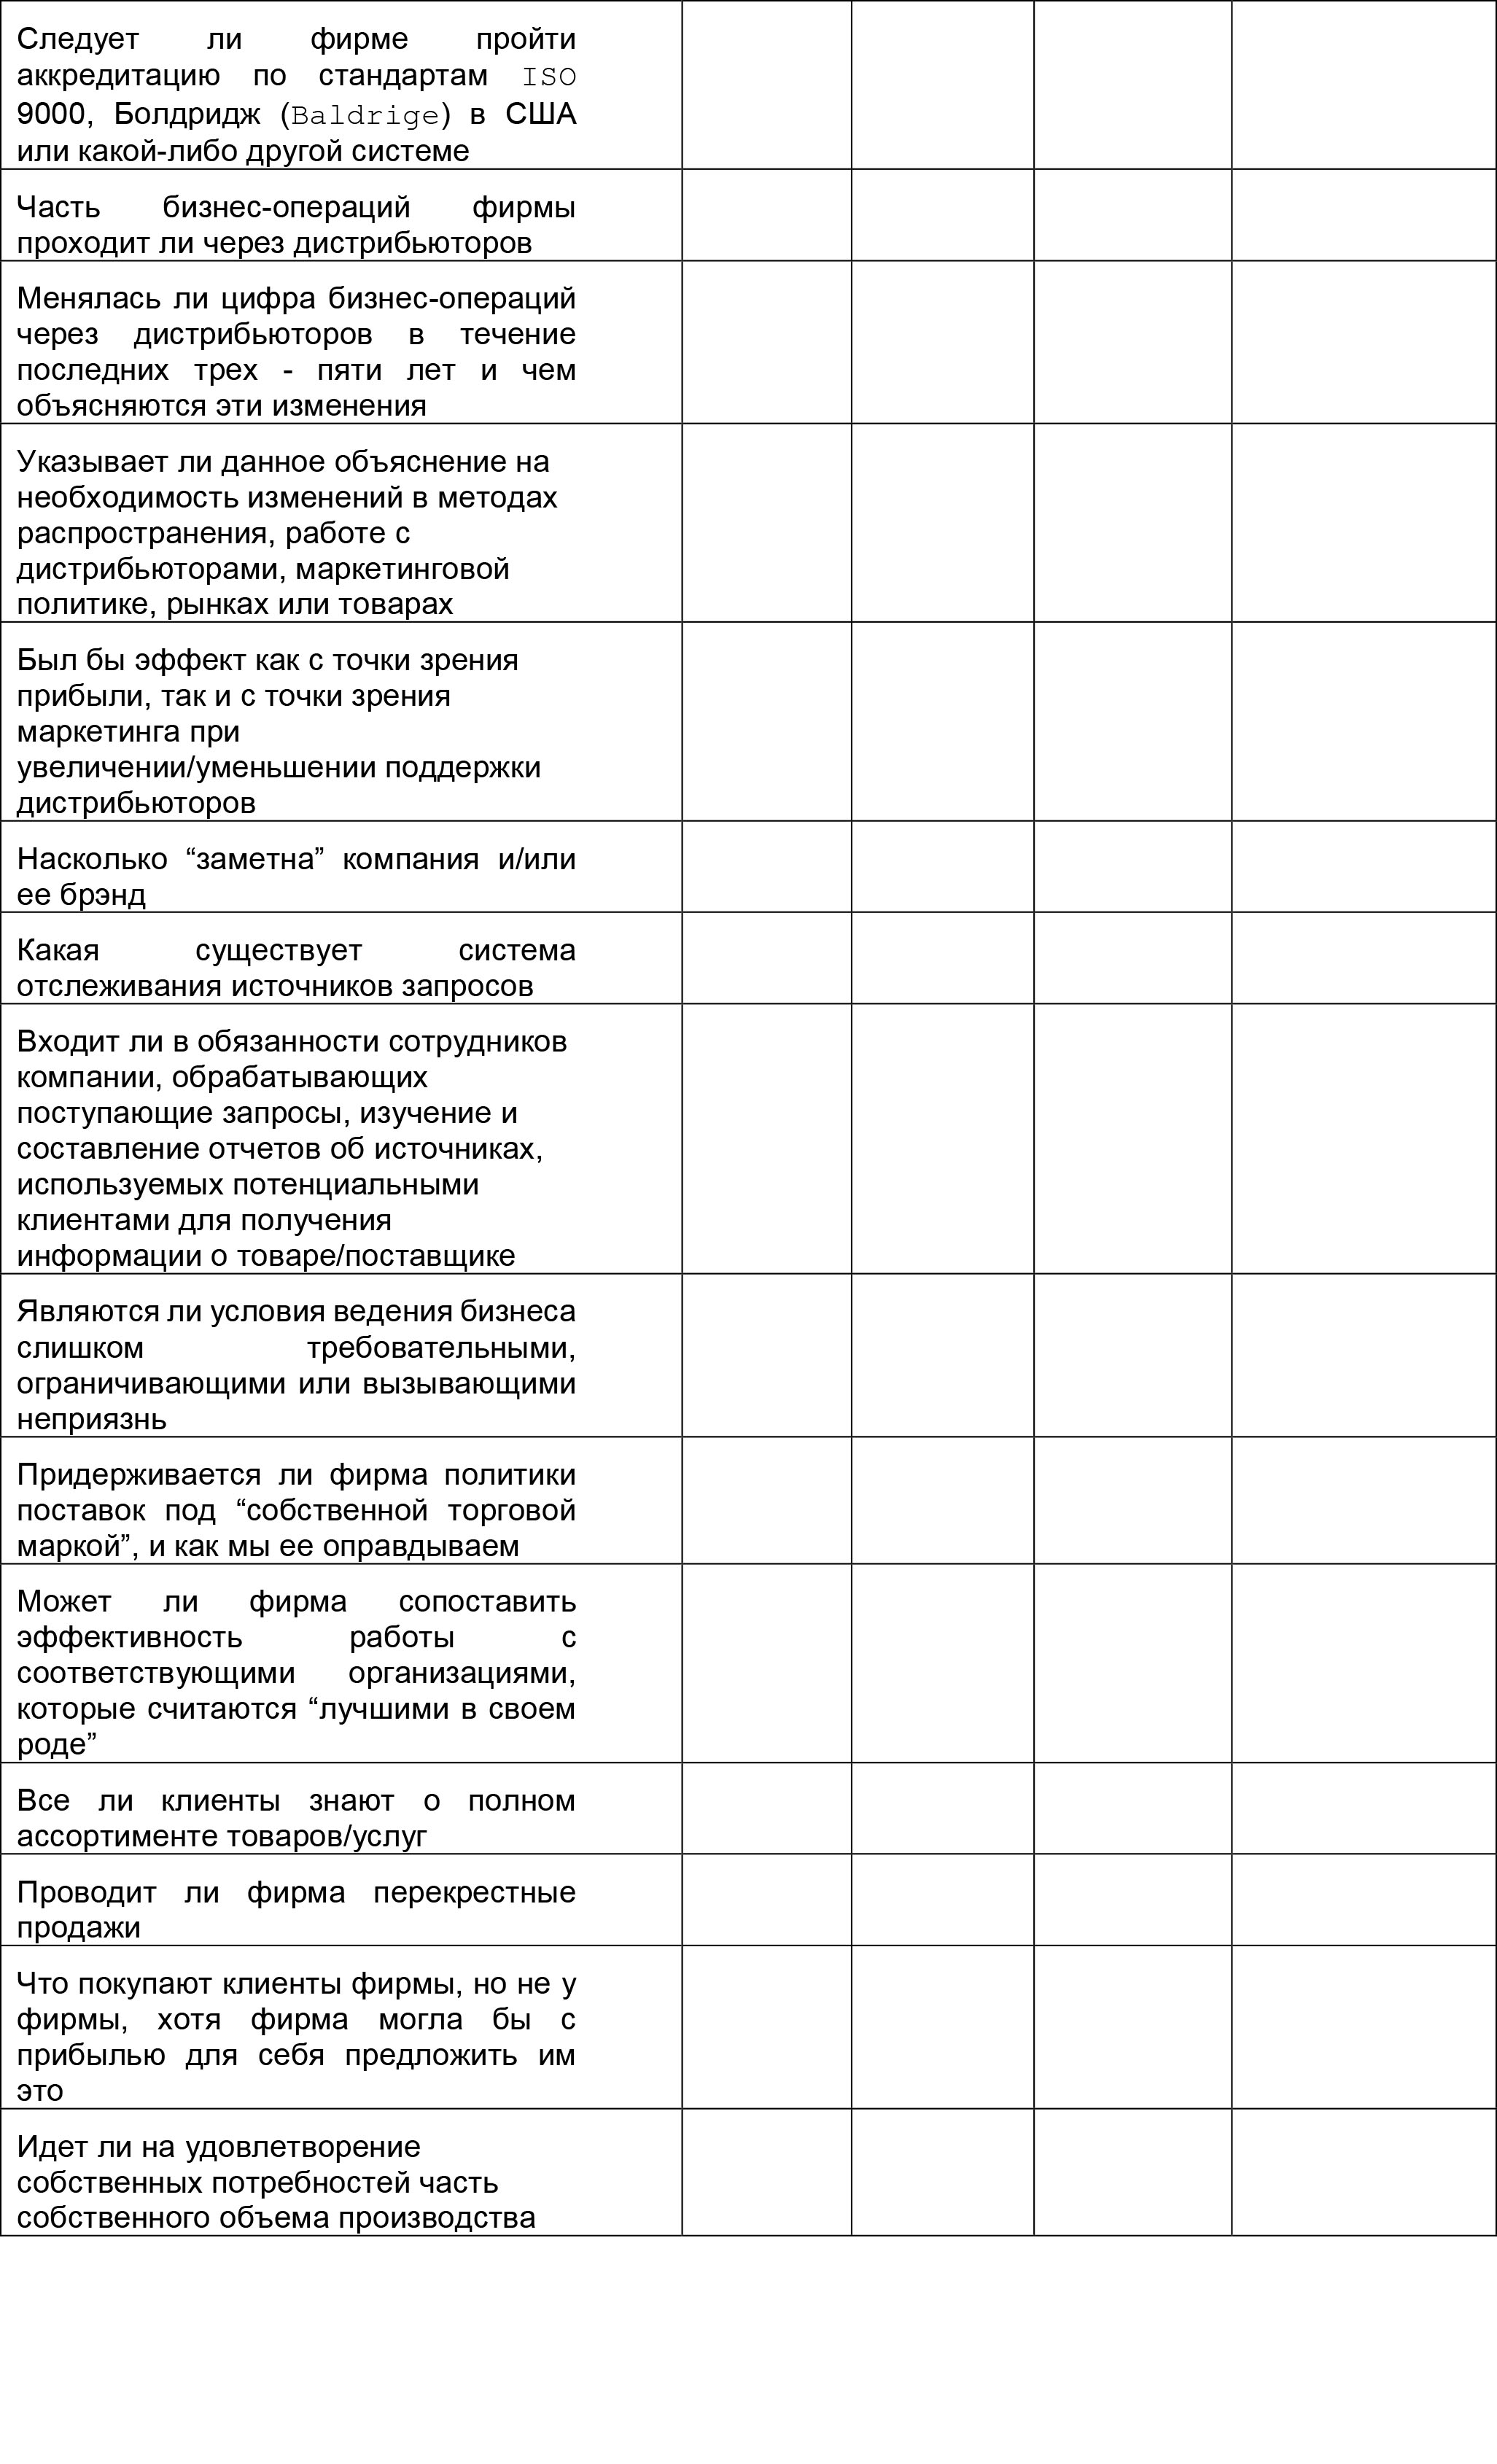

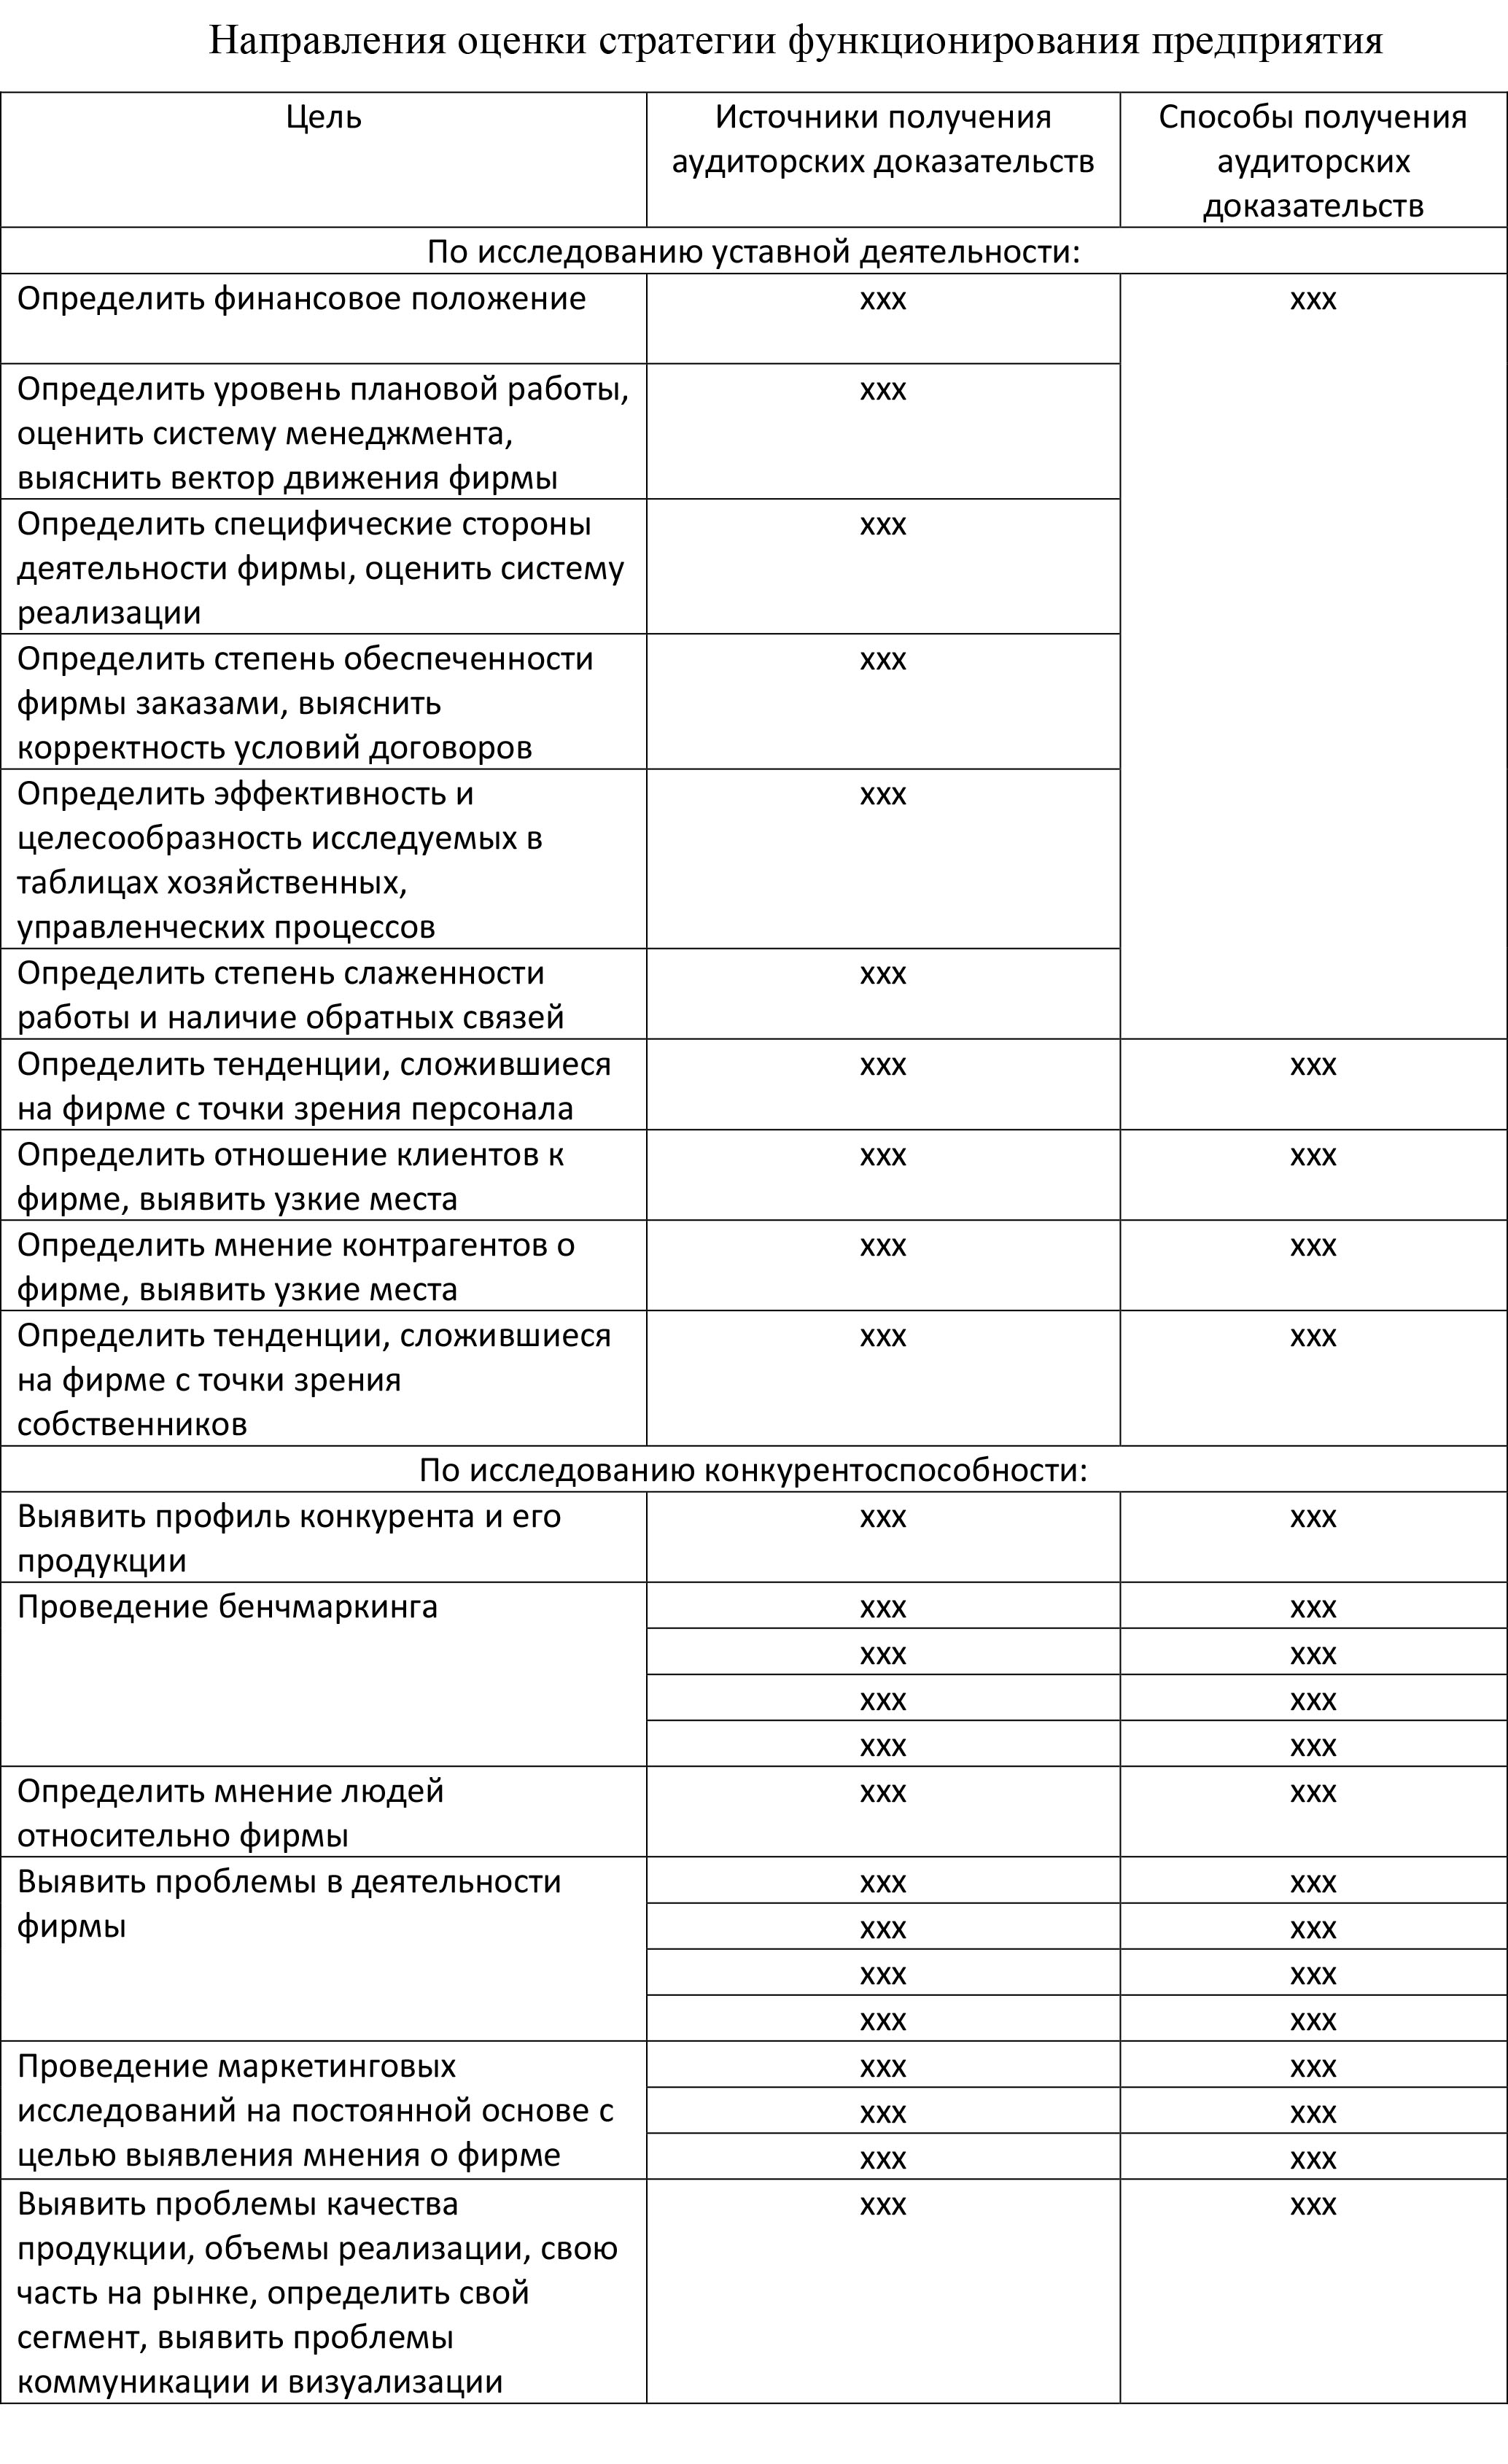
THE ELABORATION OF EXPONENTS FOR THE COORDINATE SYSTEM PLANS AND THE BASIS OF THE SYSTEMATIC APPROACH FOR ITS INTEGRATION ON THE ENTERPRISES OF ENERGETIC
published in 2011. — Effective Economy — 2011 — # 11, © Nemtsov OV
Annotation. We state the In’ve grounded the systematic approach for the forming of the enterprise system plans . This systematic approach is based on the balanced scorecard conception, where we have chosen the list of exponents, and on the functional factor’s method, where we have coordinated its. Keywords : methodical approach to the formation of the system of plans, balanced scorecard, integration of enterprise plans, strategic map, tactical map, operational map, factor functional analysis, mixed multifactorial model.
Formulation of the problem in general.
In many domestic enterprises, planned activities are carried out spontaneously and are not systematic in nature, which adversely affects the performance of the entire enterprise. Mostly different in terms of tasks, functions, time, etc. plans, development programs, various projects, business plans are a set of to some extent different goals, objectives, indicators, completely or partially inconsistent with each other. One of the huge problems that almost every domestic enterprise and a large part of foreign enterprises face is the imbalance, the mismatch between the planning processes, first and foremost by the levels of tasks, namely: strategic, tactical and operational, and thus corresponding mismatch between their products, and strategic — so strategic. and operational plans. So, building an integrated, balanced, a coherent system of plans on the basis of complexity and unity becomes necessary in order that, firstly, the planned decisions will be implemented, and not only on paper, as a tribute to fashion or historical tradition, and secondly, that their implementation will promote the development and increase of well-being of each employee, structural unit and the enterprise as a whole, and did not contribute to the disintegration of the enterprise, when in the short term it becomes possible for an employee or a structural unit to achieve temporary profits, and in the long term this situation leads to the death of the enterprise or at least the shortening of its life cycle.
Analysis of recent research and publications. Among the national authors who dealt with the problems of integrating enterprise plans, building them from the point of view of a certain systematicity and integrity can be called OB. Bad, Yu.I. Lerner, EA Beltyukova, OO Brenevova, VN Parsyaka, IV Smolina, V.S. Rasulova, A.A. Sadekova, OM Kizima. Foreign scientists dealing with this problem are also D. Khan, I. Ansoff, T.M. Babich, E.M. Kuzbozhev. A prominent scientist made a significant contribution to solving this problemR. Akoff, who proposed the introduction of normative planning based on the interactive concept of planning (management), on the integration of strategic, tactical and operational direction of the enterprise. The implementation of such a systematic approach to the creation of enterprise plans correlates most successfully with such a management concept as a system of balanced indicators. The founders of this theory are R. Kaplan, D. Norton, and its following representatives are: N.G. Olve, T. Lagoda, E. Derevyanko, M. Kutrakova, B. Gritsay, I.O. Kuznetsova, L. Aronova, I. Menzebrovsky, K. Redchenko, V.V. Repin, OS Yudintseva, K. Ovcharenko, R. Kashcheev, S. Taran, M.O. Kizim, AA Pilipenko, VA Zinchenko.
The purpose and purpose of the article.Develop a methodological approach based on the concept of a balanced scorecard and factor deterministic method to select and integrate plan indicators into a single system that will allow for rapid and rapid management of changes in these plans, thereby enhancing managerial impact.
Outline of the main research material. The basic logic of the methodical approach to the formation of a plan of plans at the enterprise is contained in the postulates of the degree of integration of a set of plans into a single whole and their interdependent and interdependent structure. Therefore, in order to achieve the challenge we need to solve a twofold problem:
— to select indicators for the plans of the enterprise that most concisely, transparently, by volume characterize the activity of the enterprise, its structural unit or business process;
— relate the selected indicators within each plan and between plans, forming a single system.
Planned targets in today’s conditions are the task of creating a three-dimensional value space, which is based on the events of the past, present and future. The planned indicators should reflect the balance of interests of the owners, staff, consumers, suppliers and other contractors of the enterprise. There must be an appropriate relationship between the mission, core values, strategies, goals, objectives and metrics, and must be defined and maintained at all levels of government. It is possible to implement such multicriteria of target indicators by applying a relatively new concept of performance measurement management — a system of balanced indicators.
However, it should be noted that there is no standard, uniform set of indicators already developed within a balanced scorecard that is the same for any enterprise or organization, even related to the national economy or industry. According to this methodology, the presence of each indicator in a balanced system is determined in accordance with the goals, and these, in turn, are formulated based on the strategy, vision and mission of the enterprise. Thus, each goal and task has a quantitatively stated task that can be measured, compared, analyzed and set differentiated personal responsibility for its achievement.
However, even this technique does not have a uniquely structured structure, since it itself is the product of many years of empirical research, especially by R. Kaplan and D. Norton, as well as many scholars and practitioners. Moreover, this technique is constantly being improved, it is being tested in practice, evolving, and it can be said that it even becomes somewhat individual for each business entity.
We have investigated a number of strategic maps developed in practice at domestic and foreign enterprises, as well as theoretical scientific developments of domestic and foreign scientists, on the basis of which a strategic map was prepared, adapted for a specific enterprise and based on the research objectives.
Therefore, the strategic map of KTM KTM will consist of the following elements: mission, vision, strategies (general or corporate (in business units) and functional), causal relationships between strategies, strategic goals, strategic objectives, strategic indicators , formulas for their calculations, strategic objectives responsible for the indicators. We have also added four perspectives — finance, customers and the market, internal processes, training and growth — another perspective — environmental protection, as we believe that the social aspect of any enterprise is in such a difficult environmental situation, especially a utility company that a priori contains in its activities, a strong social component must be comprehensively researched and managed.
Also, we believe that for any enterprise in general, and KTM KP in particular, it is necessary to supplement the strategic aspect of managing the tactical and operational aspects of it, which should be a continuation of the strategic process, its logical complement and direct implementation. In this regard, we also distinguish relevant to these management processes indicators: strategic, tactical, operational. Such gradation of indicators is occasionally proclaimed by scholars and practitioners, such as K. Redchenko [14], M. Kizim, A. Pylypenko, V. Zinchenko [15], managers of the firm Handleman [11], but we do not have a clear interpretation of their content. below we understand these categories based on the needs and specifics of our research.
The distribution of indicators on strategic, tactical and operational is connected with similar distribution of plans of the enterprise, and therefore logic of difference of these indicators proceeds, first of all, from logic of difference of plans. Strategic plans are designed to determine the main trajectory of enterprise development, and therefore the strategic indicators are global, more aggregate in nature, and the developer and user of these indicators is mainly senior management. Operational plans are designed to ensure the smooth, clear and balanced operation of the enterprise, so operational indicators are more detailed and varied, as they must provide the downstream management and direct contractor with clear information on the types and amounts of work they are required to perform. Tactical plans are like a bridge between strategic and operational plans, designed to balance an enterprise’s resources for ongoing operations and development, so tactical indicators should also be operationally detailed and diversified, and their developers and consumers are, for the most part, the middle management and functional service staff. Their main difference from the operative is the time lag, that is, tactical indicators have a longer shelf life (mostly up to a year) than operational ones (mostly up to a month).
Therefore, it will be absolutely legitimate to select tactical and operational indicators in accordance with tactical and operational goals and objectives by analogy with strategic indicators. It is also necessary to introduce, by analogy with the strategic map, such concepts as the tactical and operational map of the enterprise, where all these elements of the tactical and operational management process will be displayed.
Tactical and operational maps of KP «HTM» should be composed according to the following elements: tactical goals, objectives, indicators, unit of measurement of these indicators, operational goals, tasks, indicators, unit of measurement of these indicators.
There is a systemic link between strategic, tactical and operational maps, which is expressed in that strategic goals, objectives and indicators are linked through tactical goals, objectives and indicators with operational ones, which forms a hierarchical tree horizontally, vertically, level of tasks, aggregation responsible for the metrics. Therefore, we have approached the task of interconnecting selected indicators within each plan and between plans, forming a single system.
A system of enterprise plans is made up of a number of plans that are formed in accordance with the identified cost and revenue centers in the process of strategic, tactical and operational planning. Cost and revenue center means the place where costs and revenue are generated in connection with the production, other operating, investment and financial activities of structural units, responsible persons or functional services of the enterprise acting on the basis of self-assessment and certain independence, and the call to provide control the implementation of planned expenditures or the receipt of planned revenues, are responsible for this and have certain rights and obligations for this purpose, as well as motivated by them optimization.
At KTM enterprise, we have identified both self-financing centers, which are structural units, and analytical centers, which provide details of responsibility for individual expenses or revenues and in our case are business processes and functional areas of activity of the enterprise. Our responsibility centers of the KTM KP enterprise create the basis for the introduction of a decentralized form of management, under which most current management decisions are made at lower levels of management. At the same time, the management activity of the central enterprise is realized through coordination of decisions of structural divisions of the enterprise with the data of functional directions of activity of the enterprise and the data of calculations of business processes of the enterprise, for which committees are formed of representatives of management at all levels,
Based on the above characteristics for the system of plans of the enterprise we have identified the following plans of the enterprise:
1) For the enterprise as a whole:
1.1) A strategic plan consisting of some functional areas;
1.2) Tactical functional plans: financial, cost and profit, marketing, sales, procurement, production, capacity, technical and organizational development, investment, personnel, environmental protection;
1.3) Functional operational plans: financial, cost and profit, marketing, sales, procurement, production, capacity, technical and organizational development, investment, personnel, environmental protection;
2) For structural divisions of the enterprise:
2.1) Strategic plan consisting of some functional areas;
2.2) Tactical functional plans: financial, cost and profit, marketing, sales, procurement, production, capacity, technical and organizational development, investment, personnel, environmental protection;
2.3) Operational functional plans: financial, cost and profit, marketing, sales, procurement, production, capacity, technical and organizational development, investment, personnel, environmental protection;
3) For business processes of the enterprise:
3.1) Costing for heat supply;
3.2) Calculation of hot water supply;
3.3) Calculation of thermal energy transportation;
3.4) Calculation of cold water pumping;
3.5) Costing for the maintenance of internal house networks;
3.6) Calculation of the implementation of the CACS services;
3.7) Costing of other services of the enterprise.
Therefore, the relationship between the financial and non-financial indicators of the strategic, tactical and operational level can be established in accordance with the opinion of M.O. Kizima, A.A. Pylypenko, VA Zinchenko [15, P.57] and S. Taran [16] using factor analysis, and in the presence of statistics on these indicators — on the basis of regression equations or using the neural network apparatus. Based on the needs of our research, we consider it necessary to establish relationships between indicators based on the creation of factor models.
We made this decision based on the following aspects. First, it is completely consistent with the essence of our concept of balanced indicators, because when linking the resultant and formative indicator of any functional direction, logical methods are used, which allows us to investigate the real cause and effect relationship between the indicators. Secondly, statistics reflect retrospective information, that is, it is not a fact that quantitative proportions of relationships between indicators in the next period will replicate trends that have been established in the previous period, moreover, this is non-progressive and does not correspond to our chosen interactive form of planning . In our view, statistical methods in this case can only be used to determine whether or not there is a correlation between indicators, and to express the quantitative characteristics of such a connection, managers should, based on the elementary logic of thinking and goals, the tasks that confront them. Third, some statistics are missing or heterogeneous. Fourth, the adequacy, reality and impartiality of the statistics themselves is a significant impediment to the use of statistical methods.
Factor analysis, in the part of conducting such a kind of stochastic factor analysis, also uses statistical data, however we will use deterministic factor analysis in our study. The essence of the latter is contained in «the study of the influence of factors, the relationship of which with the resultant indicator is functional in nature, that is, when the resultant factor model is represented as a product, division or algebraic sum of factors» [6].
As the strategic, tactical and operational indicators that we will apply in planning coincide across the enterprise, its structural units and business processes, the factor-based interconnection models built for the enterprise will conceptually be appropriate for its structural units. Because we need to relate many metrics different in aggregation, detail and purpose, we will form a mixed multifactorial model.
Based on the above, we will build five mixed multifactorial models that fit our strategic, tactical and operational map perspectives:
1) a financial performance model (Fig. 1), which will reflect the relationship between the strategic indicator (asset return) summarizing the financial performance group and the tactical indicators of the financial plan, cost and profit plan and partly the personnel plan;
2) a model of market position indicators (Fig. 2), which will show the relationship between the aggregate by market group of indicators of strategic position (share of the market of enterprise services) and the tactical indicators of the marketing plan and sales plan;
3) a model of internal process indicators (Fig. 3), which will represent the relationship between the strategic indicator (output of enterprise services) summarized by a group of internal process indicators and the tactical indicators of production, capacity and procurement plans;
4) a model of indicators of training and growth (Fig. 4), which will reflect the relationship between the aggregate by group of indicators of training and growth strategic indicator (efficiency of organizational and technical development of the enterprise) and tactical indicators of plans for technical and organizational development, personnel and investments ;
5) a model of environmental indicators (Fig. 5), which will show the relationship between the strategic indicator of the prospect of environmental protection (effectiveness of environmental measures) and the tactical indicators of the environmental plan.
An explanation of the use of the proposed mixed multifactor models will be given below after each such model.
Figure 1 presents the factor model of the relationship between financial strategic and tactical indicators.
In the model of financial indicators under the capital of the enterprise we will consider the liabilities of the enterprise, since it is more necessary to control the indicators such as accounts payable, equity and attracted funds, debt to state and non-governmental trust funds, and more in line with the indicators presented in sections 2 and 3 of the financial plan .
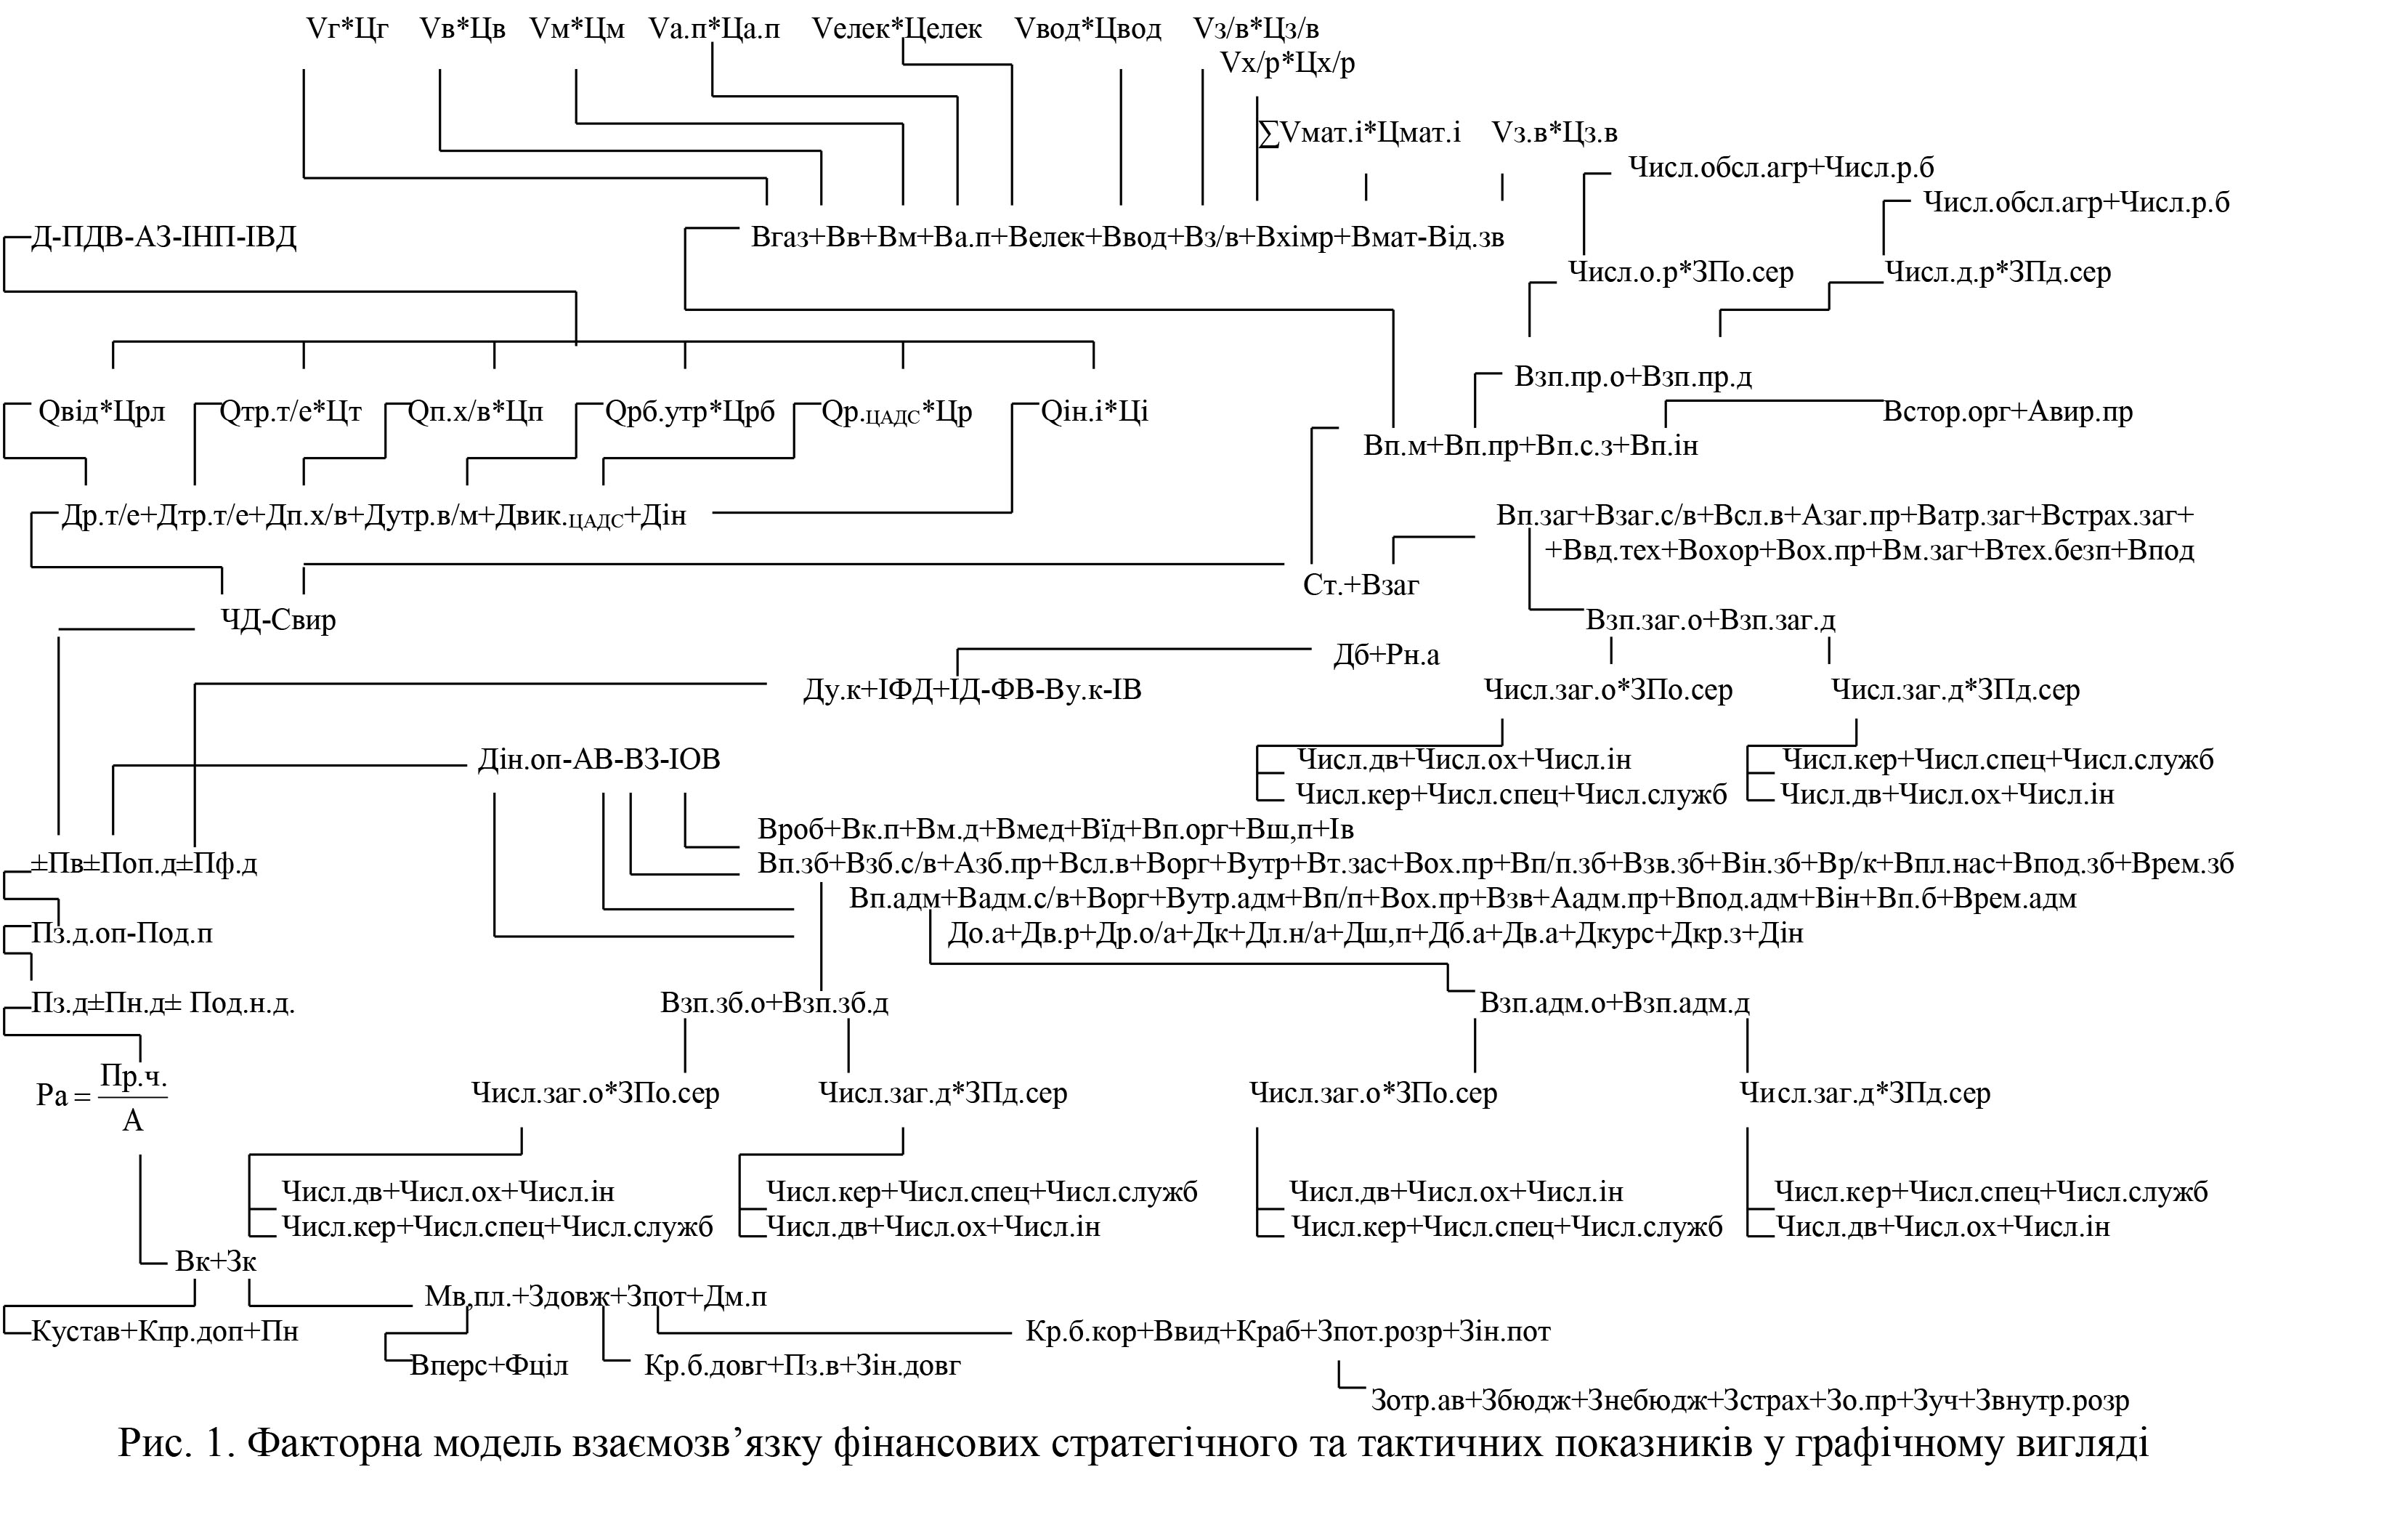
We also take into account that along with the preparation of plans and part of the forecast balance sheet — liabilities — the other part of the forecast balance sheet will be uniquely formed — assets that will take into account changes that occurred in liabilities.
The financial performance model will be applied across all organizational units of the enterprise, but with some changes in the completeness of its performance. Thus, only in the management unit are formed indicators of income and expenses, not related to production activities and profit sharing indicators, and in the department of centralized accounting — indicators that reflect the calculation of the enterprise with state trust funds. In all divisions related to production activity, gross profit and production cost indicators are used, which are respectively indicated in the numerator and the denominator of the resultant profitability indicator. The profitability indicator itself is no longer a return on capital but a return on services. All divisions of administrative services of the enterprise which are not connected with production activity,
Figure 2 shows the factor model of the relationship between strategic and tactical indicators of market position.
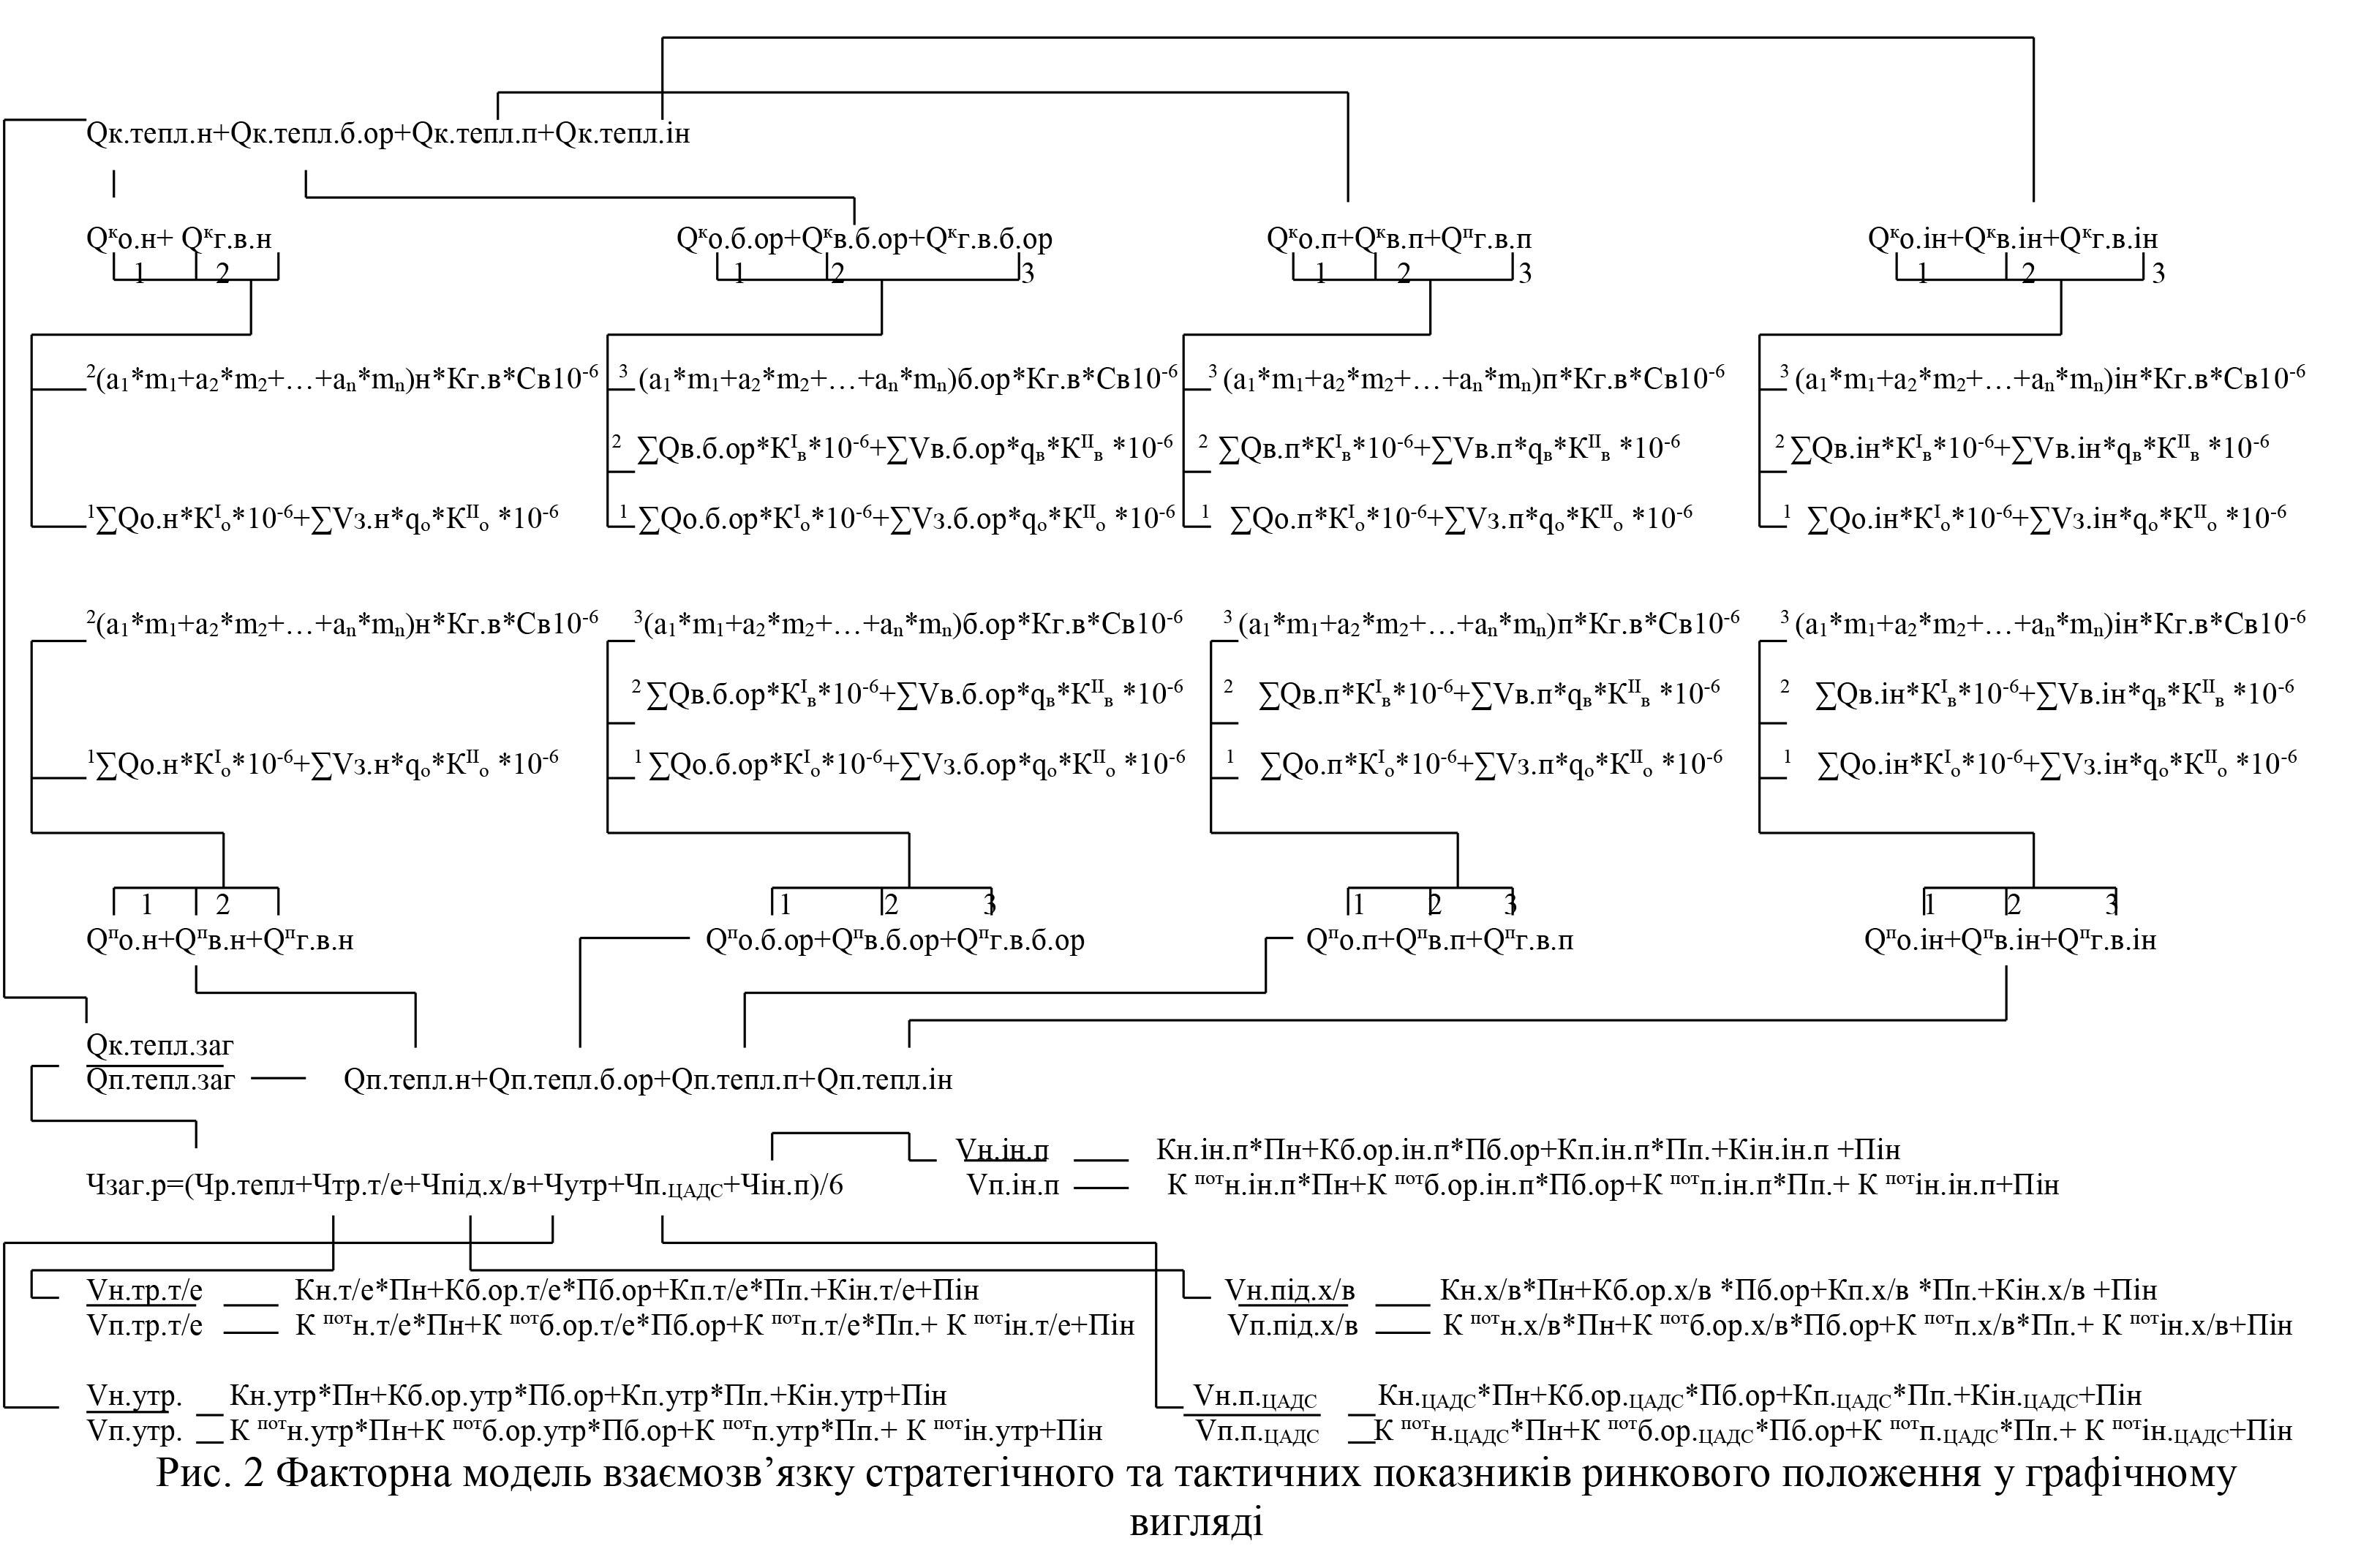
The model of market indicators includes the notion of market share by types of services of the enterprise, namely realization, transportation of heat energy, pumping of cold water, maintenance of internal house networks, performance of works of the CACS, performance of other services. This total market share for all services is the arithmetic mean of the above shares.
Since the market for these services is specific and monopolized, although there is a tendency for the market to transition to an oligopolistic one, the concept of market shares is specific. Under the available sales volumes, heat transport, maintenance of internal house networks, execution of the CACS works, we understand the amount of these services provided to all households and economic entities with which the contract for the provision of such services or they (households, entities) management) have not submitted an official application to discontinue using these services. By the available volumes of cold water pumping, performance of other services we mean the amount of these services provided only to those households and economic entities with which the contract for the provision of such services is concluded. Potentially possible volumes of services of realization, transportation of heat energy, maintenance of internal house networks, performance of works of CACS are in our understanding such volumes, which may be required by all households and economic entities of Kharkiv and adjoining suburban territories, regardless of connection to the connection. capacity of networks. Potentially possible volume of cold water pumping is defined by us as the maximum volume required by the enterprise of KP VTP «Water». In the future, by exploring the technical possibilities of providing such a service to other households and economic entities, it is possible to broaden the concept of the market for this service. The potential scope for other services of an enterprise is determined on the basis of their type and specificity, and is justified in each case. transportation of thermal energy, maintenance of internal house networks, performance of works of CACS are in our understanding such volumes, which may be required by all households and economic entities of Kharkiv and adjacent suburban territories, regardless of connection to the capacity of the networks. Potentially possible volume of cold water pumping is defined by us as the maximum volume required by the enterprise of KP VTP «Water». In the future, by exploring the technical possibilities of providing such a service to other households and economic entities, it is possible to broaden the concept of the market for this service. The potential scope for other services of an enterprise is determined on the basis of their type and specificity, and is justified in each case. transportation of thermal energy, maintenance of internal house networks, performance of works of CACS are in our understanding such volumes, which may be needed by all households and economic entities of Kharkiv and adjacent suburban territories, regardless of connection to the capacity of the networks. Potentially possible volume of cold water pumping is defined by us as the maximum volume required by the enterprise of KP VTP «Water». In the future, having studied the technical possibilities of providing such a service to other households and economic entities, it is possible to expand the concept of the market for this service. The potential scope for other services of the enterprise is determined on the basis of their type and specificity, and is subject to justification in each case. the implementation of the works of the CACS is in our understanding such volumes as may be required by all households and economic entities of Kharkiv and adjacent suburban territories, irrespective of connection to the capacity of the networks. Potentially possible volume of cold water pumping is defined by us as the maximum volume required by the enterprise of KP VTP «Water». In the future, having studied the technical possibilities of providing such a service to other households and economic entities, it is possible to expand the concept of the market for this service. The potential scope for other services of the enterprise is determined on the basis of their type and specificity, and is subject to justification in each case. the implementation of the works of the CACS is in our understanding such volumes as may be required by all households and economic entities of Kharkiv and adjacent suburban territories, irrespective of connection to the capacity of the networks. Potentially possible volume of cold water pumping is defined by us as the maximum volume required by the enterprise of KP VTP «Water». In the future, having studied the technical possibilities of providing such a service to other households and economic entities, it is possible to expand the concept of the market for this service. The potential scope for other services of an enterprise is determined on the basis of their type and specificity, and is justified in each case. Kharkiv and the surrounding suburban areas, regardless of the connection to the capacity of the networks. Potentially possible volume of cold water pumping is defined by us as the maximum volume required by the enterprise of KP VTP «Water». In the future, having studied the technical possibilities of providing such a service to other households and economic entities, it is possible to expand the concept of the market for this service. The potential scope for other services of an enterprise is determined on the basis of their type and specificity, and is justified in each case. Kharkiv and the surrounding suburban areas, regardless of the connection to the capacity of the networks. Potentially possible volume of cold water pumping is defined by us as the maximum volume required by the enterprise of KP VTP «Water». In the future, having studied the technical possibilities of providing such a service to other households and economic entities, it is possible to expand the concept of the market for this service. The potential scope for other services of an enterprise is determined on the basis of their type and specificity, and is justified in each case. Having studied the technical capabilities of providing such a service to other households and economic entities, it is possible to expand the concept of the market for this service. The potential scope for other services of an enterprise is determined on the basis of their type and specificity, and is justified in each case. Having studied the technical capabilities of providing such a service to other households and economic entities, it is possible to expand the concept of the market for this service. The potential scope for other services of an enterprise is determined on the basis of their type and specificity, and is justified in each case.
Based on the experience and tradition of KTM enterprise, all consumers of services were divided into three groups — population, budget organizations and other consumers. However, in our opinion, if there is some policy of supporting manufacturing enterprises from the government or local authorities, we can distinguish one more group among other consumers — enterprises. Therefore, in the model of market position indicators, we have introduced the consumer category of the enterprise, but it only makes sense in the case of a support policy, when it is necessary to know the volume of consumption of services of this particular group to provide subsidies or subsidies. Thus, before such conditions arise, we consider it appropriate to classify the enterprise in the category of other consumers and not to use for the calculation that part of the model belonging to the category of enterprises.
Structural units will not fully utilize the market performance model. In this way, Teplozbut branch will determine market shares for the sale and transportation of thermal energy, as well as the performance of other services of the enterprise. At the level of the district branches of the enterprise will determine the market shares for the pumping of cold water, the implementation of the CACS and the maintenance of the interior network.
Figure 3 shows the factor model of the relationship between strategic and tactical indicators of internal processes.
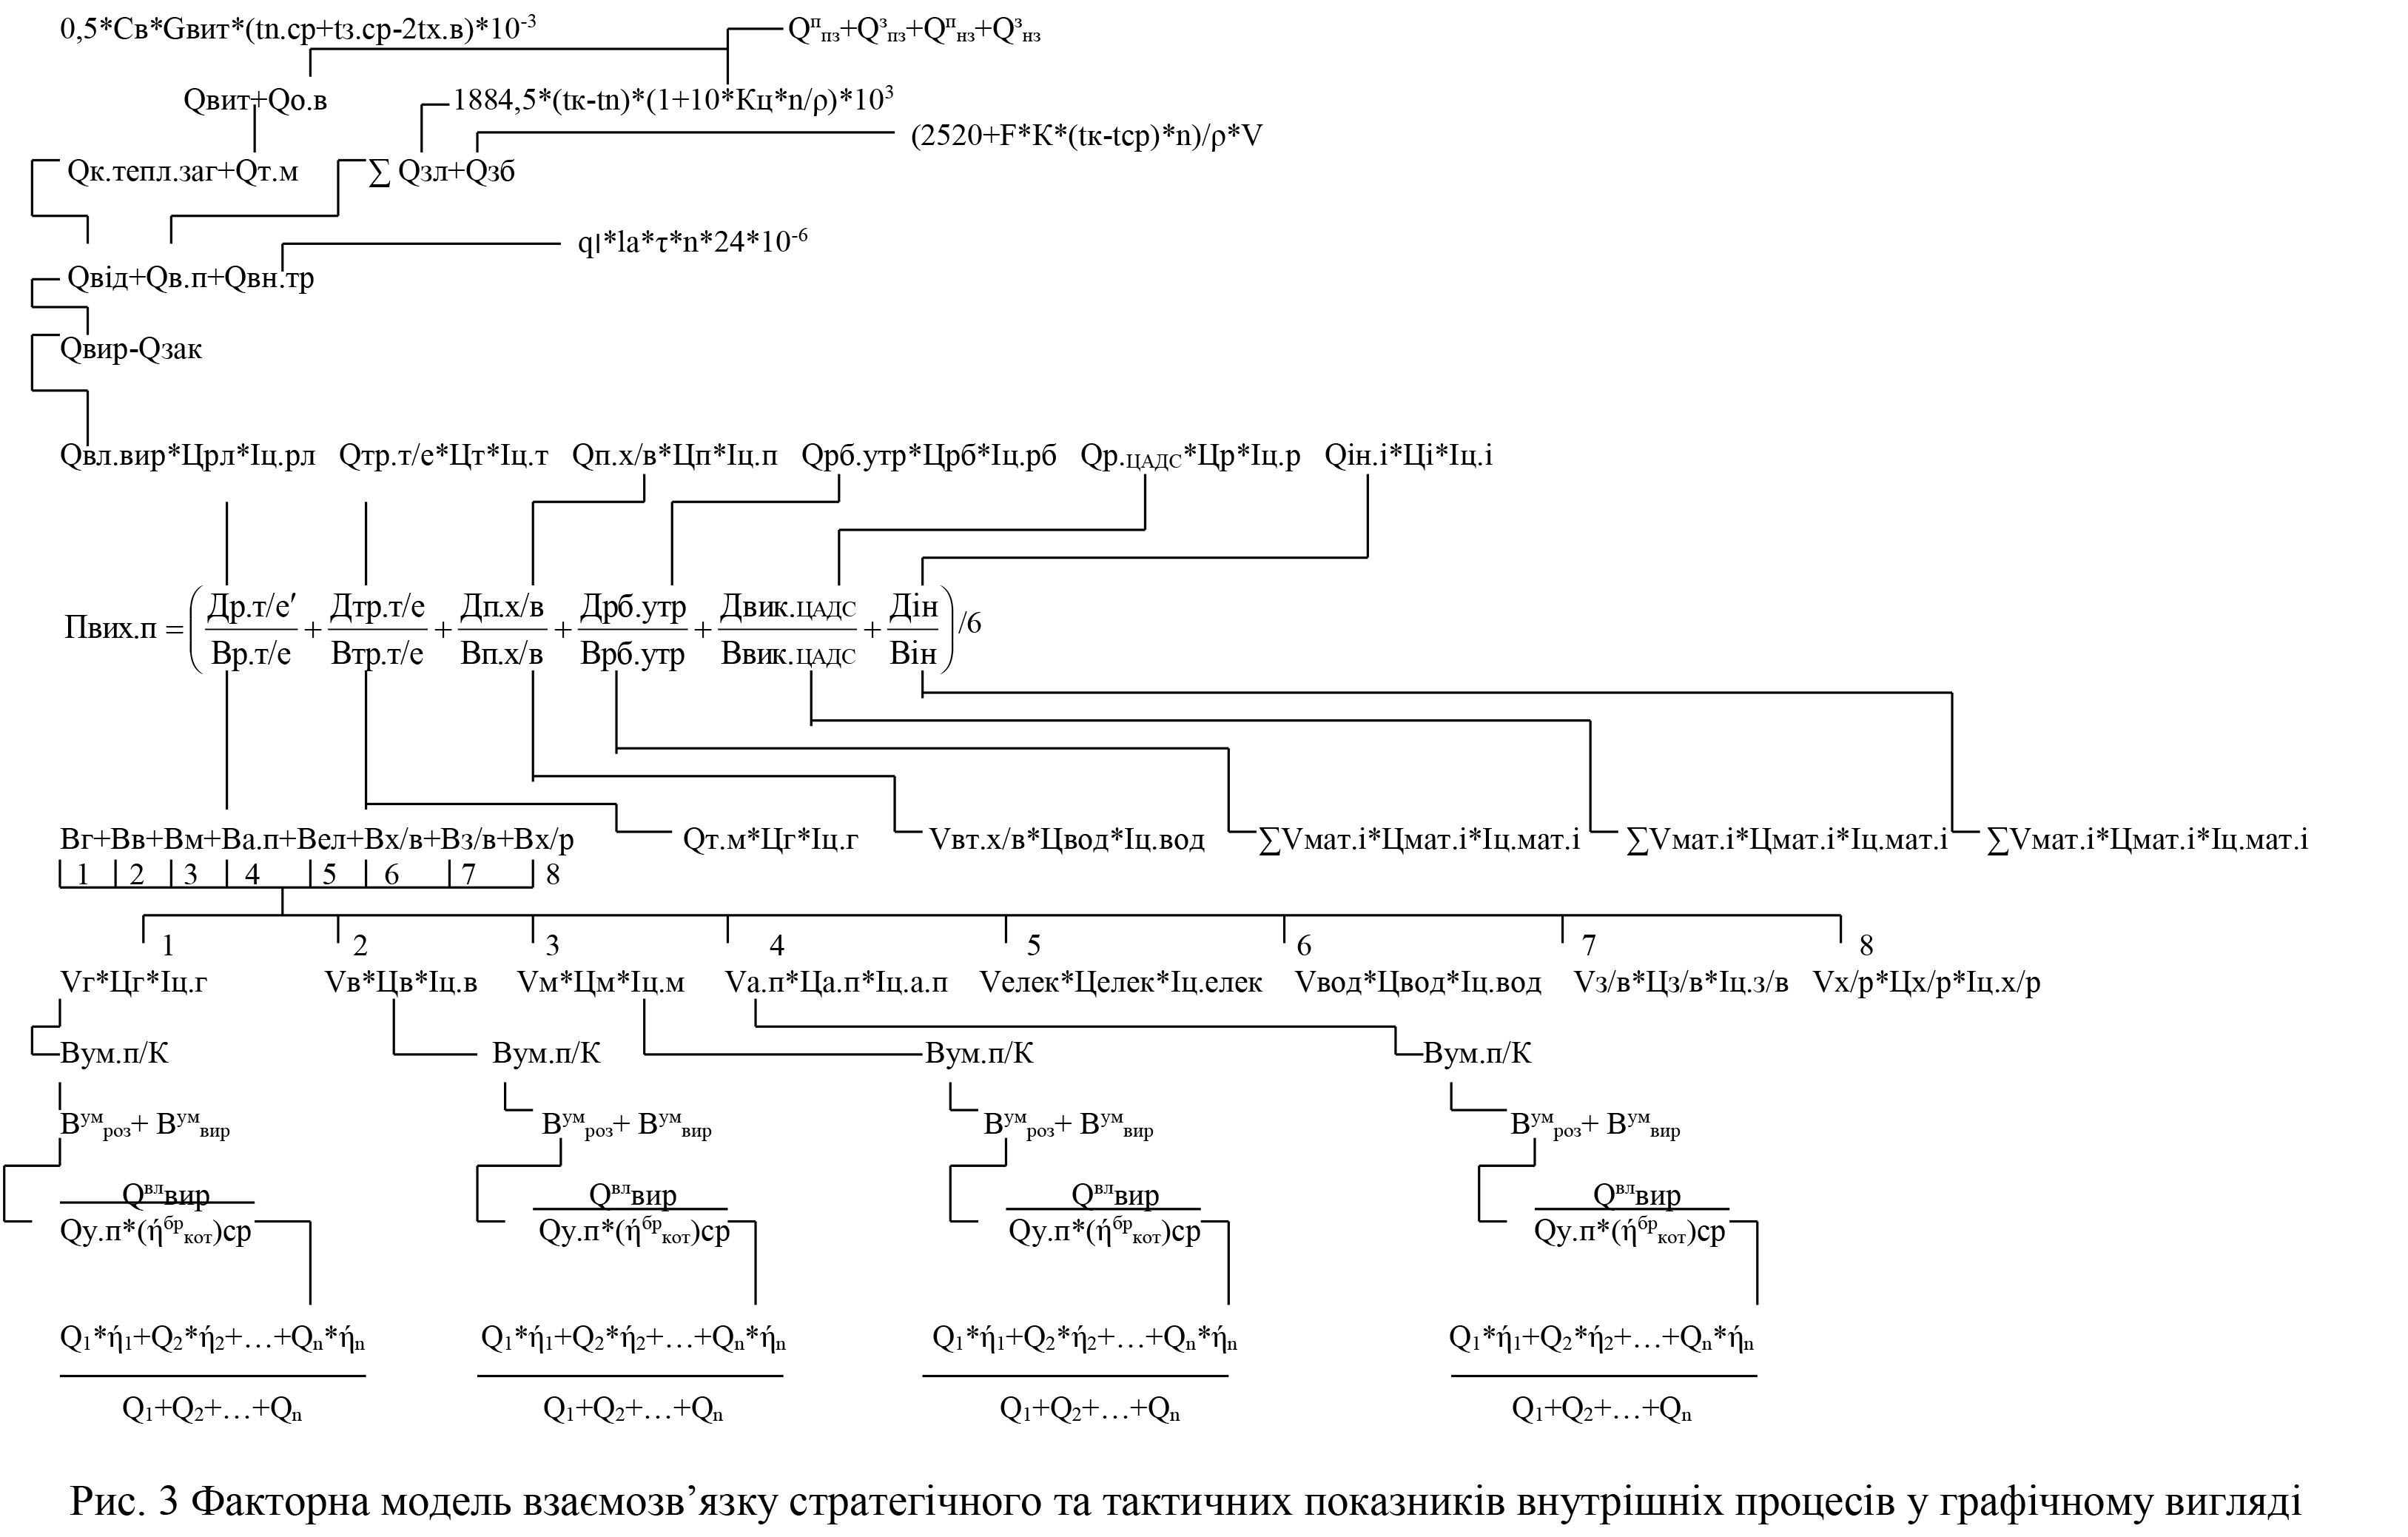
In the internal metrics model, we interpreted the service output indicator somewhat in an unusual form, presenting it as a value. This was done in order to reduce the different rates of output of each service to a single — cost. Based on the content of the service indicator, which is contained in order to show the ratio of the volume of services and materials that were spent on its production and provision, the total enterprise output indicator was interpreted as the arithmetic mean of the output of services by their types.
To mitigate the impact of this price factor, we adjusted each service exit indicator to its corresponding price index. Thus, a change in the data of output of services, as well as the overall indicator of output of services in the enterprise will reflect precisely the influence of their natural component (production volumes and volumes of material costs on their production). By volume of services of maintenance of internal house networks and performance of services of CACS we will mean the number of square meters on Kharkov area which is to be serviced.
The application of the internal process indicators model will only take place in the structural units engaged in production activities and will also be partial. The boiler-houses will determine the output of services for the sale of heat energy, in the district branches — the indicators of the output of services for heat supply of heat energy, from pumping of cold water, maintenance of internal house networks, the execution of works of the CACS, from other services provided by the enterprise.
Figure 4 presents the factor model of the relationship between strategic and tactical indicators of learning and growth.
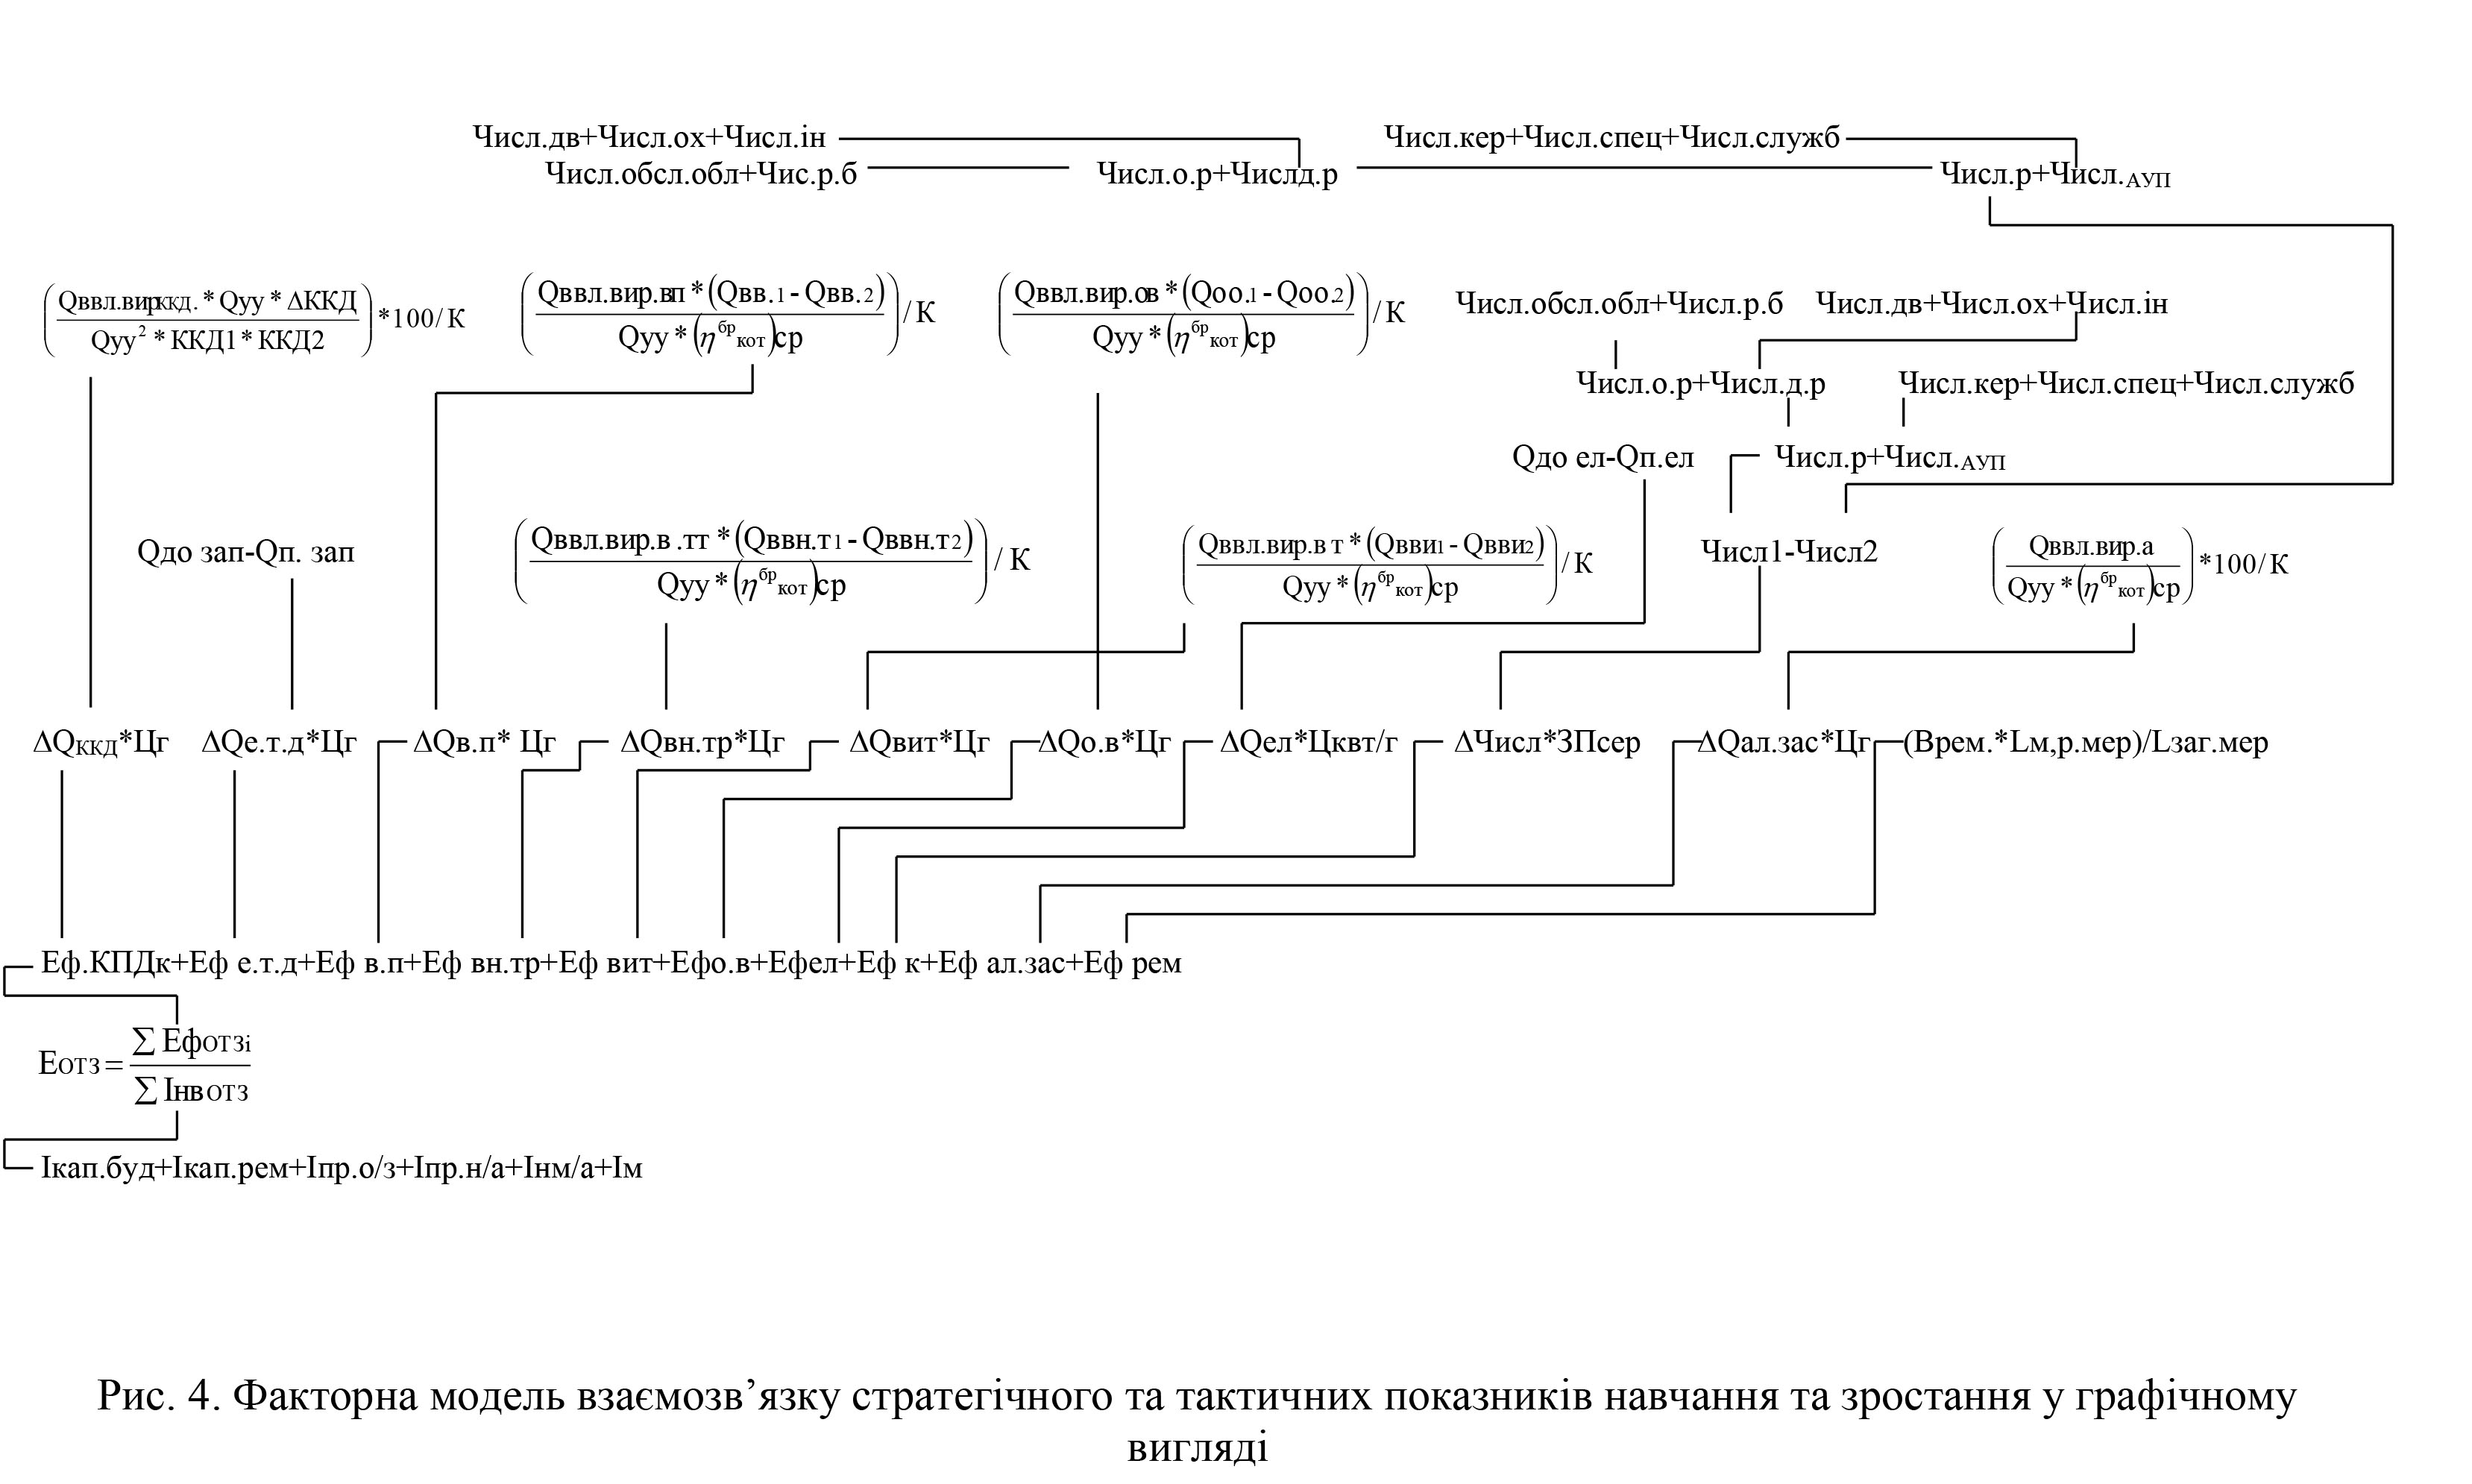
In the model of indicators of training and growth of explanation the indicator of efficiency of organizational and technical measures is necessary, by which we understand the correlation of the sum of effects in value expression from carrying out of measures on modernization of the organizational structure of the enterprise, its technical and technological base and the amount of expenses in the form of various investments that have gone for such modernization.
The Learning and Growth Indicators model will be used in all structural units, but not in full. The boiler houses will calculate the effects of increasing the efficiency of boilers, economical use of gas, reducing fuel losses for own needs of boiler houses, reducing heat losses in boiler networks, organizational measures with personnel. District branches will calculate the effects of reducing heat losses in centralized networks by replacing pipes with insulated ones, reducing heat and hot water losses by eliminating pipe flows, and organizing staffing. It will also calculate the effects of the use of alternative innovative means of heating water, saving on ongoing repairs at the expense of capital repairs of fixed assets.
Figure 5 presents the factor model of the relationship between strategic and tactical environmental indicators.
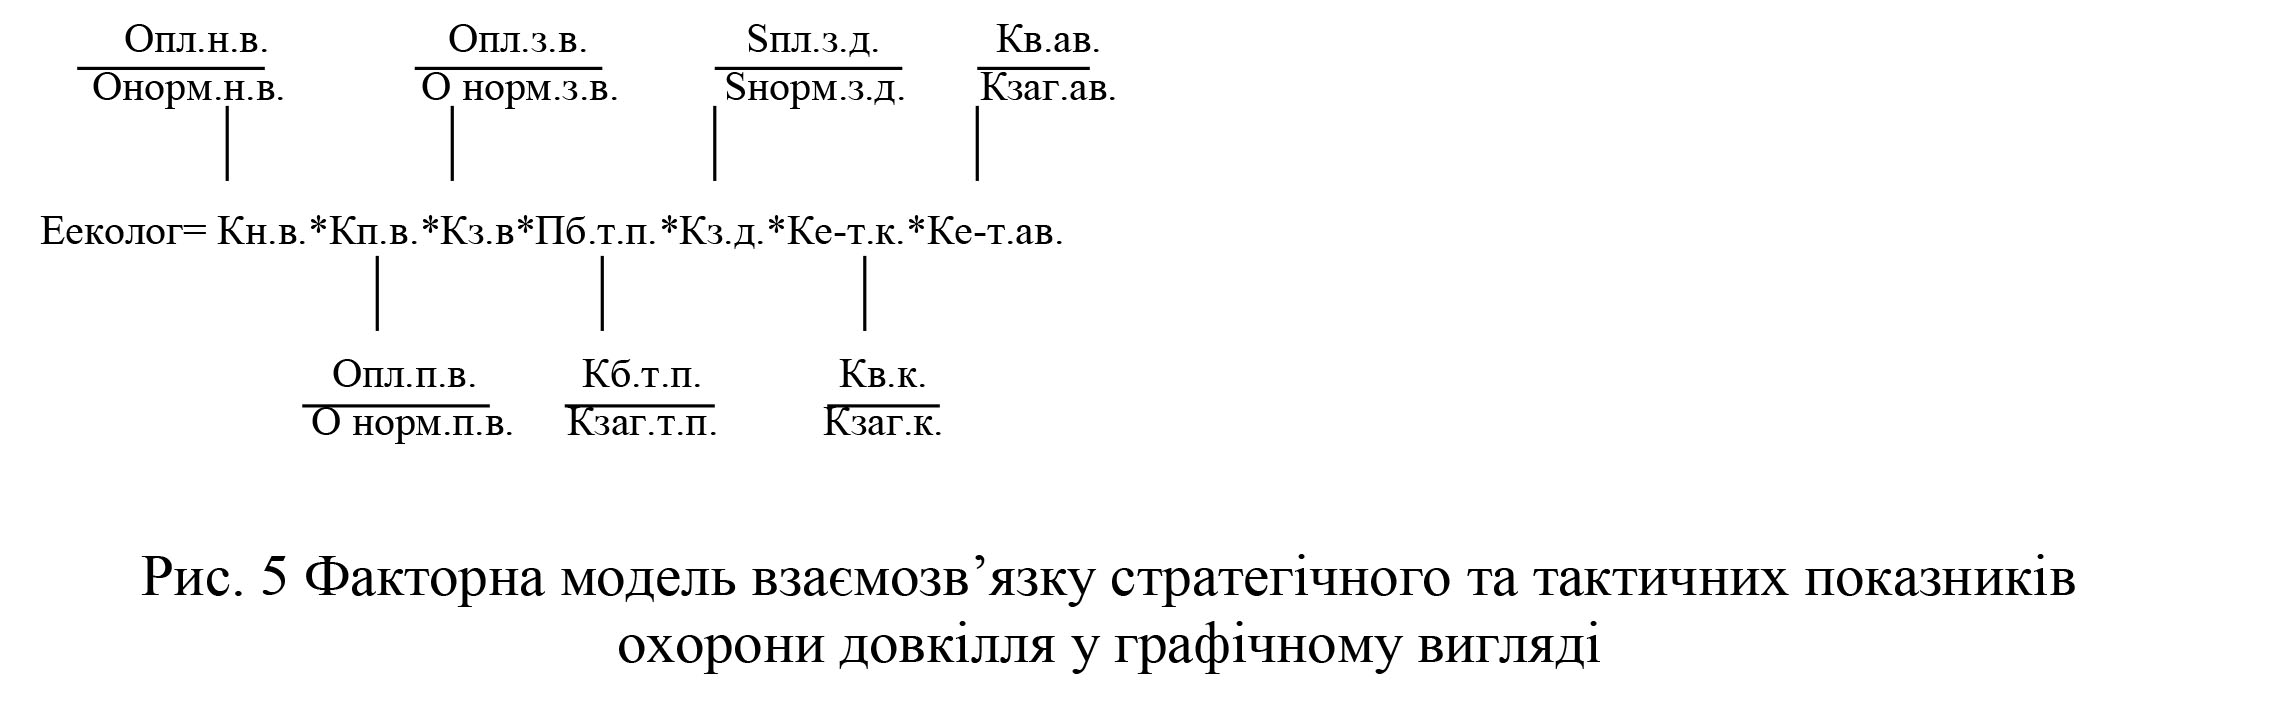
The model of environmental indicators reflects the compliance of the planned and then implemented measures for environmental protection to the standards stipulated in the environmental legislation and serves as an indicator that shows the state of the environmental situation in the enterprise. The information we receive from this model alerts us to the possibility of applying penalties or vice versa. The overall efficiency of environmental events is also the arithmetic mean of all environmental factors calculated by the enterprise.
The environmental performance model will be partially applied in all structural units. The boiler houses will calculate all environmental factors, all other structural units — coefficients of compliance with the standards of land contaminated with waste of production and compliance with environmental and technical standards of motor transport.
Through the use of all the above-mentioned factor functional models, the connection of strategic, tactical and operational levels across the enterprise and its subdivisions is realized, and due to their complex application all distinct functional areas are connected. The strategic metrics of each subdivision determine the trends of development of these subdivisions and influence the tactical indicators of these subdivisions, which are then allocated to the respective operational indicators. The operational indicators thus formed in the divisions form the general operational indicators throughout the enterprise, which by summing up the relevant indicators form the tactical indicators of the enterprise. Strategic metrics that drive enterprise-wide development trends adjust tactical metrics across the enterprise that are automatically displayed,
As can be seen from the previous sentence, the connection between different strategic functional areas occurs through appropriate tactical indicators, this allows, by specifying the parameters of one of the strategic functional indicators, to form the parameters of other strategic functional indicators. This is completely in line with the management concepts of direct-costing (in the case of new business process formation) and target-costing (in the case of improving existing business processes), when the strategic functional indicator that sets the trend for others is the indicator of return on equity.
According to certain relationships between the indicators of the plans of the enterprise it is necessary to describe the mechanism of their planning:
1) On the basis of the calculation of the natural indicators of each calculation of business processes, its cost indicators are calculated;
2) Calculations are performed on each relevant indicator, thus determining the functional tactical plans for the enterprise;
3) On the basis of indicators of functional tactical plans of the enterprise, tasks are allocated to the structural subdivisions of the enterprise (in the form of tactical functional plans of structural subdivisions);
4) Structural units shall study the planned indicators provided by them and adjust them in accordance with the strategic goals and objectives expressed in the strategic indicators of the structural units;
5) Adjusted data of their functional plans are submitted by the structural units to the management of the enterprise;
6) The management of the enterprise generates the provided indicators of tactical functional plans of structural units in a single tactical functional plans of the enterprise;
7) The management of the enterprise adjusts tactical functional plans based on the strategic goals, tasks and tasks of the enterprise as a whole and determines the final version of tactical functional plans;
8) In accordance with the approved tactical functional plans, the final variant of business process calculations, operational functional plans for the enterprise and tactical functional plans of structural units are formed;
9) Structural units, in accordance with their tactical functional plans, form operational plans that must be consistent with the operational plans of the enterprise as a whole.
Conclusions.The proposed strategic, tactical and operational maps of the KTM KP enterprise made it possible to develop a comprehensive set of indicators of the enterprise plans. With the help of factor functional models, all these indicators were interconnected on the basis of methods of logic, creativity and deterministic factor analysis, which allowed to clearly and more clearly trace and continue to observe the formation of costs of the enterprise resulting from the use in production and economic activity of one or another. recruitment. Optimization of resources, bringing their value expression to the desired, allows the implementation of comprehensive programs of modernization, reconstruction of existing fixed assets, intellectual component and create innovative products that will be used in the enterprise. However,
Literature:
1. I. Ansoff. Strategic management. / Igor Ansoff — M .: Economics, 1989 .— 304 p.
2. R. Akoff. Planning for the future of a corporation. / Ackoff Ronald — M .: Progress, 1985 .— 328 s.
3. Khan D. Planning and control: the concept of controlling [Translated from German: ed. and with the foreword. Turchak A.A., Golovach L.G., Lukashevich M.L.] / Khan D. — M .: Finance and statistics. — 1997. — 800 c .
4. Bad EB Coordination of strategic and operational planning / Bad EB // Management of the development . — 2002. — No. 1 . — S. 80 — 84.
5. LV Balabanova . Strategic marketing management of the enterprise on the basis of benchmarkin g : m mono. / L.V. Balabanova, V.V. Slipenky. — Donetsk: DonGUET — 2005. — 171 p.
6. Factor analysis . [Electronic resource] / Site access mode: // http : // dist — cons . en / modules / DuPont . 7. Smolin IV Strategic planning of organization: m onohrafiya / Smolin and mountains in alentynovych
. — K .: Kyiv. National Trade-Economical University — 2004. — 344 p.
8. Sadekov AA Operational planning at a trading company [Text]: monograph / А.А. Sadekov, U.S. Rasulov. Donets.Nats.un-t Economics and Trade. E. Tugan-Baranovsky. — Donetsk: DonNUET . — 2008. — 193 p.
9. K. Ovcharenko. How to balance BSC or what everyone wanted to know but were afraid to ask [Electronic resource] / Site access mode: http : // www . e .- xecutive . en / publications / aspects / bsc /article 2708 /
10. Mensebrovsky I. Instrument of transformation of ideas into specific goals / Mensebrovsky And grief // Comp & nyon. — 2004. — No. 47 (207). — from. 50 — 53.
11. Kaplan R. Strategy-oriented organization. How organizations using a balanced scorecard succeed in the new business environment / Kaplan Robert S .., Norton David P. — M .: Olymp-Business — 2005. — 416 p. 12. Kaplan R. Strategic maps. Transformation of intangible assets into tangible results / Kaplan Robert S. — M.: Olymp-Business — 2005. — 512 p. 13. Olve NG . The balance between strategy and control /
Olve NG, Petri K.-J., Roy J., Roy S. — St. Petersburg: Peter , 2005. — 320 p.
14. Konstantin Redchenko . Indicative Disagreement: Balanced Scorecard u Tableau De Bord [Online Resource] / Site Access Mode: http : // www . management . com . ua / strategy / p 046. html .
15. M.O. Kizim. Balanced Scorecard: Monograph. / MO Kizim, AA Pilipenko, VA Zinchenko — X .: INZHEK — 2007. — 192 p. 16. S. Taran. KPI u
BSC : factors for successful application . [Electronic resource] / Access mode to the site: http : // www . e .- xecutive . com / publications / aspects / bsc / article 201
THE THEORETICAL AND METHODICAL TOOLS OF FORMING EFFECTIVE SYSTEM’S PLANNING
published in 2013 — K .: Yu-ZSU — 2013. — P. 208 — 215, © Nemtsov O.V.
Annotation: The article considers the problems of the elaboration methodical approaches’ to formation of the system’s planning and its main component — the system plans. The main requirements to the process of building the system’s planning have detected, to identify her as effective . Keywords: planning, the effectiveness of the system, methodological tools, methodical approach
Key Words: planning, efficiency, system, methodical tools, a Methodological Approach About
The main problem that planning has today is not the lack of strategic, tactical or operational planning or their poor development: separately, their methodological and methodological tools are considered quite deeply. Nevertheless, the main problem facing each economic entity is the consistency of these types of planning, the search for a methodology and methodology that made it possible to implement the strategic guidelines of the economic entity, while not forgetting the need to quickly solve pressing current problems, to make the strategic process a tactical and operational logical continuation processes.
Planning should not only be on paper, as is often the case with economic entities, especially our domestic ones, it should fill the enterprise with “life force”, predetermine its development vectors, and outline the path from the past through real changes to the future. This process should be continuous, it is it that is important in itself, and not the result of planning as such (meaning the achievement of the plan at any cost and without taking into account the changed circumstances).
These statements were made back in the late 80s by the famous economist, manager and planner Ronald Ackoff in his various works, especially these postulates were reflected in his work “Planning for the future corporation” [1]. It was then that he singled out normative planning, which was designed to integrate strategic, tactical and operational planning, within the framework of one process — normativeplanning. His views on planning and the management process in general are the result of the evolution and gradual development of knowledge of this phenomenon by scientists over the centuries, it was especially intensely reflected in the late 19th, throughout the 20th century, in the form of formalized developments, that is, postulates, intuitive knowledge that was always present inside every talented and successful leader, in clear methodological and methodological directions (written fixation of scientific and practical developments). The opinion on the essence of planning and effective planning by Ackoff is quite consistent with the opinions of other economists quite famous in matters of management and planning, such as Guy Benveniste, Igor Ansoff, Peter Drucker, Axel Zell, Khan, Mintsberg, Mayer, Steiner, Mac Hug, Armstrong, Thomson, Strickland,
Based on the foregoing, the formation of an effective planning system is impossible a priori without integration and logical continuation of one another strategic, tactical and operational planning in a single process in our case of internal planning. However, the elements of an effective planning system are not limited only to the processes of strategic, tactical and operational planning, but also include those elements that allow the planning process to be carried out within the framework of this unified system. Thus, the main issues in the formation of an effective enterprise activity planning system are: determining its structure (architecture), in other words, an ordered set of elements and the interconnections between them, based on observing the best characteristics of the system properties that are characteristic of any systems.
Particular attention in constructing an effective planning system belongs to its component such as a plan system, which in brief, concise, mainly digital forms, displays basic information in the form of indicators about the entire system. As in the case of the planning system itself, when forming a system of plans, it is necessary to build their structure (architecture) on the basis of integration and identification of cause-effect relationships between them, which allow achieving a synergistic effect. Then, already using this formed structure of the planning system, it becomes possible to plan specific planning activities in which we are primarily concerned with the mechanism for their coordination among themselves at the strategic, tactical and operational levels, with the aim of
Schemes of methodological approaches to the formation of a planning system and a system of plans will give a visual representation of the implementation of the above statements in reality (Fig. 1, 2).
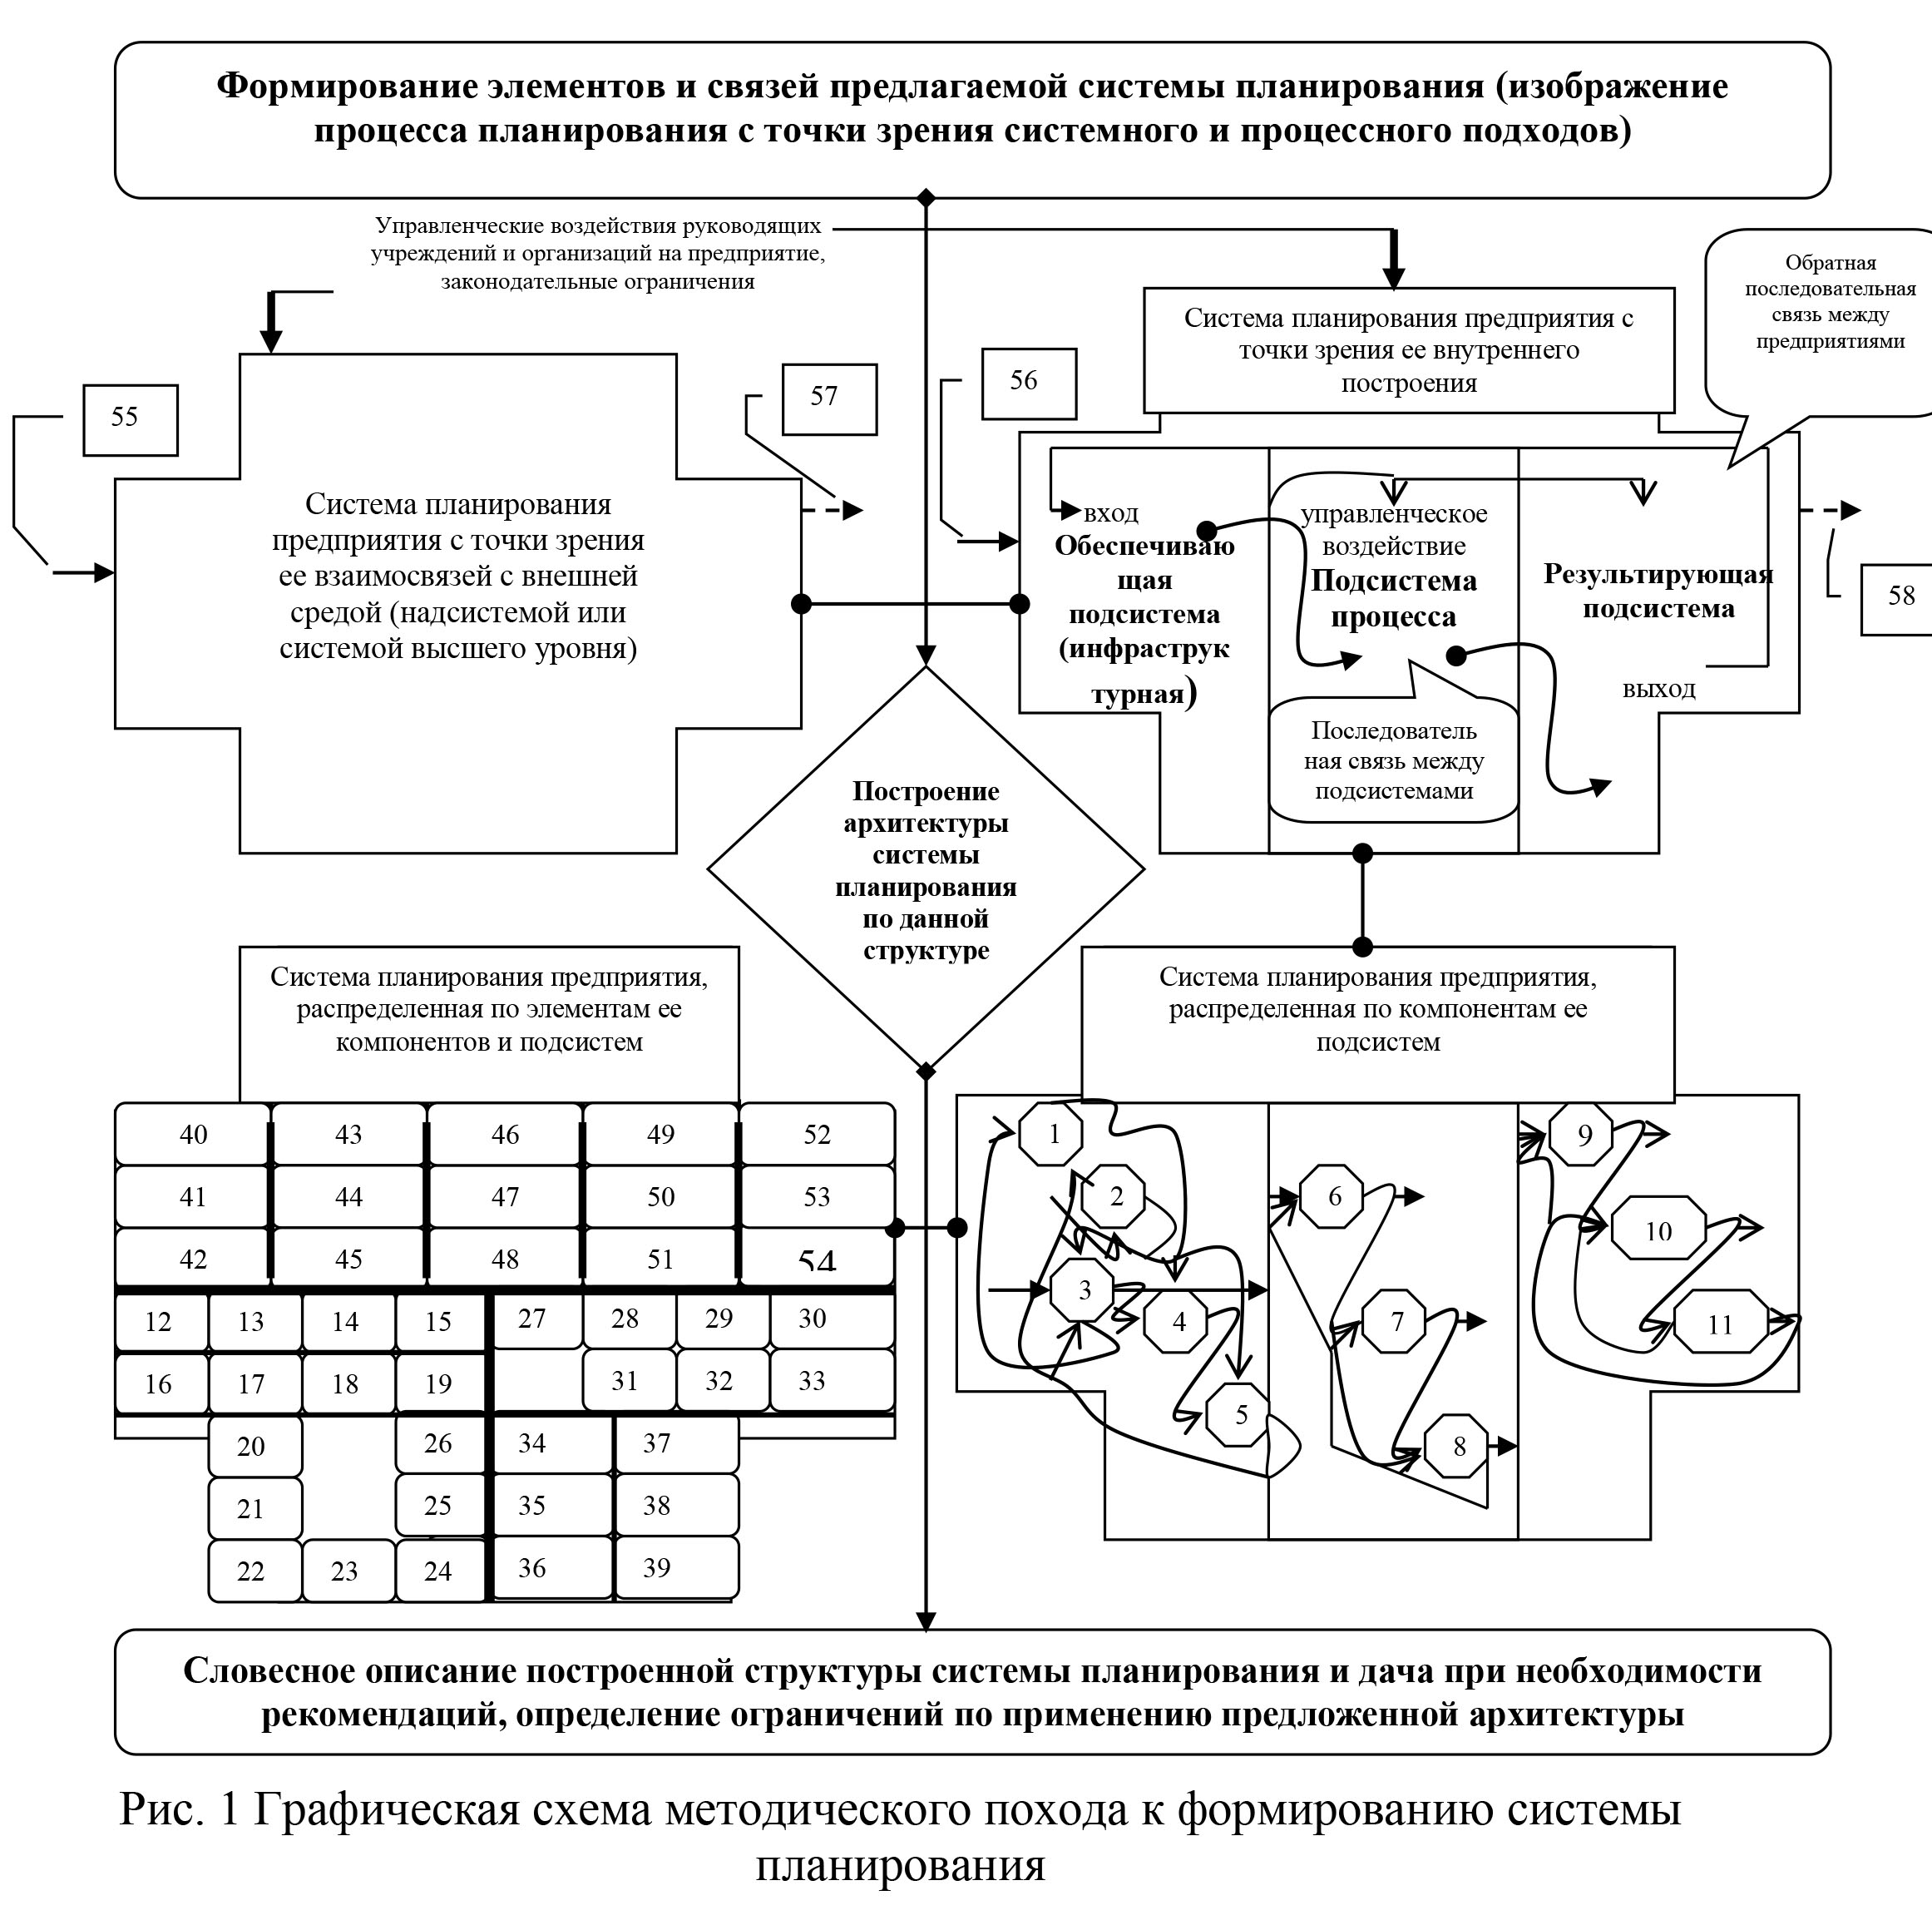
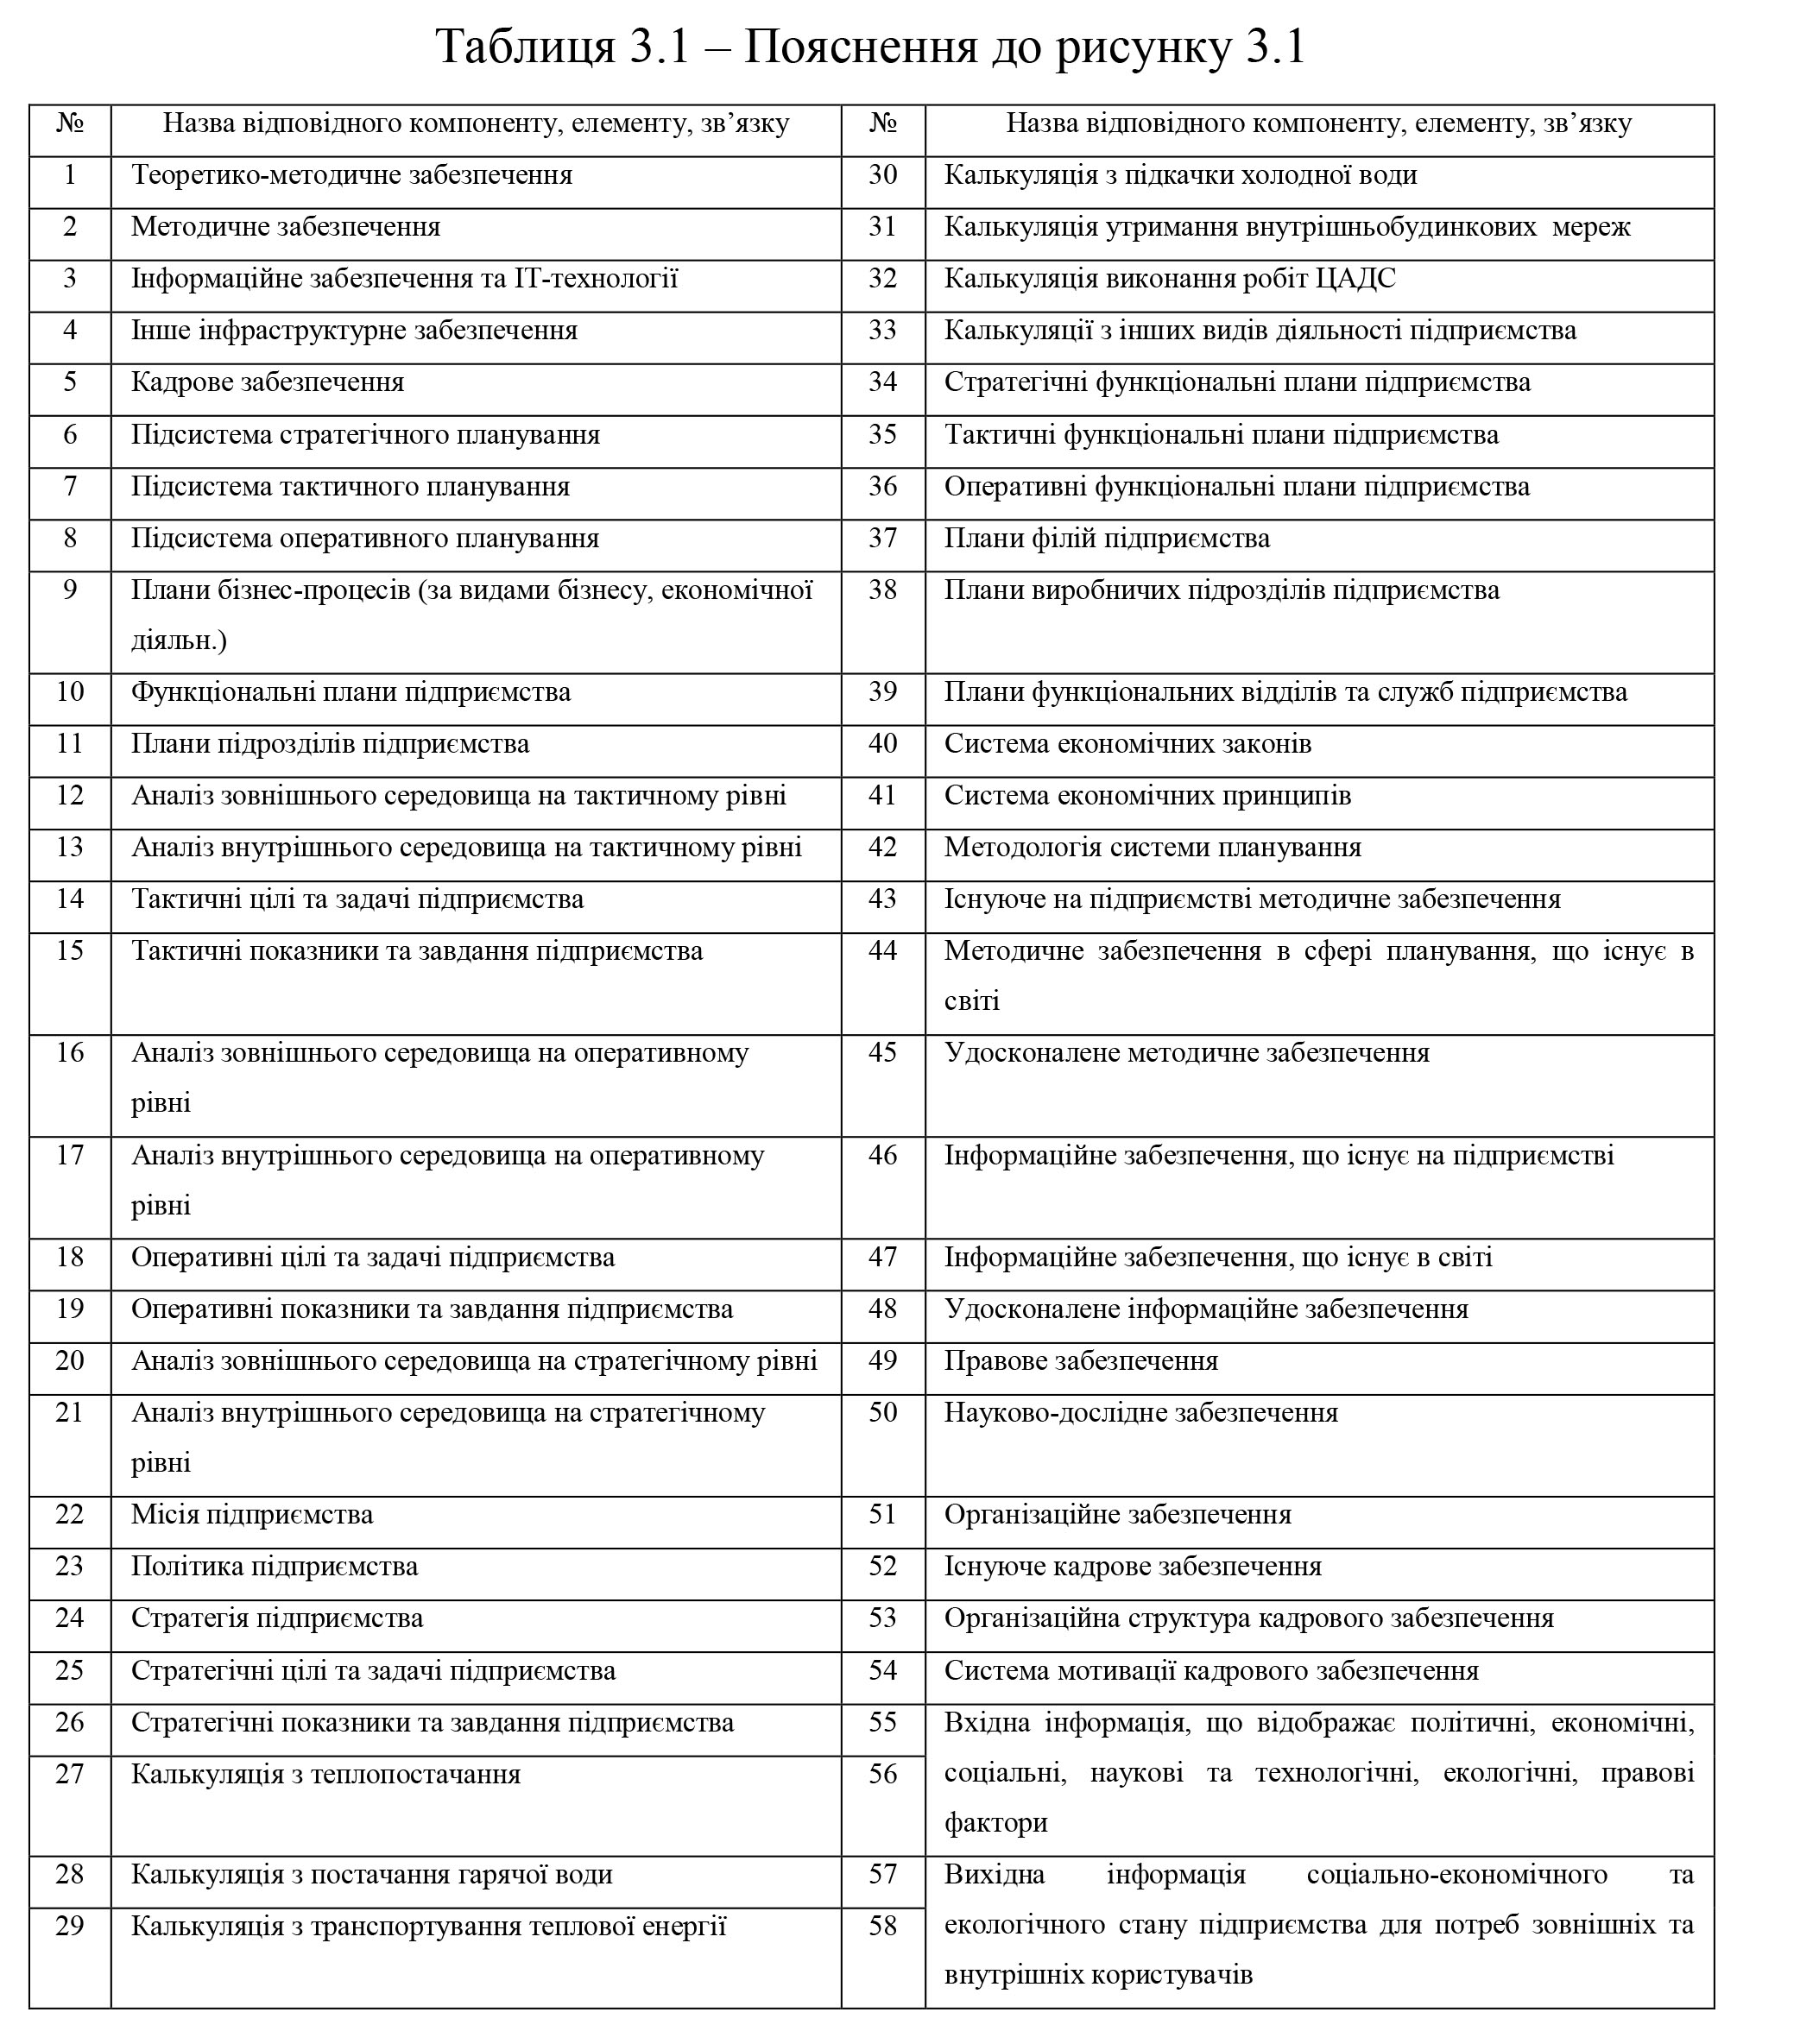
The essential basis of the methodological approach to the formation of the planning system is the IDEF0 methodology, which takes into account some differences in the fundamental construction of the system itself, based on theoretical findings regarding the structure of the planning system.
The IDEF0 methodology provides for the construction of a hierarchical system of diagrams (decomposition), which are single descriptions of fragments of the main or context diagram. The context diagram, which is the actual planning system, is described in terms of its relationship with the external environment. The next step is to carry out functional decomposition, as a result of which decomposition diagrams are formed, which are subsystems of the planning system. Such decomposition diagrams are described separately from the context diagram, although they may have common elements in terms of input, output, control, and mechanism, that is, these diagrams reveal the interconnections within the system between its components. Each of the decomposition diagrams can be divided into decomposition diagrams of the 1st level, which are components of the subsystem, and so on to the necessary level of fragmentation and depth (to simple elements). After each stage of the decomposition, it is possible to conduct an examination to which all interested parties can be involved: domain experts, representatives of interested parties, analysts, employees of the functional, structural department involved in the development of this business process. The modeling process begins with determining the general level of description of the system as a whole: the subject of modeling, which is the system itself, the goal, which declares the answers to the questions posed, and the point of view on the model, which is the point of view (understanding) of a person on the model in necessary for modeling aspect. After each stage of the decomposition, it is possible to conduct an examination to which all interested parties can be involved: domain experts, representatives of interested parties, analysts, employees of the functional, structural department involved in the development of this business process. The modeling process begins with determining the general level of description of the system as a whole: the subject of modeling, which is the system itself, the goal, which declares the answers to the questions posed, and the point of view on the model, which is the point of view (understanding) of a person on the model in necessary for modeling aspect. After each stage of the decomposition, it is possible to conduct an examination to which all interested parties can be involved: domain experts, representatives of interested parties, analysts, employees of the functional, structural department involved in the development of this business process. The modeling process begins with determining the general level of description of the system as a whole: the subject of modeling, which is the system itself, the goal, which declares the answers to the questions posed, and the point of view on the model, which is the point of view (understanding) of a person on the model in necessary for modeling aspect. structural department involved in the development of this business process. The modeling process begins with determining the general level of description of the system as a whole: the subject of modeling, which is the system itself, the goal, which declares the answers to the questions posed, and the point of view on the model, which is the point of view (understanding) of a person on the model in necessary for modeling aspect. structural department involved in the development of this business process. The modeling process begins with determining the general level of description of the system as a whole: the subject of modeling, which is the system itself, the goal, which declares the answers to the questions posed, and the point of view on the model, which is the point of view (understanding) of a person on the model in necessary for modeling aspect.
The principal thing in the presented architecture of the planning system is the presence of three types of subsystems that differ in kind of tasks, which are formed in turn from the corresponding components and elements. We attributed to such subsystems:
— providing the planning process (infrastructure);
— in which the planning process (process) takes place;
— effective regarding the planning process.
The first type of subsystem from different sides provides the planning system with the necessary resources, that is, conditionally is the input of the system. The second type of subsystem is the process of converting input resources to the result or product of the system, that is, it is conditionally a system converter. The third type of subsystem is the result or product of the system, that is, conditionally the output of the system. All these subsystems are interconnected by relationships and feedbacks. So, the upstream information from the supporting subsystem is processed using certain laws, principles and methods in the subsystem of strategic, tactical and operational planning, and takes specific forms in the form of a set of plans, namely, certain qualitative and quantitative indicators that are consistent with each other, have specific deadlines and specific performers and responsible. Let us consider in more detail the components (components) of each of the presented subsystems.
With the help of theoretical and methodological support of the planning system, the formation of the main provisions of all planned activities. This component is somewhat central among other components of the supporting subsystem, since it is he who forms the necessary scientific and organizational support for all other components. It is a combination of general and special laws, laws and principles, on the basis of which the methodology of the planning system is formed. The methodology of the planning system determines the overall goal of the enterprise, the main approaches and guidelines for its implementation, as well as a set of methods that allow this to be implemented.
The formation of the methodological support of the planning system is based on its theoretical and methodological support. In this subsystem, steps are allocated, a detailed schedule of step-by-step actions is created, standard and methodological apparatuses are created, with the help of which the process of compiling plans is carried out.
An important component is staffing. Since the planning process is an integral part of human activity, that is, it cannot be realized without direct human intervention, or rather, planning exists only as long as the person exists, the qualitative composition of the employees who carry out the planned activity has a decisive influence on the feasibility and effectiveness the entire enterprise planning system. Under the workers who provide the planning system, it should be understood not only representatives of the planning and economic departments, but all those involved in the formation and implementation of plans. The more employees involved in the planning process, the better for the enterprise. In this situation, every employee of the enterprise understands what task is facing him and other workers, and what consequences will be in case of non-fulfillment or unfair performance of their duties. Moreover, each employee, before performing the task himself, forms it, that is, in the process of drawing up plans, all reasonable proposals of the employees are taken into account, and, achieving the general goal of the enterprise, the employee simultaneously reaches his goal.
Very important is the component of information support and I- T technology and . The process of drawing up a system of plans and carrying out planned activities generally requires the availability of relevant and high-quality information. This information may be of a political, economic, social, technical, scientific nature, etc. It comes through all available channels of enterprise communications from the external and internal environment. The accounting information and data of the economic department are of great importance, since on the basis of accounting an assessment of the achievement of planned indicators is carried out, and the economic department reports on the state of the market and the main trends in its development, which underlies the reorientation or formation of certain goals of the enterprise.
A component of other infrastructure support consists of legal, scientific, research, organizational support. The implementation of the planning process and the preparation of plans should occur in accordance with the laws of the country and international agreements. Scientific support is the use of advanced technologies and methods in the implementation of planning. Research support helps to identify the most appropriate forms of planning and the procedure for its implementation on the basis of inventive and research activities. Organizational support to a greater extent depends on the organizational structure of the enterprise and the powers of departments, departments, directly employees. However, the organizational structure of planning can be formed independently, regardless of the organizational structure of the enterprise, it becomes important here that this does not lead to confusion and social tension due to duplication or increase of functions.
The planning process itself is implemented through the components of strategic, tactical and operational planning. That is, during the implementation of this process, strategic, tactical and operational decisions are selected, analyzed, justified, implemented and evaluated, which are presented in the form of quantitative or qualitative indicators of the plans.
The components of a plan system are a set of interconnected and interdependent plans that reflect the diverse solutions to complex problems that an enterprise faces today and may happen in the future.
The methodological approach to the formation of the enterprise plan system (Fig. 2) is based on the postulates on the degree of integration of the totality of plans into a single whole. Its application allows you to implement control and optimization, both over the types of costs (fixed, variable), and over the resources that form these costs.
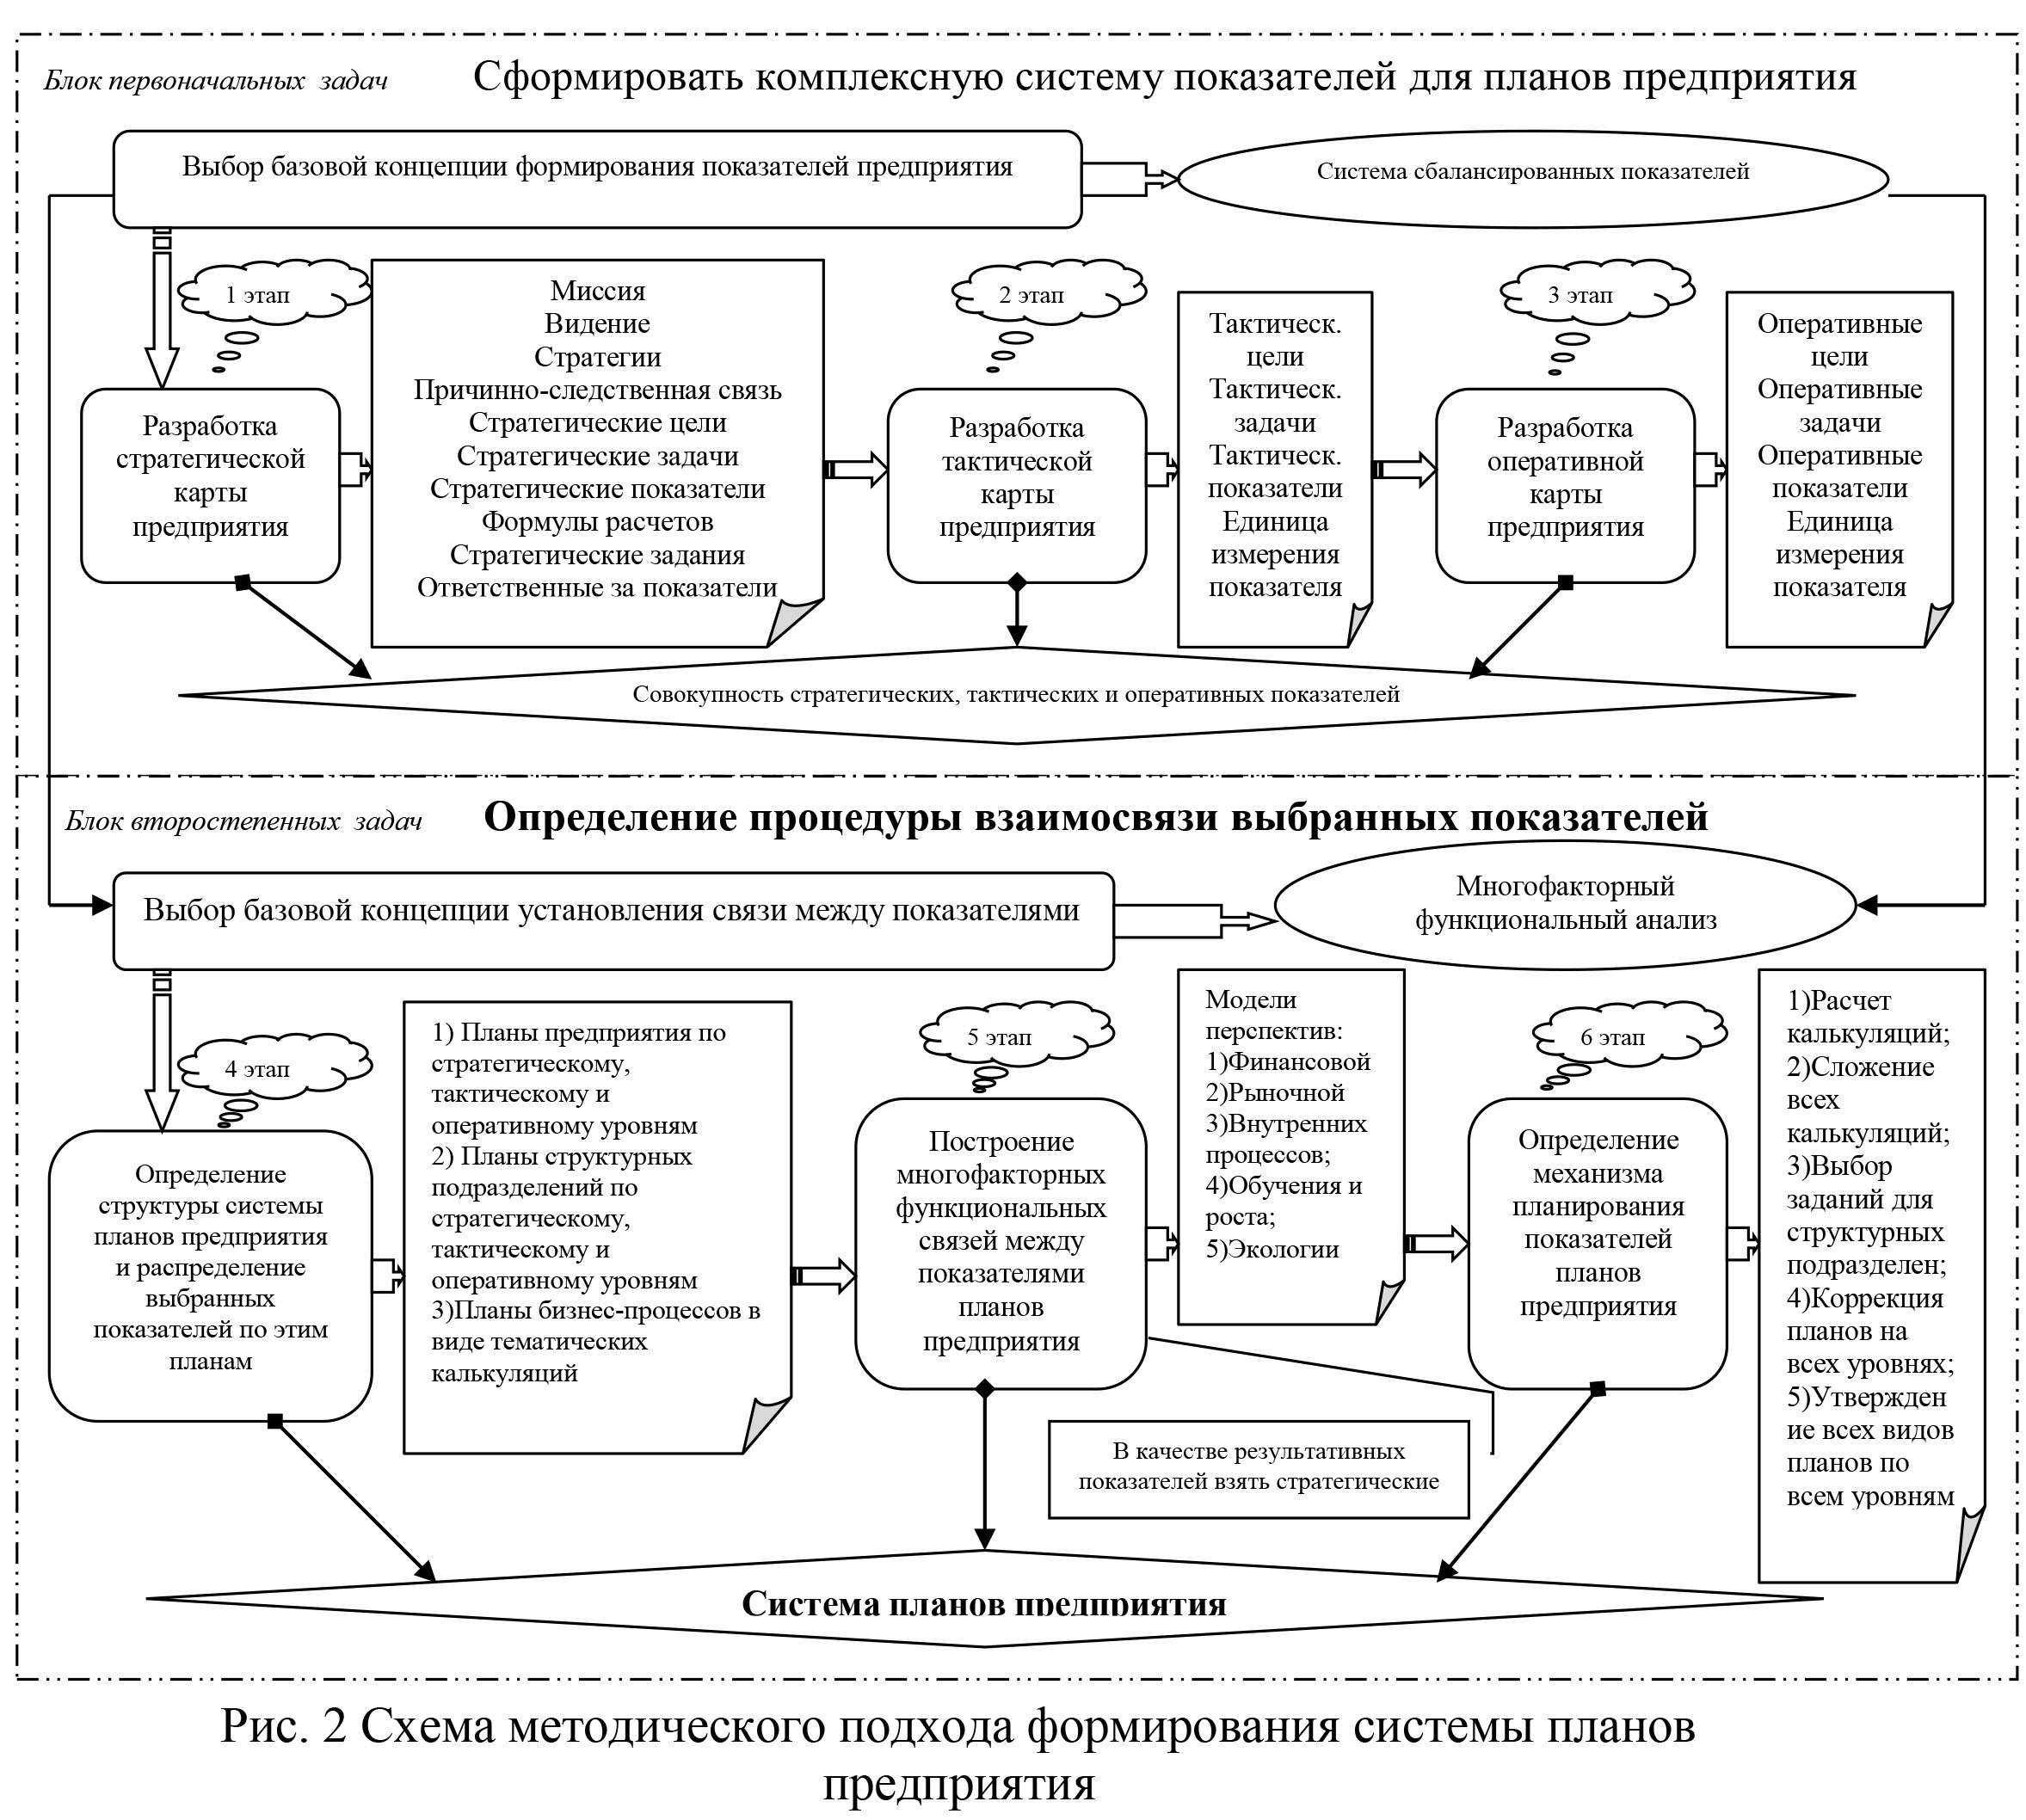
Thus, an effective planning system becomes in the event of an increase in the degree of integration between strategic, tactical and operational planning, which contributes to the actual implementation of the planned, as well as the emergence of a positive synergistic effect. This becomes possible when applying the above methodological approaches, which allow you to form its corresponding structural structure (architecture) and describe the mechanism for coordinating enterprise plans.
BIBLIOGRAPHIC LIST
1. Ackoff R. Planning for the future of the corporation. / Ackoff Ronald — M .: Progress, 1985 .— 328 s.
2. Ansoff. I. Strategic management. / Igor Ansoff — M .: Economics, 1989 .— 304 p.
3. Benveniste D . Mastering the planning policy. [ Trans. from English / under. ed. Kalantarova] / Guy Benveniste — M: “Progress” “Univers” — 1994 — 304 p .
4. Zell A. Strategic planning of industrial enterprises. / Axel Zell // Journal of European Economics. [T. 5.] — 2006 — No. 2. — P. 188 — 201.5 .
Kaplan R. Strategic maps. Transformation of intangible assets into tangible results / Kaplan Robert S. — M.: Olymp-Business — 2005. — 512 p.
6. Mayer E. Controlling as a system of thinking and management. : [per. with him. SOUTH. Zhukova and S.N. Zaitseva / Ed. S.A. Nikolaeva] / E. Mayer — M .: Finance and statistics. — 1993 .— 96 s.
7. Mescon M. Fundamentals of management. [Trans. from English Total ed. L.I. .. Evenko] / Mescon Michael , Albert Michael , Hedouri F Ranklin . [Acad. Nar households under the Government of Ros. Federation, Higher. school Int. business]. — Moscow: Delo LTD, 1994. — 701 p.
8. G. Mintzberg , From the years and the fall of strategic planning [Text] / G. Mintzberg trans. from English. K. Sysoeva. — K.: Oleksiy Kapusta, 2008. — 412 p.
9. Han D. Planning and Control: The Concept of Controlling [Ed. and with a foretaste. Turchak AA, Golovacha LG, Lukashevich ML] / Khan D. — M .: Finances and statistics. — 1997. — 800 c .
10. Armstrong J . S . Relative accuracy of judgmental and extrapolative methods in forecasting annual earnings / J.S. Armstrong // Journal of Forecasting. – 1983. – №2. – P. 437-447.
11. Steiner G.A. Management Policy and Strategy: Text, Readings and Cases./ G.A. Steiner, J.B. Miner – New York: McMillan – 1977.
12. Thompson T.J. Strategic Management: Concept and Cases. / Thompson T.J., Stricland A.J. [4th ed.] Plano: Business Publication. ТХ – 1987.